Abstract
The paper presents results of investigation of hydropneumatic strut on indicator test stand. On this stand the force versus displacements and force versus velocity loops were determined. The research were made for changeable static pressure corresponding static load of car with hydropneumatic suspension system. Based on results of investigation the damping characteristics as a function of velocity were determined.
1. Introduction
In the case of a hydropneumatic column indicator diagram defines the total force of restitution and resistance as a function of displacement. Loading and unloading curves have different waveforms to form the graph hysteresis loop [1-6]. An example of a theoretical hysteresis loop whose shape corresponds to an ellipse in the case of linear damping presented in Fig. 1.
Fig. 1View of theoretical hysteresis loop (force vs. displacement diagram)
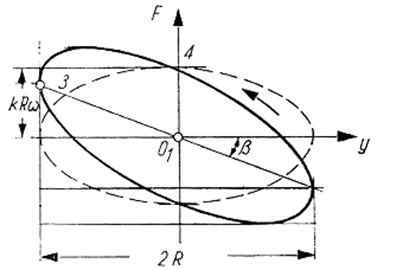
Damping ratio is equal to the ratio of the force which is determined by the intersection graph of the abscissa (point 4 in Fig. 2) to the product the angular frequency and the length of the arm (). By determining the force ( in point 4) damping ratio can be get by relationship:
The value of the contractual stiffness is equal to the tangent of the angle of inclination line passing through the origin and the point of contact sheet with lines parallel to the -axis (point 3 in Fig. 2) at the points of maximum stroke (2), hence the contractual stiffness is expressed by the relation:
In the case of loops obtained for hydropeumatic strut their shape often deviate from the shape of the ellipse, due to the asymmetric and non-linear damping characteristics and for other reasons as inertia of valves, cavitations.
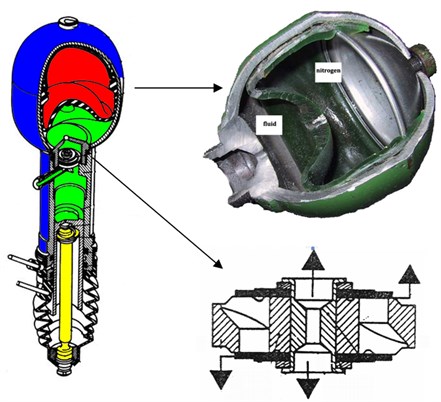
Fig. 2Hydropneumatic strut, sphere and dumper
2. Hydropneumatic strut
Determining of damping characteristic of hydropneumatic strut is carried out in conjunction with a gas spring (the gas spring is part of hydraulic cylinder) – Fig. 2. In hydropneumatic suspension the role of spring elements takes gas spring with constant mass of gas (nitrogen). Gas and oil are separated by special membrane. Suspension vibration causing changes in the volume and pressure of gas. The fluid flows through the gland – central hole and holes around overshadowed disc springs. This elements plays the role of shock absorber in hydropneumatic strut. Dimensions of central hole and holes around and disc spring characteristic determine the characteristics of hydropneumatic strut.
In the case of hydro-pneumatic suspension static clearance is independent of the load, the full range of spring deflection is equal to the dynamic deflection. So there is no situation to reduce the wheel stroke range with an increase of static load, which allows the use of a gas spring with low coefficients of stiffness ensuring a high comfort, compared to spring rates of coil spring used in the mechanical suspensions.
Fig. 3Hydropneumatic front BX sphere parameters – volume versus pressure (corresponding to static load) (piston area S= 380·10-6 [m2]; p0= 5.5 MPa; V0= 400·10-6 [m3])
![Hydropneumatic front BX sphere parameters – volume versus pressure (corresponding to static load) (piston area S= 380·10-6 [m2]; p0= 5.5 MPa; V0= 400·10-6 [m3])](https://static-01.extrica.com/articles/15510/15510-img3.jpg)
The hydropneumatic suspension of gas springs are used at a constant gas mass spring, which are defined by two parameters: the nominal pressure and the nominal volume . These two parameters are specified for a state where on membrane does not affect the pressure of fluid. The pressure and volume changes from nominal parameters to static parameters for the static load and required position of the vehicle (Fig. 3). Slow changes in pressure in the sphere when establishing permanent vehicle clearance and achieving static parameters value is the achieved by assumption isothermal transformation (as opposed to dynamic loads which assume polytropy transformation).
3. Test stand and measurement system
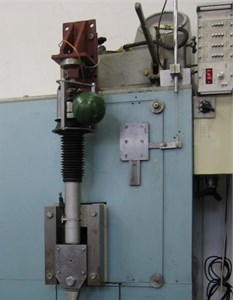
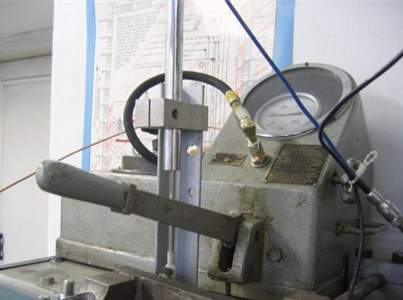
Determining of damping characteristic [7-12] of hydropneumatic strut is carried out in conjunction with a gas spring, so it is necessary pressurizing of fluid in hyropneumatic strut. For this purpose was used single section hand pump or this purpose was used single section hand pump. View of laboratory test stand with build in hydropneumatic strut and hydraulic pump is presented on Fig. 4.
Fig. 4View of laboratory test stand and hydraulic pump
a)
b)
The measurement system used in test is shown on Fig. 5. The force sensor CL 16 and displacement transducer PTx-200 was used to measurement of force and displacement. The analyzer SigLab 20-22 was used to recording signals.
Fig. 5Scheme of measurement system
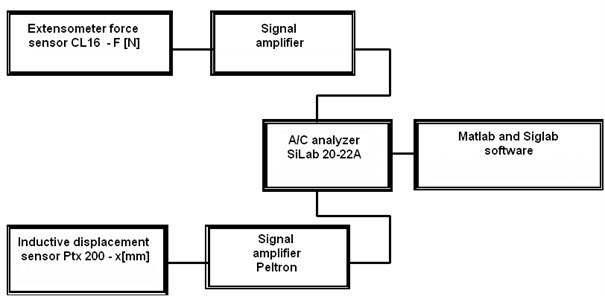
In the case of the force sensor CL 16 accuracy class of 0.5 % is relative to the result of a measurement in the range of 10 % to 100 % range of the sensor. Displacement transducer is characterized by a basic error of 0.5 % of the measuring range. The analyzer SigLab 20-22 overall accuracy: ±0.0025 % of full scale.
4. Methodology of signal processing
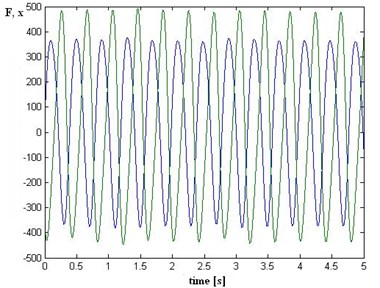
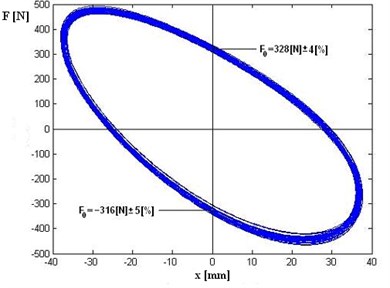
After installing the hydropneumatic strut to the test stand, and check the correctness of the assembly process followed warm up of the cold fluid in strut (work for about 60 [s]). After an initial warm-up followed data acquisition were made. The time realization of recorded signal and close loop force vs. displacement are presented on Fig. 6.
Fig. 6Recorded signals: a) time realization of displacement (x) – blue line and force (F) – green line, b) close loop force vs. displacement for few cycles
a)
b)
Time realizations imposed for subsequent complete cycles to give the closed loops (force versus displacement diagrams). The next step was determining the average loop and value of the forces for damping characteristics. (The value of force for displacement zero – maximum linear velocity, separately for compression and decompression). Determination of the damping characteristics based on the average value of force in point of maximum velocity is characterized by small uncertainty below 5 %.
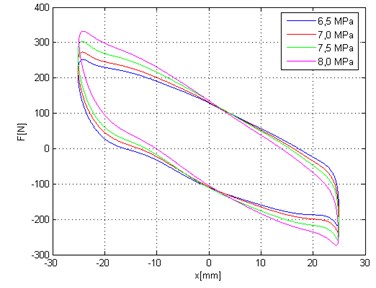
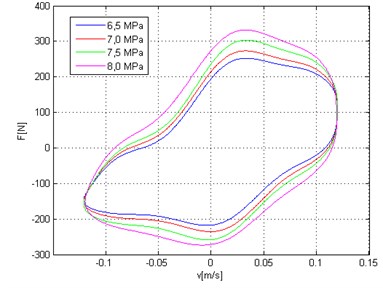
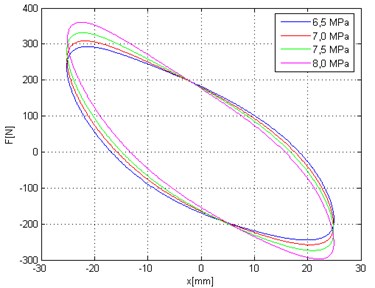
Measurements were made for different static pressure (corresponds to static load of vehicle) and for constant stroke 50 [mm]. The averaged loop of force vs. displacement and force vs. linear velocity are presented on Fig. 7 and 8.
Force vs. displacement and force vs. linear velocity (Fig. 7) are average loop determined for maximum linear velocity 0.12 m/s. The diagrams presented influence of static pressure (load) on loop shapes. The shapes of loops are similar but the angle between loop and axis is increases. That corresponds to theoretical hysteresis loop presented on Fig. 1 and to increase of contractual stiffness.
Fig. 7Force versus displacement diagram and force versus velocity diagram (vmax= 0.12 m/s) – different colors correspond to static load of hydropneumatic strut
a)
b)
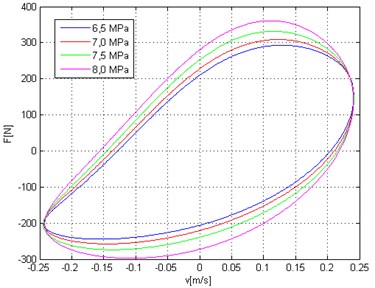
Force vs. displacement and force vs. linear velocity (Fig. 8) are average loop determined for maximum linear velocity 0.25 m/s. The shape of loops are similar too but the angle between loop and axis is increase (increase of contractual stiffness). For higher velocity value (0.25 m/s) the shape of loop is more similar to theoretical ellipse shape.
Fig. 8Force versus displacement diagram force versus velocity diagram (vmax= 0.25 m/s) – different colors correspond to static load of hydropneumatic strut
a)
b)
5. Conclusions
The test results are only part of the tasks performed research of hydropneumatic suspension properties. Designated damping characteristics to allows a simulation research of vehicle model with hydropneumatic suspension.
References
-
Dixon J. C. The Shock Absorber Handbook Society of Automotive Engineers. Inc., Warrendale, PA, 1999.
-
Burdzik R., Gardulski J., Konieczny Ł. Methodology for determining the damping forces of the hydropneumatic strut on t indicator test stand. Overview of Mechanical Engineering, Vol. 2, 2007, p. 38-40.
-
Konieczny Ł. Determination of the damping characteristics of hydropneumatic strut taking into account the chosen parameters. Transportation, Scientific Papers of Silesian University of Technology, Vol. 69, 2010, p. 85-89, (in Polish).
-
Konieczny Ł., Burdzik R., Warczek J. Determinations of shock absorber damping characteristics taking stroke value into consideration account. Diagnostics, 2010, Vol. 3, p. 51-54, (in Polish).
-
Konieczny Ł. The statistical analysis of damping parameters of hydraulic shock absorbers. Diagnostics, Vol. 15, Issue 1, 2014, p. 49-52, (in Polish).
-
Lanzendoerfer J. Research of Car Vehicles. WKiŁ, Warszawa, 1997, (in Polish).
-
Czop P., Sławik D., Włodarczyk T. H., Wojtyczka M., Wszołek G. Six sigma methodology applied to minimizing damping lag in hydraulic shock absorbers. Journal of Achievements in Materials and Manufacturing Engineering, Vol. 49, Issue 2, 2011.
-
Konieczny Ł., Gardulski J. Application of simulation researches in diagnostic's of vehicle hydropneumatic suspension. Transport Problems, Vol. 2, Issue 1, 2007, p. 13-21.
-
Konieczny Ł., Burdzik R., Łazarz B. Analysis of properties of automotive vehicle suspension arm depending on different materials used in the MSC. Adams environment. Archives of Materials Science and Engineering, Vol. 58, Issue 2, 2012, p. 171-176.
-
Michalski R., Wierzbicki S. An analysis of degradation of vehicles in operation. Maintenance and Reliability, Vol. 37, Issue 1, 2008, p. 30-32.
-
Potocki W., Citroen B. X. Citroen BX. WKiŁ, Warszawa, 1996, (in Polish).
-
Warczek J., Burdzik R., Peruń G. The method for identification of damping coefficient of the trucks suspension. Key Engineering Materials, Vol. 588, 2014, p. 281-289.
About this article

