Abstract
The paper presents results of vibro-acoustic signal analysis (acceleration of the unsprung mass of car actuated to vibration by harmonic, kinematic vibration). The passenger car Citroen BX 14 TGE with hydropneumatic suspension and standard tire (165/70 R14 nominally pressure 1.8 [bar]) was researched. The range of research has included tire pressure changes. For the analysis process Short Time Fourier Transform method was used with superposition of rectangles window and with zero complement method. On STFT spectrum resonance frequency of unsprung mass was identified.
1. Introduction
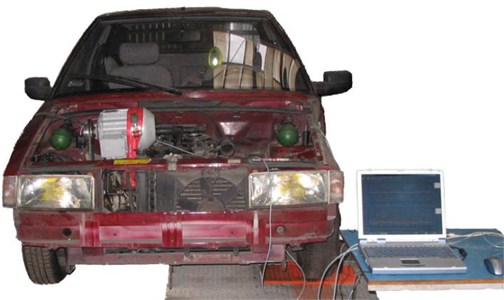
The research was done in Laboratory of Vehicle Suspension Dynamic in Faculty of Transport, Silesian University of Technology. The research of shock absorber built in vehicle was realized on laboratory test stand with vibration excitation (continuous of frequency regulation in 0-21 Hz range). This test stand was controlled by inverter. The passenger car Citroen BX 14 TGE with hydropneumatic suspension and standard tire (165/70 R14 nominally pressure 1.8 [bar]) was researched. The front suspension system is McPherson strut. This car has passive hydropneumatic suspension (which corrects static load and keeps constant clearance of body) [1-6]. The vehicle on test stand is presented on Fig. 1.
Fig. 1Citroen BX 14 TGE with hydropneumatic suspension on test stand
The accelerations of platform, sprung and unsprung mass were recorded. The signals was recorded in digital form with 500 Hz sampling frequency. The scheme of measurement system is showed on Fig. 2.
Fig. 2Scheme of measurement system

For acceleration measure were used the ADXL 204 and ADXL 321 sensors produced by Analog Devices. These are modern parametric sensors built in chip. Table 1 shows the parameters of these sensors.
Table 1Parameters of ADXL sensors
ADXL 204 | ADXL 321 | |
Measurement range | ±1,7 g | ±18 g |
Nonlinearity | 0.2 % FS | 0.2 % FS |
Sensitivity | 595 mV/g | 57 mV/g |
Frequency band | 2,5 kHz | 2,5 kHz |
Resonant frequency of sensor | 5,5 kHz | 5,5 kHz |
Temperature range | –55 ... 125°C | –20 ... 70°C |
Power supply | 3-6 V | 3-6 V |
There was used data acquisition card μDAQ 30 connected with personal computer by USB port. This card is analog/digital converter for maximum 8 channel with resolution 14 bits and sampling frequency 250 kHz.
There were recorded accelerations in chosen measure points (Fig. 3):
– Vertical accelerations of body;
– Vertical accelerations of wheel;
– Vertical accelerations of test stand platform.
Fig. 3Accelerometers on measurement points
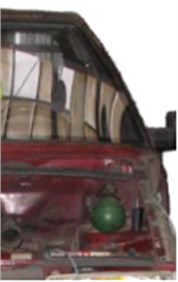
a)
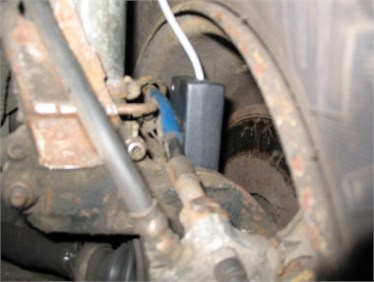
b)
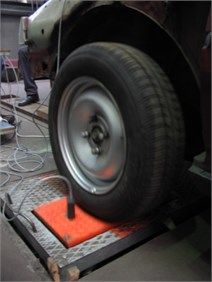
c)
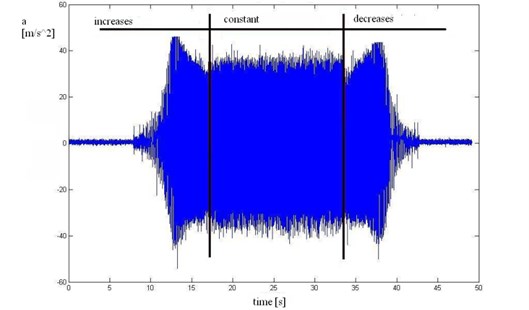
The example time realization of unsprung mass with each of the three phases of vibration excitation is showed on Fig. 4.
Fig. 4Example time realization of unsprung mass accelerations
2. Method of analysis
The digital signals of accelerations were analysed with MatLab software. Of the many methods for processing signals simultaneously in the time and frequency domain the STFT is a simple and effective method is widely used in machine diagnostics [7-16]. For the analysis this no stationary signals (signals with changeable frequency) the Short Time Fourier Transform method were used. The result of this method is 3-dimensional spectrum presenting the behavior of signal amplitude in time and frequency domain.
The Short Time Fourier Transform equation:
where: () – window width.
In STFT method, frequency analysis (FFT) is made for the following fragment of signal multiply by window function with constant width . The following fragments are analysed independently. The main disadvantage of this method is constant width of window (using narrow window in time domain we can get good time resolution but in the resolution in frequency domain will be worst). So the windows width is some kind of compromise between resolution in time and frequency domain.
One way of improving the resolution in frequency domain for the single fragment of FFT analysis, is zero-complementing method. In this process to the original signal are added samples with zero value of amplitude to increase length of this signal (this method should be used carefully because the law of decreasing profits is valid here). The shape of the window is also very important. For rectangle window the jump changes at the beginning and at the end of windows are the source of leak in spectrum. For minimalizing of this effect can be used other windows decreasing the amplitude for the beginning and the end (for example triangle, Hanninga, Hamminga) [15, 16].
The next way of improving the selectivity of STFT method is superposition of windows (each sample is used several times for single FFT process).
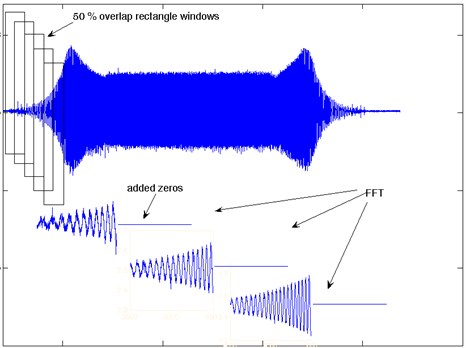
In this research the acceleration of unsprung mass was analysed by STFT with the rectangle window. Each fragment was 100 % elongated by using complement zero method and analysed with FFT process. The windows were superpositioned in 50 % – Fig. 5.
Fig. 5STFT procedure with overlap and with added zeros
There was obtained STFT spectrum with 1 Hz resolution in frequency domain. In this spectrum the frequency band (Fig. 6) with resonance frequency was isolated (middle frequency was 12 Hz, width of frequency band 3 Hz).
Fig. 6The example of STFT spectrum with sign middle frequency 12 Hz
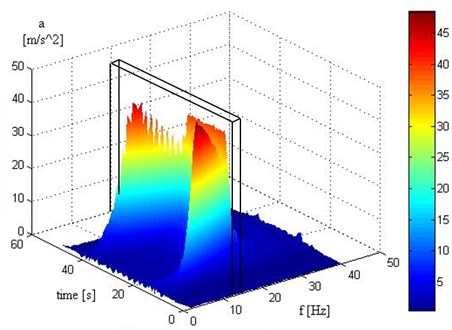
Fig. 7 presents time section of STFT for chosen frequency band (11-13 Hz) including the resonance frequency of unsprung mass. Average of maximum amplitude in this band for phase increases frequency and phase decreases frequency was determined.
Fig. 7Time section of STFT for chosen frequency band
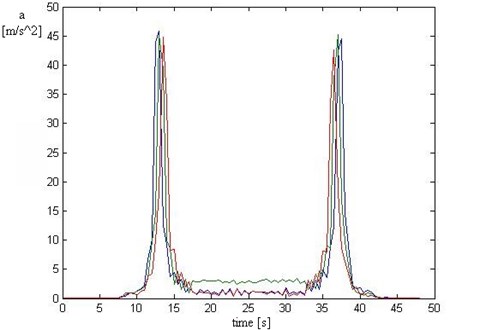
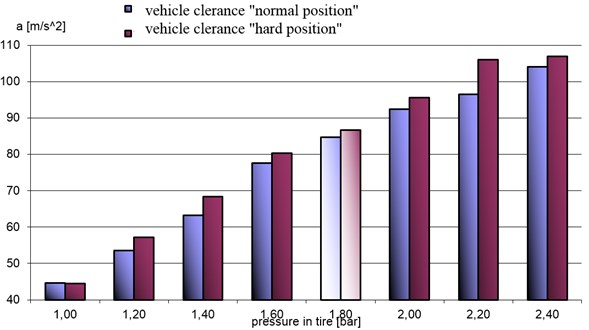
Fig. 8Average accelerations in analyzed band in tire pressure function
3. Conclusion
Average of maximum amplitudes in band 11-13 Hz for phase increases frequency and phase decreases frequency was determined. The results of these values are showed on Fig. 8. The research was conducted for two vehicle clearance value (normal and high position of hydropneumatic suspension).
Changes of pressure in tire (tire stiffness) causes increase of accelerations value in analyzed band. This is a result of the increase stiffness (increase pressure) of tire and shift of resonance frequency of unsprung mass (the analyzed band was constant).
References
-
Burdzik R., Konieczny Ł. Diagnosing of shock absorbers of car vehicles at changeable pressure in tires. Diagnostics, Vol. 3, Issue 51, 2009, p. 27-32, (in Polish).
-
Konieczny Ł., Burdzik R., Łazarz B. Analysis of properties of automotive vehicle suspension arm depending on different materials used in the MSC. Adams environment. Archives of Materials Science and Engineering, Vol. 58, Issue 2, 2012, p. 171-176.
-
Konieczny Ł., Gardulski J. Application of simulation researches in diagnostic’s of vehicle hydropneumatic suspension. Transport Problems, Vol. 2, Issue 1, 2007, p. 13-21.
-
Konieczny Ł. Determination of the damping characteristics of hydropneumatic strut taking into account the chosen parameters. Transportation, Scientific Papers of Silesian University of Technology, Vol. 69, 2010, p. 85-89, (in Polish).
-
Konieczny Ł. The use of nonlinear effects in the vibro-acoustic diagnosis of hydropneumatic suspension. Transportation, Scientific Papers of Silesian University of Technology, Vol. 74, 2012, (in Polish).
-
Konieczny Ł. Identification of damping characteristic of hydropneumatic strut for example front column Citroen C5. XVI Scientific Conference of Vibroacoustics and Vibroengineering, XI Polish Seminar Vibroacoustics in Technical Systems, Krakow, 2012.
-
Burdzik R. Material vibration propagation in floor pan. Archives of Materials Science and Engineering, Vol. 59, Issue 1, 2013, p. 22-27.
-
Burdzik R. Monitoring system of vibration propagation in vehicles and method of analysing vibration modes. Springer, Heidelberg, 2012, p. 406-413.
-
Dąbrowski Z., Deuszkiewicz P. Designing of high-speed machine shafts of carbon composites with highly nonlinear characteristics. Key Engineering Materials, Vol. 490, 2011, p. 76-82.
-
Grzeczka G. The analysis of possibility of using electromagnetic drive for autonomous biomimetic underwater vehicle. Solid State Phenomena, Vol. 196, 2013, p. 82-87.
-
Grządziela A. Analysis of vibration parameters of ship gas turbine engines. Polish Maritime Research, Vol. 2, 2006, p. 22-26.
-
Ragulskis K., Kanapeckas K., Jonušas R., Juzėnas K. Applications of torsional vibrations for vibro-driling operations. Mechanika, Vol. 17, Issue 5, 2011, p. 498-502.
-
Michalski R., Wierzbicki S. An analysis of degradation of vehicles in operation. Maintenance and Reliability, Vol. 1, Issue 3, 2008, p. 30-32.
-
Tuma J. Gearbox noise and vibration prediction and control. International Journal of Acoustics and Vibration, Vol. 14, Issue 2, 2009, p. 99-108.
-
Lyons R. Introduction to Digital Signal Analyze. Warszawa, 1999.
-
Zieliński T. Digital Signals Analyze. Warszawa, 2007.
About this article

