Abstract
Internal combustion engine is a complex system consisting of a large number of elements interacting in non-linear way, subjected to external excitations of various characters. In spite of more and more advanced investigation methods, assuming linearity as well as non-linearity, deterministic dynamics with stochastic excitations and the random dynamics, the engine model description is not complete. The successive step for better understanding of dynamic processes, necessary at the development and optimisation of control and on-board diagnostic algorithms of vehicles, seems to be the analysis performed by means of unified measure in various observation scales. The application of the scale-dependent Lyapunov exponent for the segmentation of vibrations signals and for the qualitative analysis of SI engines dynamics was discussed in the hereby paper.
1. Introduction
Automatic control and diagnostics, at more and more complex vehicle powertrain, requires full understanding of their dynamics and more precise models. Modern systems of obtaining data allow observation and recording of signals as well as the analysis of the achieved information necessary for the realisation of aims. Vibrations are the most often used signals in investigations of the mechanical systems dynamics. Developing the proper models of the selected systems is possible when the methods of qualitative analyses of vibrations – resulting from the deterministic and from the random dynamics – are properly chosen. In the first case the problem concerns not only regular vibrations but also chaotic ones formed due to a bifurcation or intermittent jumps between these two kinds of vibrations. It is well known, that irregular signals can be generated both by probabilistic and deterministic systems without any random excitations.
The dynamics detection process must take into account non-linearity of the investigated systems and processes in several practical applications [1]. These facts are reflected in the development of advanced analytical methods of non-linear time series [2, 3]. Several tools allowing to determine signals character can be used in their qualitative and quantitative investigations. The deterministic chaos theory indicates solutions for irregular behaviours caused by a sensitivity to changes of initial conditions caused by non-linear systems of the deterministic dynamics and few degrees of freedom. The fractal theory assumes the full randomness of the dynamic system and endless size of its state vector [4, 5]. The important model of this category of dynamic systems is process , which spectral power density is inversely proportional to power of a frequency. Signals of the spectral index exhibit anti-correlations, lack of correlations or long-term correlations, when the Hurst exponent H is assuming values: (0, ½), ½ or (½, 0) – respectively. The most often used and the most efficient investigation methods of multiscale, unstationary non-linear signals are based on a direct analysis of the system time series, complex networks (graphs) or phase trajectory as well as on complexity measures such as the Lyapunov exponent, entropy or fractal dimension. The Lyapunov exponent constitutes the averaged measure of the trajectory sensitivity to initial conditions, fractal dimension determines the box dimension , of the curve being the diagram of the discussed signal. Knowledge of an individual fractal dimension is not sufficient for the full characteristics of the tested signal, it is an averaged information related to the analysed scales range. In order to describe dynamics of the system consisting of several interwined fractals of various dimensions, it means multifractal, the spectrum of dimensions, called the singularity spectrum should be considered.
Problems of chaos and randomness in the modern on-board diagnostics of vehicles is the indispensable work tool [6, 7]. In spite of more advanced investigation methods the problem of the identification of components of deterministic and stochastic dynamics is open [8]. The results of utilising the measure allowing for the signal segmentation in consideration of its character in various observation scales, are presented in this paper. The scale-dependent Lyapunov exponent (SDLE) [9, 10] is the index by means of which the detection of the IC engine dynamics, based on the time series of vibration signal, was performed.
2. Multiscale measure of signals complexity
Let’s assume that the recorded signal represents time series , ,…, . Regardless of the fact whether the data originate from the observation of the non-linear system of chaotic or random dynamics, its reconstructed phase trajectory in delayed coordinates forms the vectors set: for 1,…, , where is called an embedding dimension and is called a delay. If the time series is random, often the reconstruction procedure transforms the self-affine process into the self-similar one in the phase space, and the values of , parameters are arbitrary, when 1. For chaotic dynamics systems, it is necessary to apply special optimisation methods (false nearest neighbours and autocorrelation functions for determining and parameters) for the correct reconstruction of the phase trajectory. The trajectory reconstructed according to the embedding rule has the shape changed by a smooth and mutually explicit transformation, remaining its topological properties. Just it has the complexity measures as the real trajectory.
When the Euclidean distance of two neigbouring trajectories in its initial moment is sufficiently small and their distances at and , (when ) are equal: and – respectively, then the sensitivity of the state trajectory, for the one-dimensional system can be described by exponential functions:
or:
Factors const of the exponential change of the distance between neigbouring trajectories, i.e. Lyapunov exponents, determine the averaged convergence or divergence rate of the system state with respect to its initial state. Negative values of all exponents indicate that the dynamics is not chaotic and the stability of the system is asymptotic. The presence of at least one positive exponent indicates the chaotic dynamics. The scale-dependant Lyapunov exponent is defined by the following dependence:
or equivalent:
where – for the time series – the smallest value is equal to the sampling period. The procedure of SDLE determining contains the following steps:
Step 1. Identification of vector pairs , of the reconstructed phase trajectory:
belonging to the shell and meeting a condition:
where: and , 1, 2, 3…, are arbitrarily selected small distances and:
Step 2. Time monitoring of vector pairs distances and averaging of this distance for each shell.
3. Scaling relations for signals of various dynamics
Let’s consider the noise process . Such process variance increases with time , and the averaged distance between neigbouring state trajectories evolves according to the equation:
From dependence Eqs. (8) and (4) we obtain:
Then, let’s assume that the analysed time series is the result of the system monitoring, in which a deterministic chaos occurs. From Eqs. (1) and (4) we obtain:
The scaling laws – in the presence of random excitations – are determined by:
The curves for different processes are show in Fig. 1.
Thus, the scale-dependent Lyapunov exponent is characterised by the different scaling laws for the time series of different dynamics.
In case of signals exhibiting different dynamics in dependence of the observation scale, the higher classified cases of scaling Eqs. (9), (10), (11) are seen in the curve pathway, successively from the highest to the lowest scale. The deterministic chaos identification is possible for a few hundred signal samples, while the noise requires much larger observation scale. When the signal dynamics is chaotic and random excitations occur, their presence is seen in smaller scales then the low-dimensional chaos range. The similar pathway is observed for systems in which the noise-induced chaos occurs. A random large-dimensional dynamics is seen in scales larger than chaotic. The signal instability caused by imposing of harmonic vibrations is observed as curve pathway deformations at near zero values, both for a random process and chaotic data. An increase of the noise variance value caused shifting of curve in the direction of larger scales.
Fig. 1Scaling curves of the scale-dependent Lyapunov exponent of models
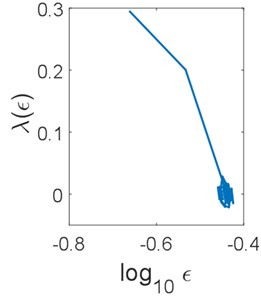
a) System of a random dynamics
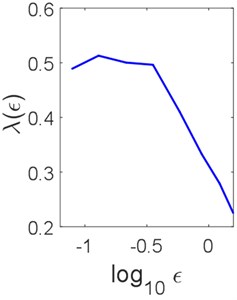
b) System with noise-induced chaos – logistic map
4. Signal segmentation and detection of the SI engine dynamics
Data originated from the road tests of 4-cylinder spark ignition engine of a capacity of 1.4 l, during driving on an express road with a constant load and rotational speed 3000 rpm at a stable thermal state, were used to determine SDLE. Signals of vibration accelerations of the engine head in the vertical direction – were recorded with a frequency of 65536 Hz from sensors mounted specially for the needs of experiments. The remaining signals originated from the sensor of the crank shaft angle of rotation and from the ignition system. The main measuring path included the piezoelectric vibration sensors B&K Delta Shear type 4393 of a frequency range: 0.1-16500 Hz, resonance frequency 55 kHz and work temperatures from –74 to +250 °C, fastened by means of a joint screwed into the engine side at cylinder 1, and the portable device for recording data B&K PULSE type 3560E. The signal was pre-processed with antialiasing filter to avoid amplifying the components in the natural frequency band of the vibration sensor. Then the vibration signal was resampled in order to equalise the number of samples analysed in each cycle of engine operations. This procedure enabled changing the domain from the time into the angle of rotation of the crankshaft, during the analysis [11].
Example of the multiscale Lyapunov exponent curve determined on the basis of the resampled signals of vibrations is shown in Fig. 2.
Fig. 2Scaling curve for the signal of accelerations of the SI engine vibrations
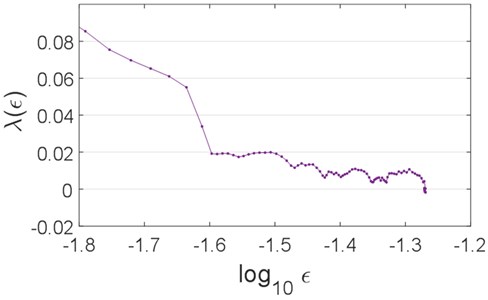
Analysis of the curves pathways indicates the scaling range (–1.6, –1.5), within which small measure fluctuations around the constant value corresponding to the highest Lyapunov exponent, were observed. This is the chaotic dynamics effect. A presence of stochastic excitations shifts this range in the direction of larger scales and simultaneously causes the SDLE values increase for small scales. Above the chaos range the trend resulting from noises (i.e. high-dimensional random dynamics) is seen. Deformations of curves pathways at the exponent values near zero indicate the polyharmonic vibrations.
5. Conclusions
The proper identification and characterisation of the dynamics of investigated systems and processes is the basic condition required for performing the non-linear analysis of time series. Monitored signals have various dynamic properties in dependence on the observation scale. The method utilising SDLE as the multiscale measure of complexity allowed for the segmentation of the vibration signal and qualitative, structural analysis of chaotic and random dynamics of the tested SI engine. The obtained results do not lead to the identification of the detailed dynamic model described by differential equations. However, this fact does not interfere with looking for new ways of solving on-board diagnostics problems of internal combustion engines. At various control phases and maintenance states the changes in slopes and levels of scaling curves should be expected. They will be within ranges corresponding to noises and indicating the deterministic chaos respectively.
References
-
Batko W., Dąbrowski Z., Kiciński J. Nonlinear effects in technical diagnostics. ITE – PIB, Radom, 2008.
-
Gao J. B. Complex systems and emergence: how theory meets reality. Advances in Mechanics, Vol. 43, Issue 4, 2013, p. 359-389.
-
Gao J. B., Cao Y. H., Tung W. W., Hu J. Multiscale Analysis of Complex Time Series – Integration of Chaos and Random Fractal Theory, and Beyond. Wiley, New York, 2007.
-
Kantelhard J. W. Fractal and multifractal time series. 2008, arXiv:0804.0747v1.
-
Butar F. B., Kale M. Fractal analysis of time series and distribution properties of Hurst exponent. Journal of Mathematical Sciences and Mathematics Education, Vol. 6, Issue 1, 2011, p. 8-19.
-
Merkisz J., Waligórski M. The application of the deterministic chaos method in the assessment of the combustion process in diesel engines fitted in non-road vehicles. Combustion Engines, Vol. 4, Issue 147, 2011, p. 87-97.
-
Puchalski A. Multiscale analysis of vibration signals in engine valve system. Journal of Vibroengineering, 2015, p. 16178.
-
Ravetti M. G., Carpi L. C., Goncalves B. A., Frery A. C., Rosso O. A. Distinguishing noise from chaos: objective versus subjective criteria using horizontal visibility graph. PLoS ONE, Vol. 9, Issue 9, 2014, p. e108004.
-
Gao J. B., Hu J., Tung W. W., Cao Y. H. Distinguishing chaos from noise by scale-dependent Lyapunov exponent. Physical Review E, Vol. 74, 2006, p. 066204-1-9.
-
Gao J. B., Hu J. Multiscale characterization of sea clutter by scale-dependent Lyapunov exponent. Mathematical Problems in Engineering, 2013, p. 584252, http://dx.doi.org/10.1155/2013/584252.
-
Puchalski A. A technique for the vibration signal analysis in vehicle diagnostics. Mechanical Systems and Signal Processing, Vols. 56-57, 2015, p. 173-180.
About this article

