Abstract
A contactless detection method based on the image processing algorithm is proposed to detect the geometric parameters of catenary. Aiming at the other obstacles in the image, the image edge is detected and enhanced by Canny algorithm, then the catenary image is extracted gradually through target tracking, image segmentation and breakpoint continuation. The corresponding relationship between the coordinates of contact line feature point and the 3D space coordinates measured by the binocular triangulation method is established to get the conductor height and the stagger value. According to the relevant theory, a catenary condition monitoring system is designed, which realizes the working state monitoring and the dynamic measurement of geometrical parameters for catenary.
1. Introduction
Now the high-speed rail network in China is the largest in the world. By end of 2015, there are about 19,000 kilometers of high-speed rail in service. According to the long-term extension plan, China will own about 50,000 kilometers high speed railway by 2020. Good pantograph-catenary property is an important prerequisite to ensure the safe operation of high speed trains. The rapid development of Chinese high-speed railway has led to increased attention towards the safety of the pantograph-catenary system. In order to reduce the wear of the pantograph and extend its service life, it laterally draws a zigzag on contact line. If the stagger value of contact line is too small, it will lead to exacerbate the wear of pantograph slide, but if it is too large, the contact line will exceed limited height and results in pantograph-catenary fault when the weather is bad [1]. Similarly, improper contact line height will lead to the deterioration of the pantograph-catenary property, cause disturbances of current collection and endanger the safe operation of locomotive.
In order to improve the detection accuracy and prevent from the pantograph-catenary accidents, there are lots of researches on the condition monitoring of the high-speed railway catenary in many countries. The online monitoring of contact force for pantograph-catenary was realized by the optical fiber sensors, and a test platform was established to evaluate the performance of the optical fiber sensors in the pantograph-catenary interaction [2]. According to the principle of the pinhole camera calibration, the corresponding relationship between the coordinates of the laser spot in the 2D image and the 3D space coordinates with the camera calibration was established to obtain the geometrical parameters of contact line [3]. The image of the pantograph-catenary was captured by the infrared camera in real time. And the segment-tracking algorithm was applied to monitor the bursts of arcing and the irregular positioning of contact line [4]. In order to detect the position of overhead wire, the edge of pantograph-catenary image was extracted by Canny algorithm, and then the image processing method was proposed to monitor the contact force and the arcing between pantograph-catenary system [5]. The Slawomir approximation algorithm was used to deal with the noise and the missing data of catenary image [6]. In this paper, the condition monitoring technology of high-speed railway catenary based on the image processing belongs to the contactless detection. The 3D space coordinates of the catenary are measured by binocular triangulation method. First, the image edge is detected and enhanced by Canny algorithm, then the catenary image is extracted gradually by target tracking, image segmentation and breakpoint continuation. The corresponding relationship between the coordinates of contact line feature point and the 3D space coordinates measured by the binocular triangulation method is established to get the conductor height and the stagger value. Finally, a set of catenary condition monitoring system is designed to realize the working-state monitoring and the dynamic measurement of geometric parameters for catenary.
2. Binocular triangular measuring method
This paper employs the IL-P1-4096 high-speed linear array CCD camera for image capture. The pixel linear array length is 41 mm, the adjacent pixel pitch is 10 μm, the number of linear array pixels is 4096, the linear array scanning rate is 87 kHz, the pixel size is 10 μm×10 μm, the dynamic response range is greater than 3200:1, the focal length is 12.5 mm. The schematic diagram of binocular triangular method is given in Fig. 1.
Fig. 1Binocular triangular method
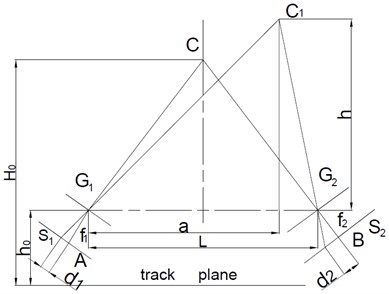
A triangle is formed with two cameras and a contact line, the contact line height is calculated by the uniqueness of the triangle solution. In Fig. 1, two cameras distribute symmetrically along the locomotive central line. is the mounting space of the camera and . and are the center points of camera focal plane and . and are the principal optic axes, and are the camera focal length. is the original position of contact line, is the lift position of contact line. is the original height of contact line, is the distance between and the horizontal plane of lens center, is the distance between the track plane and horizontal plane of lens center; is the distance between the projective point of on the focal plane and point , is the distance between the projective point of on the focal plane and point . is theangle between and , is the angle between and , and the angle between the principal optic axes of two cameras and horizontal plane of lens center . Set 60°, is the distance between the projection of on horizontal plane and .
From the triangle relations in Fig. 1:
The conductor height:
The stagger value:
Thus, the contact line uplift:
3. Image-extraction method
The pantograph-catenary image is captured in real time by CCD camera. Taking into account other obstacles (such as carrier cable, dropper, leaves and branches) in the image, and in order to obtain the contact line object, these obstacles must be removed from the image.
3.1. Canny edge detection algorithm
In edge detection, the image edge is extracted by the operator template and the image convolution. The common differential operators are Sobel, Roberts, Canny, and so on. The edge detection needs to adopt the optimal algorithm and get the optimal edge template, so the image edge should be extracted by Canny algorithm [7, 8].
Canny algorithm mainly consists of 4 steps [9]: image smoothing, gradient calculation, non-maxima suppression, and double threshold detection.
(1) Image smoothing. Canny algorithm selects the Gauss function to smooth the image and eliminate the noise, which is equivalent to the convolution of the image signal. Gauss function is:
Suppose is the smoothed-image function, using to smooth the image can be expressed as:
where, * is convolution.
(2) Gradient calculation. Using first-order difference to calculate the amplitude and direction of gradient, first-order difference convolution template can be expressed as:
Fig. 2Explanation of Eq. 12
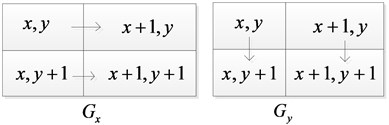
The 2×2 neighborhood first-order finite difference can be used to calculate the gradient amplitude and gradient direction of smoothed image:
where is the row action of filter. is the column action of filter.
(3) Non-maxima suppression. In order to determine the edge, only the global gradient is not enough, but also to preserve the maximum of local gradient and suppress the non-maximum. The circumference is divided into four sectors. The gradient angle is one of the four sectors, the label of four sectors is 0 to 3, and the corresponding four combinations of 3×3 neighborhood are shown in Fig. 3.
Fig. 3Non-maxima suppression
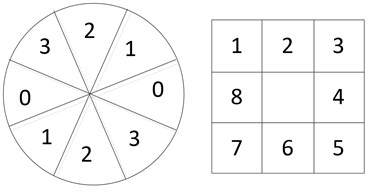
For each point, if the gradient amplitude of the pixel is less than the gradient amplitude of the two adjacent pixels along the gradient line, set 0.
(4) Double threshold detection. Two thresholds of suppressing the non-maxima are and , where . Suppose the pixel gray value with gradient value less than is 0, then image 1 is obtained. And suppose the pixel gray value with gradient value less than is 0, then the image 2 is obtained. Because of the low threshold of image 1, a lot of information is retained. The image 2 has a high threshold, which removes most of the noise, but also the useful edge information is lost. The image edge is connected based on the image 1 and 2. The original pantograph-catenary image is shown in Fig. 4.
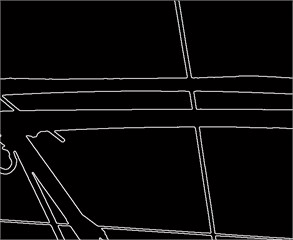
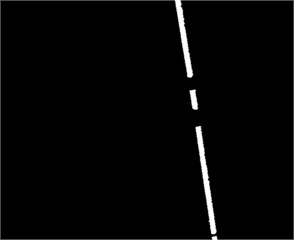
The image detected by Canny algorithm is shown in Fig. 5.
Fig. 4Original pantograph-catenary image
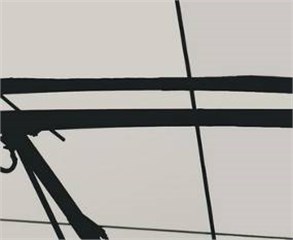
Fig. 5Image detected by Canny algorithm
3.2. Image edge enhancement
The target edge of the contact line should be distinguished from the other obstacles after the original image is detected by Canny algorithm. In the pantograph-catenary image, the contact line is the vertical direction, and the pantograph is the horizontal direction, so the vertical edge of the image should be enhanced, that is to make vertical differential for grayscale images.
Differential is approximated by a difference table, and the image gradient can be calculated according to Eq. (16):
Table 1Vertical differential convolution Kernel
0 | 0 | 0 |
–1 | 1 | 0 |
0 | 0 | 0 |
Gradient direction edge enhancement is used to enhance the edge of the different directions. These directions are north, northeast, east, southeast, south, southwest, west and northwest. The convolution sum distribution of these directions shown in Fig. 6.
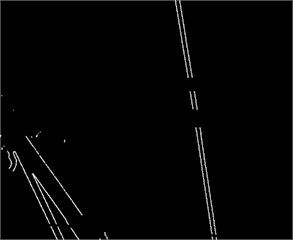
The image processed by differential is shown in Fig. 7.
Fig. 6The convolution sum distribution
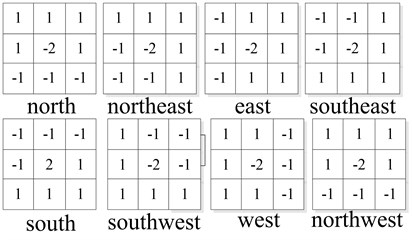
Fig. 7Image processed by differential
3.3. Target tracking and position search
Through the vertical differential, horizontal edge is eliminated roughly. However, there being still some obstacles in the vertical edge are not removed. In order to extract the contact line target better, a certain range should be set to track and determine the contact line position.
1) Depending on the contact line position in the previous frame, the contact line position is estimated within the range from –25 to +25 pixels, and then it is determined within the range from –15 to +15 pixels [10-12].
2) Obtaining the slope of contact line. After getting the position of contact line in the first step, lines of the image are searched and points on the contact line are obtained. The slope of the contact line is acquired by the coordinates of these points. The overall position of the contact line is fitted by the least square method.
3) Through the contact line position of the second step, image is processed with the region growing method. Because the image is binary image whose edge is white, that is, gray value is 255. Pixels whose gray value is 255 as the seed point and the 1.5 times width of the contact line as the search areas, the adjacent region is searched.
The adjacent pixels with the same gray value form a region, which is regarded as the suspected target; otherwise the region is processed as background, the corresponding gray value is 0.
Image processed by above steps is given in Fig. 8.
Fig. 8Image processed by above steps
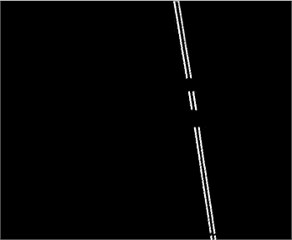
Fig. 9Image through the expansion and corrosion
3.4. Image segmentation and breakpoint continuation
Mathematical morphology analyses and describes the image from the perspective of the set and its operations are defined by the set. The image information is transformed into a set in a reasonable way in order to describe various geometric parameters and features of the image. Mathematical morphology includes dilation, erosion, opening and closing operation.
The dilationoperation merges the background points around the image into the objects, and it used to fill in the hole of the object processed by image segmentation. Dilation operation can be expressed as , the dilation of the set and the structural element is defined as:
where means the translation distance of is , stand for intersection. dilating is equal to the set of the original location of when there is at least one non-zero intersection point between the displacement of and set . In this paper, the image is dilated along the horizontal direction. The width of is defined as the 13 width of the contact line in the target image, the original point is located at the center point.
Erosion operation can be expressed as , its role is to eliminate the boundary points of the object. Suppose is the set of image region, is the structural element with an original point. eroding is equivalent to:
The edge width has been contracted through erosion. The structure element is defined as the horizontal direction, its width is equal to the width of the structure element through dilation, that is, 1/3 width of the contact line. The image through the dilation and erosion is shown in Fig. 9.
Fig. 10Breakpoint continuation
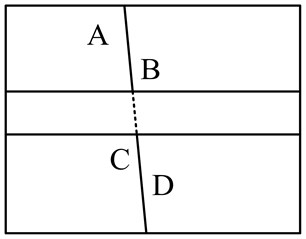
Fig. 11Image through breakpoint continuation

As the pantograph edge is removed, there is a breakpoint on the edge of contact line, the target image of the contact line is not continuous in Fig. 9. In the breakpoint position, the target center position can’t be determined, and it can be obtained by the breakpoint continuation, and then the target geometry parameters are obtained.
Breakpoint continuation principle is shown in Fig. 10. The target disappears after the position of point being detected. When the position of point is detected, the target appears again. Because the contact line in the image is a straight line, when the slope of line is equal to the slope of line the breakpoint between was filled. The image through breakpoint continuation is shown in Fig. 11.
4. Parameter calculation
According to the 2D coordinates of contact line through image processing, the stagger value and the conductor height are obtained, combined with the 3D space coordinates determined by binocular triangular method.
Setting 500 mm, 200 mm, 600 mm, 60°, the focal length 2.5 mm, the pixels number of contact line of the two cameras are 127 and 145, respectively. So the image width of contact line of the two cameras is:
According to Eq. (3) and (4):
Substituting and into Eq. (5): 386 mm.
According to Eq. (6), 1000 mm, combining with Eq. (7):
According to Eq. (8), the conductor height 138642005586 mm.
According to Eq. (9), the contact line uplift 5586 5500 86 mm
5. Condition monitoring system
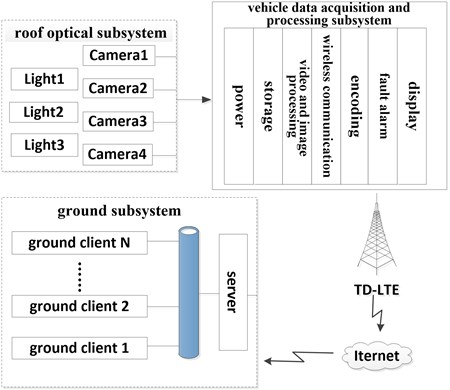
The condition monitoring system for catenary is based on HI3521 chip and the embedded Linux operating system, combined with the 4G wireless communication technology and Beidou satellite signal transmission technology. It has the characteristics of high reliability, good stability, fast response, and so on. The monitoring system consists of the roof optical subsystem, the vehicle data acquisition and processing subsystem and the ground subsystem. The system is shown in Fig. 12.
The roof optical subsystem consists of two linear array CCD cameras, two planar array CCD cameras and three lights. This subsystem mainly realizes the fault image capture and working state monitoring of catenary, and it can get the video and image of catenary working state.
Vehicle data acquisition and processing subsystem consists of storage unit, video and image processing unit, wireless communications unit, Beidou satellite communications unit and fault alarm unit. The system realizes the real time display, image processing, automatic detection of the geometric parameters for catenary. When the stagger and the conductor height exceed the limit, the system will carry out the voice and the text alarm, and it obtains the kilometer post, velocity, locomotive number, and so on. The locomotive fault information and operation parameters are transmitted to the ground operation control center in real time by the 4G communication unit and the Beidou satellite signal transmission unit.
The ground subsystem is composed of the ground server and the ground client. The working condition of the catenary is monitored by means of the vehicle-ground wireless communication technology. The video and image data transmitted by the vehicle system is received. This system analyzes dynamically the fault information of catenary and provides remote technical support for the fault diagnosis of catenary.
The system used in a locomotive depot is tested by vibration, temperature, mechanical shock, dust, and so on. The whole system runs stably, which provides a reliable guarantee for the catenary state monitoring.
Fig. 12The condition monitoring system
6. Conclusions
With the rapid development of image processing technology, contactless image detection will become the focus of the future development for the catenary detection technology. In this paper, the geometric parameters detection of catenary is explored based on the image processing, and the dynamic measurement of conductor height and stagger value for catenary is achieved. The catenary state monitoring system developed by above theory is stable and reliable, and it provides a strong guarantee for the prevention of the pantograph-catenary accident.
References
-
Wan Y. Research on Reliability Design Method of Catenary System Based on RBFNN. Ph.D. Thesis. Southwest Jiao Tong University, 2006, p. 32-35.
-
Boffi P., Cattaneo G., Amoriello L., et al. Optical fiber sensors to measure collector performance in the pantograph-catenary interaction. IEEE Sensors Journal, Vol. 9, Issue 6, 2009, p. 635-640.
-
Zhang G. N., Li Z. G., Liu W. Q., Han Z. W. Non-contact detection of conductor height and stagger of conduct line based on camera calibration. Journal of China Railway Society, Vol. 36, Issue 3, 2014, p. 25-30.
-
Landi A., Menconi L., Sani L. Hough transform and thermo-vision for monitoring pantograph-catenary system. Proceedings of the Institution of Mechanical Engineers. Part F: Journal of Rail and Rapid Transit, Vol. 220, Issue 4, 2006, p. 435-447.
-
Aydin I., Karakose M., Akin E. A new contactless fault diagnosis approach for pantograph-catenary system. 15th International Symposium, Mechatronika, 2012, p. 1-6.
-
Slawomir J., Leszek J. Algorithm for automatic wear estimation of railway contact strips based on 3D scanning results. International Conference and Exposition on Electrical and Power Engineering, Romania, 2014, p. 724-729.
-
Fan L. H. Canny edge detection algorithm. Journal of Knowledge Economy, Vol. 16, 2009, p. 113-114.
-
Chen Y. L., Zhu C. H. Improved edge detection algorithm based on canny operator. Journal of Computer Application Software, Vol. 25, Issue 8, 2008, p. 51-53.
-
Song Y., Chen K., Lin J. L. Edge detection algorithm based on image block. Journal of Computer Engineering, Vol. 36, Issue 14, 2010, p. 196-197.
-
Zhang T. Research on Detection System of Catenary Based on Image Processing. Southwest Jiao Tong University for Master Degree, 2008, p. 21-27.
-
Yu W. J. Catenary inspection technology. West Rail Technology, Vol. 2, 1996, p. 65-87.
-
Li W. H., Luo J., Zhang Q., Chen W. R. Overview of pantograph-catenary relationship in high speed railway. Electric Railway, Vol. 4, 2009, p. 40-44.
About this article

This work was supported by the National Natural Science Foundation of China (Grant No. 51165001), Guangxi Natural Science Foundation Program (Grant No. 2013GXNSFAA019297) and Guangxi Science and Technology Key Projects (Grant No. 1598009-6).
