Abstract
This paper investigates several number of methods; Wavelet Packet Energy (WPE), Time-domain features and Multipoint Optimal Minimum Entropy Deconvolution Adjusted (MOMEDA) which are efficient of extracting features in fault diagnosis of rotating machinery. The database, which is attained via Bearing Data Center of Case Western Reserve University (CWRU), includes signal samples related to the different faulty cases and severity levels of bearing type 6205-2RS JEM. Throughout the research, combination of different faulty sample signals which are segmented into different number of periods, one of which is so called one-period analysis, of rotation of the motor are used in order to classify early faults of bearings and five class severity levels of ball bearings. Upon using proposed approaches, an outstanding classification performance of 100 % and 99,7 % are observed in specificity of early faults by the use of one-period analysis and five severity level classification of ball faults, respectively.
1. Introduction
Condition monitoring and diagnosis of rotating machinery using vibration based sensors have always been a challenging problematic since a highly distinctive fault representation with an acceptable detection performance is hard to achieve especially due to the possibility of multi-fault presence and environmental noise. In addition, it is vital to detect faulty cases in early-phase to maintain its safety and reliability.
Rotating element bearings (REBs) are one of the most common structure in rotating machinery [1]. There are several possible failure modes which effects inside or outside ring of the rolling elements or cage structure. Among all, bearing rolling element fault is the most dominant failure [2] and detection of such kind of failures is maintained by model based and data-driven methods using sensor data.
Various methods have already been proposed in recent literature for fault detection of REBs. Continuous Wavelet Transform (CWT), Gabor wavelets, wavelet transform [3], Hilbert-Huang Transform and Support Vector Machines [4], kurtogram and envelope analysis [5], time-domain analysis in connection to fuzzy C-means [6] and statistical features [7] are proven the efficiency in REBs fault diagnosis.
This paper proposes several methods to diagnose REBs faulty modes in early phase in addition to severity classification of ball bearings on a database which is remarkably focused in the literature over the last decade [1]. Among all techniques utilized in this research, MOMEDA feature extraction scheme is considered to be the most efficient in classifying REBs faults in multi-fault classification of early cases and multi-level fault severity classification.
The organization of this paper is as follows: The database acquired for the research is explained in Section 2. Feature extraction methods and the techniques of extraction of features subjected to this study are given Section 3. Experimental results and the proposed methodology are demonstrated in Section 4. Finally, conclusion part is presented in Section 5.
2. Database and segmentation
Case Western Reserve University provides a database which includes accelerometer based vibration signals that are retrieved by a test rig in laboratory environment. The database has four main classes; healthy case (HC), ball faults (BF), inner race faults (IRF) and outer race faults (ORF) that allows up to four level of severity classification (0.18, 0.36, 0,53, 0,71 mm in diameter) and multi-fault diagnosis of rotating machinery bearings [8]. The datasets utilized in this research include faulty signals which are collected by accelerometer sensors, localized at drive end of deep groove ball bearings of the type 6205-2RS JEM, recorded at 12 kHz and healthy signals of 48 kHz, which then downsampled to 12k sampling rate, may be seen in Table 1. In the segmentation process, three different approaches taken into account; Dataset A is constructed covering five periods of rotation of the motor (5) inspired by the study in [4] and includes 2000 data points in each sample. Datasets B, C and D are generated by preserving one () and one and a half period (1,5) of rotation of the motor in each sample.
Table 1Description of classified cases and datasets
Dataset | Fault type | Severity | Segmentation period | Rotation speed (RPM) | Total samples | Label |
A | HC | – | 5 | 1797 | 60 | A1 |
BF | 0.18 mm | 60 | A2 | |||
BF | 0.36 mm | 60 | A3 | |||
BF | 0.53 mm | 60 | A4 | |||
BF | 0.71 mm | 60 | A5 | |||
B | HC | – | 1797 | 300 | B1 | |
BF | 0.18 mm | 300 | B2 | |||
BF | 0.36 mm | 300 | B3 | |||
BF | 0.53 mm | 300 | B4 | |||
BF | 0.71 mm | 300 | B5 | |||
C | HC | – | 1,5 | 1797 | 200 | C1 |
BF | 0.18 mm | 200 | C2 | |||
BF | 0.36 mm | 200 | C3 | |||
BF | 0.53 mm | 200 | C4 | |||
BF | 0.71 mm | 200 | C5 | |||
D | HC | – | 1797 | 300 | D1 | |
BF | 0.18 mm | 300 | D2 | |||
IRF | 0.18 mm | 300 | D3 | |||
ORF | 0.18 mm | 300 | D4 |
3. Proposed approaches
This section provides information about some of the useful techniques that are subjected to fault classification performance in the experiments throughout this research.
3.1. Wavelet packet analysis
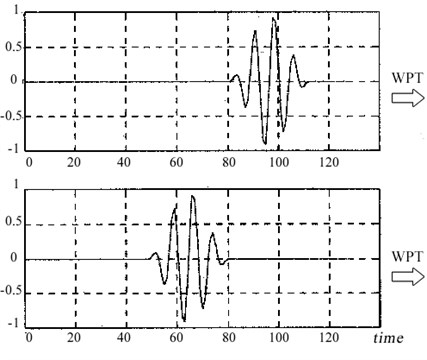
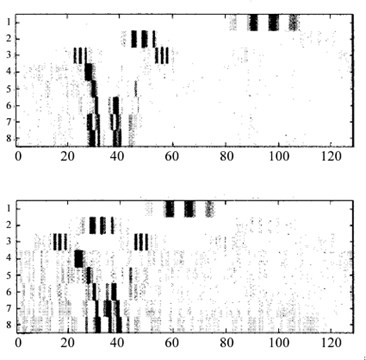
One of the common approach to extract features of vibration signals, a Short Time Fourier Transform based method, wavelet packet analysis is introduced in the literature. Wavelet packaging divides the Fourier spectrum of the signal into desired number of frequency bands which leads to different frequency resolution. Referring to the number of levels, while where represents the number of components in Wavelet Packet Transform (WPT). Then, filtering is carried out on the signal to obtain low and high frequency components which is followed by down sampling to achieve next level. Referring to Fig. 1, due to being not time-invariant [9], energy calculation of each wavelet packet is performed to rise its immunity to detection of the transients in non-stationary signal processing and Wavelet Packet Energy (WPE) features are achieved (Fig. 2).
In this study, using wavelet packet energy, three level and five level WPE vectors are created and used to train the classifiers.
Fig. 1a) Transient signals shifted in time-domain, b) resultant eight level quantized WPT
a)
b)
Fig. 2Resultant eight level quantized WPE for the signals in Fig. 1
3.2. Time domain features (TDFs)
Faulty signals show similar characteristics not only in Fourier domain but also in time domain. To identify representative patterns, statistical time-domain feature extraction methods are also used in contemporary studies in bearing fault diagnosis [6, 7].
For this purpose, statistical TDFs; energy, mean, standard deviation, maximum, minimum, kurtosis, skewness and crest factor are calculated from each sample as preferred in research [4] and 1×8 sized feature TDFs are prepared for training and testing process in the classification.
3.3. Multipoint optimal minimum entropy deconvolution adjusted (MOMEDA)
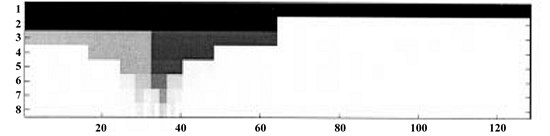
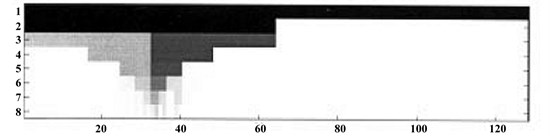
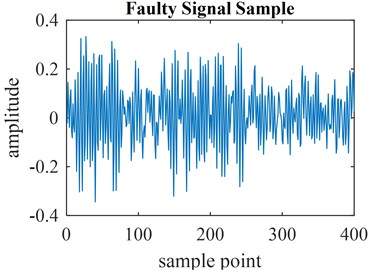
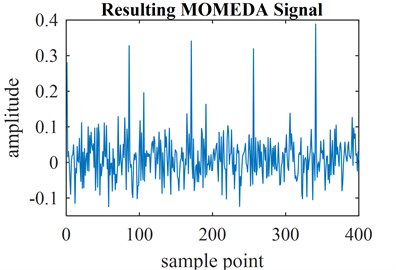
This method is a further improvement of an iterative algorithm, Minimum Entropy Deconvolution (MED) [10] that is used in fault identification of bearings and gearboxes. MED is capable of deconvolving a single impulse but not an impulse train. Since iterative methods are time consuming, a non-iterative optimal solution for the deconvolution filter, optimal MED (OMED) is presented [11]. The problem with OMED is discontinuity due to zero input signal assumption. Overcoming this issue is possible via using an adaptive recursive (AR) filtering which leads to OMEDA. Nevertheless, it is still inefficient to identify periodic impulses of an input signal related to rotating machinery. For this purpose, a cutting-edge MOMEDA method is presented in the literature that provides deconvolution of infinite number of impulses [12]. MOMEDA is able to solve this problem with optimized computation and resulting MOMEDA spectrum is essential to identify the faulty frequencies which leads to spectral feature extraction in the area of rotating machinery. This method requires using at least five periods (5) of signals in order to work in its highest efficiency.
In the process of MOMEDA feature extraction, pre-calculated model based faulty frequencies for different mechanical parts are turned into operating frequencies regarding of the rotational speed of the motor are used (Table 2). In the experiments, window size is chosen as 100 for -1,5 period analyses and 500 for 5 analysis. An example faulty signal feature extraction of ball bearings for the purpose of this research using MOMEDA is shown in Fig. 3.
Table 2Defect frequencies of bearing type 6205-2RS JEM at drive end
6205-2RS JEM | Inner ring | Outer ring | Cage train | Rolling element |
Defect Freq. (Hz) | 5,4125 | 3,5848 | 0,3983 | 4,7135 |
Operating Freq. (Hz) | 162,01 | 107,31 | 11,922 | 141,10 |
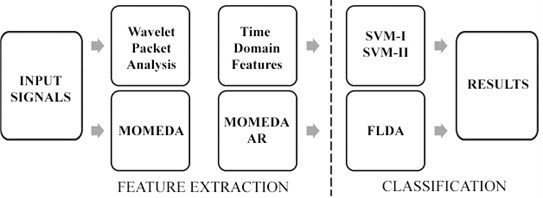
Final implementation of proposed method that is illustrated by Fig. 4 includes autoregressive (AR) filtering [13] with a window size of 50 for pre-whitening the signal before MOMEDA method is applied to increase its efficiency by means of fault detection of 5 segmented signals.
Fig. 3a) Faulty signal of ball bearings and b) resulting MOMEDA signal
a)
b)
Fig. 4Proposed fault severity and early fault classification scheme of ball bearings of rotating machinery
4. Experimental results
In the analyses, two main objectives are considered. Firstly, severity classification of the rotating elements of bearing faults are investigated including early faults, depending on the period of the rotation of the motor by using Dataset A, B and C. Secondly, a multi-fault diagnosis of early faults of rotating elements is performed on Dataset D using one-period analysis to show its efficiency. Feature extraction includes two different levels of wavelet packet energy (WPE_3, WPE_5), time-domain features (TDF), MOMEDA spectrum (MOMEDA SPEC), MOMEDA with (MOMEDA AR) and without (MOMEDA) AR filtering. Two state of art classifiers; Support Vector Machine with linear (SVM-I) and second order (SVM-II) kernel in addition to Fisher Linear Discriminant Analysis (FLDA) are employed and evaluation process is performed using five (Dataset C) and six (Dataset A, B, D) fold cross-validation which is shown in Table 3 (* represents, using that classifier is either not applicable or dataset is already classified with 100 % success rate with less computational effort). In addition, another experiment is carried out to achieve best results. In the testing process of Dataset A, each sample is tested against remaining ones and average classification accuracy is calculated as seen in Table 4.
Proposed methodology to obtain best results in early diagnosis; Dataset A(1,2), B(1,2), C(1,2) and multi-class classification; A(1-5), B(1-5), C(1-5), D(1-4) is illustrated in Fig. 4.
Table 3Classification performance for segmented datasets A, B, C and D
Average classification accuracy (%) | |||||||||||
MOMEDA | MOMEDA SPEC | WPE_3 | WPE_5 | TDF | Labels | ||||||
FLDA | 100 | 94,3 | 94,2 | 57,0 | 100 | 93,0 | 100 | 96,3 | 100 | 96,0 | A(1,2)/A(1-5) |
100 | 84,5 | 97,5 | 76,0 | 100 | 90,0 | 100 | 91,8 | 100 | 75,0 | B(1,2)/B(1-5) | |
100 | 81,2 | 98,4 | 68,2 | 100 | 91,0 | 100 | 94,4 | 100 | 80,6 | C(1,2)/C(1-5) | |
* | 100 | * | 99,7 | * | 99,8 | * | 99,8 | * | 96,8 | D(1,2)/D(1-4) | |
SVM-I | 100 | 98 | 95 | 64,0 | 100 | 93,0 | 100 | 99,3 | 100 | 95,0 | A(1,2)/A(1-5) |
100 | * | 99,3 | * | 100 | 95,0 | 100 | 97,3 | 100 | 75,3 | B(1,2)/B(1-5) | |
100 | 94,0 | 99,8 | 82,4 | 100 | 97,2 | 100 | 98,0 | 100 | 77,8 | C(1,2)/C(1-5) | |
* | * | * | * | * | * | * | * | * | * | D(1,2)/D(1-4) | |
SVM-II | * | 98,7 | * | 75,0 | * | 96,7 | * | 98,7 | * | 97,3 | A(1,2)/A(1-5) |
100 | * | 99,7 | * | 100 | * | 100 | * | 100 | * | B(1,2)/B(1-5) | |
100 | 94,0 | 99,8 | 87,0 | 100 | 96,2 | 100 | 95,0 | 100 | 94,0 | C(1,2)/C(1-5) | |
* | * | * | * | * | * | * | * | * | * | D(1,2)/D(1-4) | |
Table 4Classification performance for severity classification for Dataset A; one against all
Average classification accuracy (%) | ||||||
MOMEDA AR | MOMEDA | WPE_3 | WPE_5 | TDF | Labels | |
FLDA | 98,3 | 96,3 | 93,0 | 97,7 | 96,3 | A(1-5) |
SVM-I | 99,3 | 98,3 | 99,0 | 99,0 | 94,7 | A(1-5) |
SVM-II | 99,7 | 99,3 | 98,0 | 99,0 | 97,0 | A(1-5) |
5. Conclusions
In this study, condition monitoring of rotating machinery is examined upon sub-segmentation of healthy and faulty signals in the database retrieved from CWRU. According to the results, early fault detection including multi faults by the use of MOMEDA features, reaches a highest possible accuracy of 100 % even in one-period analysis. However, in five level severity classification, one-period analysis is not sufficient and maximum of 97,3 % classification success is observed. Another investigation is carried out by using 1,5 analysis and detection success is increased to 98 % on the same dataset with linear SVM kernel. Finally, by utilizing one test sample against all training samples using SVM-II, maximum average accuracy of 99,7 % is reached in bearing fault severity detection, which may be nominated as the most challenging among all RPM levels and fault types according to Table. 6 in the recent study [14]. Proposed methodology for severity classification of ball bearings outperforms the state-of-art techniques specialized for bearing fault diagnosis by means of classification performance and simplicity.
References
-
Smith W. A., Randall R. B. Rolling element bearing diagnostics using the Case Western Reserve University data: a benchmark study. Mechanical Systems and Signal Processing, Vol. 64, Issue 65, 2015, p. 100-131.
-
Žvokelj M., Zupan S., Prebil I. EEMD-based multiscale ICA method for slewing bearing fault detection and diagnosis. Journal of Sound and Vibration, Vol. 370, 2016, p. 394-423.
-
Yan R., Gao R. X., Chen X. Wavelets for fault diagnosis of rotary machines: a review with applications. Signal Processing, Vol. 96, 2014, p. 1-15.
-
Yu X., Ding E., Chen C., Liu X., Li L. A novel characteristic frequency bands extraction method for automatic bearing fault diagnosis based on Hilbert Huang transform. Sensors, Vol. 15, Issue 11, 2015, p. 27869-27893.
-
Antoni J. Fast computation of the kurtogram for the detection of transient faults. Mechanical Systems and Signal Processing, Vol. 21, Issue 1, 2007, p. 108-124.
-
Fu S., Liu K., Xu Y., Liu Y. Rolling bearing diagnosing method based on time domain analysis and adaptive fuzzy C-means clustering. Shock and Vibration, 2016, p. 1-8.
-
Wang M., Hu N.-Q., Hu L., Gao M. Feature optimization for bearing fault diagnosis. International Conference on Quality, Reliability, Risk, Maintenance, and Safety Engineering, 2013, p. 1738-1741.
-
Lou X., Loparo K. A. Bearing fault diagnosis based on wavelet transform and fuzzy inference. Mechanical Systems and Signal Processing, Vol. 18, Issue 5, 2004, p. 1077-1095.
-
Yen G. G., Lin K.-C. Wavelet packet feature extraction for vibration monitoring. IEEE Transactions on Industrial Electronics, Vol. 47, Issue 3, 2000, p. 650-667.
-
Wiggins R. A. Minimum entropy deconvolution. Geoexploration, Vol. 16, Issues 1-2, 1978, p. 21-35.
-
Cabrelli C. A. Minimum entropy deconvolution and simplicity: a noniterative algorithm. Geophysics, Vol. 50, Issue 3, 1985, p. 394-413.
-
Mcdonald G. L., Zhao Q. Multipoint optimal minimum entropy deconvolution and convolution fix: application to vibration fault detection. Mechanical Systems and Signal Processing, 2016.
-
Leite V. C. M. N., Borges da Silva J. G., Veloso G. F. C., Borges da Silva L. E., Lambert-Torres G., Bonaldi E. L., de L. de Oliveira L. E. Detection of localized bearing faults in induction machines by spectral kurtosis and envelope analysis of stator current. IEEE Transactions on Industrial Electronics, Vol. 62, Issue 3, 2015, p. 1855-1865.
-
Zhang X., Liang Y., Zhou J., Zang Y. A novel bearing fault diagnosis model integrated permutation entropy, ensemble empirical mode decomposition and optimized SVM. Measurement, Vol. 69, 2015, p. 164-179.
About this article

