Abstract
Vibration signals from rotating machines are usually nonlinear and nonstationary. Time frequency techniques are suitable for analyzing this type of signals. Wavelet analysis is one of the most powerful methods in this regards. Therefore, wavelet analysis is used extensively for diagnosis of nonlinear and nonstationary signals. Faults in rotating machines show their effects in certain frequency bands. In this research the features extracted from reconstructed signals from wavelet packets were compared to features extracted from wavelet packet coefficients. It is shown that reconstructed signals act better for fault diagnosis than wavelet packet coefficients. To support our claim one example is designed that justifies our hypothesis. To evaluate our hypothesis in real world practical situations, health condition monitoring of a motorcycle gearbox has been considered. In this practical situation wavelet coefficients and reconstructed signals from wavelet packet coefficients extracted from signals acquired from gearbox housing were compared. Mahalanobis distance (MD) is employed to evaluate the significance of the extracted features. It is shown that features extracted from reconstructed signals are more suitable than features extracted from wavelet packet coefficients.
1. Introduction
Creating a mathematical model for fault diagnosis of rotating machines is a hard task. Therefore, vibration signal analysis from these machines for fault diagnosis is common. In rotating machineries due to nonstationarity nature of vibration signal and low energy signals from faults and presence of strong noise, time-frequency techniques are ideal for analysis [1]. Wavelet analysis is a time-frequency technique and widely applied to fault diagnosis of rotating machinery.
In many researches wavelet packet coefficients have been used for feature extraction. The most used feature for fault diagnosis is energy of the wavelet coefficients as a feature vector for classification.
Purushotham et al. studied multi-fault diagnosis of rolling bearing by extracting the impulses corresponding to bearing defects from discrete wavelet coefficients at Mel-frequency scales [2]. Saravanan et al. classified various conditions and faults of spur bevel gearbox by using discrete wavelet coefficients for feature extraction and a decision tree for classification [3]. Yu et al. [4] clustered the discrete wavelet coefficients based on entropy. They extracted features from energy content of the clusters and used probabilistic neural network for bearing fault diagnosis. Sanz et al. analyzed discrete wavelet coefficients of vibration signals and then used a multi-layer perceptron neural network for gear dynamic monitoring [5].
Nikolaou et al. used mean and standard deviation of wavelet packet coefficients to identify the nature of rolling element bearing faults [6]. Rafiee et al. used standard deviation (SD) of wavelet packet coefficients for gearbox condition monitoring [7]. Boskoski et al. extracted Renyi entropy derived from coefficients of the wavelet packet transform (WPT) of vibration signals to detect faults in rotational drives [8].
Li et al. diagnosed faults in rolling bearings, by using kurtosis values extracted from reconstructed signals from wavelet coefficients of both WPT and discrete wavelet transform (DWT) [9]. Pan et al. [10] used lifting wavelet packet decomposition and fuzzy c-means for bearing performance degradation assessment. They used energy of reconstructed signals from wavelet packet nodes as feature vector. Bin et al. [1] presented a novel method for rotating machines fault diagnosis. In this method, features were extracted by empirical mode decomposition from signals reconstructed from wavelet packets.
In this research the superiority of reconstructed signal from wavelet packet node over wavelet packet coefficients for feature extraction has been demonstrated by one example. This fact is supported by the data acquisition from a real test rig of Yamaha motorcycle gearbox to classify four different health condition of the gearbox.
1.1. Wavelet packet analysis
Wavelet packet is a linear combination of usual wavelet functions, which inherits the attributes of its corresponding wavelet functions such as orthonormality and time-frequency localization [7]. is a wavelet packet function with three indices , , which are modulation or oscillation parameter, scale parameter and translation parameter, respectively, as follows [7]:
Wavelet function is derived from the following recursive equations:
Discrete filters and are quadrature mirror filters associated with scaling function and mother wavelet function [11]. Wavelet packet coefficients of signal are computed using Eq. (4):
Each wavelet packet can be reconstructed to make a part of the signal. Inverse wavelet transform is used to reconstruct signal. Usually, all the wavelet packets are used for signal reconstruction. But, in this research signal reconstruction is done for each wavelet packet independently. Therefore is the reconstructed signal from wavelet packet () based on Eq. (5):
The original signal can be obtained by summing reconstructed signals from packets of th level decomposition as follows:
Frequency band in each packet at th level decomposition is as follows:
in which is sampling frequency.
Down-sampling is done to avoid generating redundant data after each decomposition, as shown in Fig. 1 by 2.
Fig. 1Wavelet packet decomposition
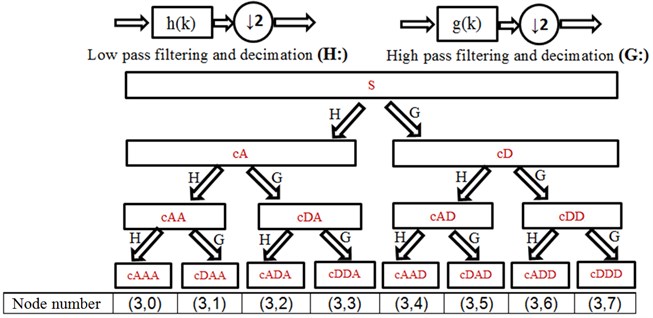
Sorting function changes Paley order () to frequency order () by the following recursive equations [12]:
Starting frequency of each packet is .
1.2. Mother wavelet selection for wavelet packet decomposition
One advantage of wavelet transform is diversity of mother wavelet. Selection of proper wavelet is very important because it can affect the analysis results [13]. In this research, maximum energy to Shannon entropy criterion was used for mother wavelet selection. This criterion states that the mother wavelet that has produced the maximum energy to Shannon entropy ratio should be chosen as the most appropriate wavelet. Energy of signal is defined as follows:
In the above equations, is energy of th wavelet packet node at th level of the signal. is sum of all energy packets in th level which is equal to the energy of original signal. Shannon entropy () is defined as follows:
where is energy probability distribution of wavelet coefficients [14].
Based on maximum energy to Shannon entropy criterion, mother wavelet is selected and this criterion is computed by Eq. (13):
Since discrete wavelet packet has been used in this research, mother wavelets like Gaussian, Mexican hat, Meyer and other complex wavelets could not be used. In this research, 75 mother wavelets were considered, as shown in Table 1.
Table 1Mother wavelet functions used in this research
Number | Family | Order |
1 | Haar (db1) | db1 |
2-45 | Daubechies(db) | db45-db2 |
46-69 | Symlets (sym) | Sym25-sym 2 |
70-74 | Coiflets (coif) | coif 1–coif 5 |
75 | Discrete Meyer (dmey) | Dmey |
2. Mahalanobis distance(MD)
In this research, Mahalanobis Distance (MD) of the corresponding features was determined to evaluate the distinguishability’s of the features between different fault states. MD measures distance between two groups of samples.
Assuming two groups with mean vectors and MD is defined as follows [16]:
where is pooled variance-covariance matrix, and is calculated according to:
where is the number of samples of group and is covariance matrix of th group.
Greater Mahalanobis distance represents better separation of two different groups by their feature vectors [16]; thus, this method can be used to select the features [16, 17].
3. Comparison of reconstructed signal and wavelet packet coefficients
3.1. Example
In this section reconstructed signal and wavelet packet coefficients are compared by one example.
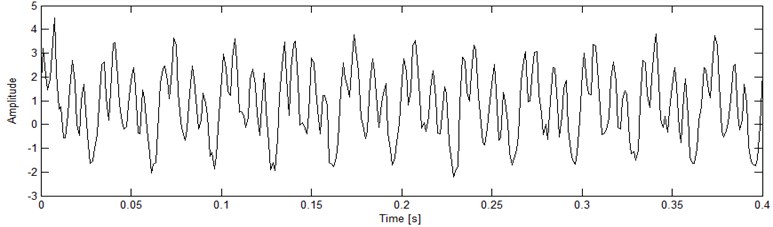
Vibration signal of a rotating machine with a specific fault was simulated based on Eqs. (16), (17). This signal has four components , , , . In each simulation white Gaussian noise with signal to noise ratio 5 was added to signal:
In Eq. (17) , , , are 1 (30 Hz), 2, 4, 6 harmonics from signal, respectively. Amplitude variation in the fault frequency is considered based on function. Values of based on fault severity were considered as 0, 0.12, 0.24, 0.36. For each of these four fault severity, 30 signals in time span of [0 0.4] sec with sampling frequency 800 Hz was simulated. Fig. 2 shows a sample of the simulated signal.
Fig. 2Sample of simulated signal with gt= 0
Discrete Meyer (dmey) mother wavelet was selected based on maximum energy to Shannon entropy criterion. Signals were decomposed to level 4. Frequency band width of each packet is 25 Hz based on Eq. (7). (4, 3) Packet node has frequency bandwidth of [50 75] Hz based on Eqs. (7), (8) therefore this node is related to the fault. In order to compare energy feature of wavelet packet coefficients and reconstructed signal of (4, 3) Packet node, they were normalized between 0 and 1. As is shown in Figs. 3 and 4 normalized energy of reconstructed signal acts better than normalized energy of wavelet packet coefficients to classify simulated fault.
Fig. 3Normalized energy of coefficients in (4, 3) wavelet packet with dmey mother wavelet for four different fault severity
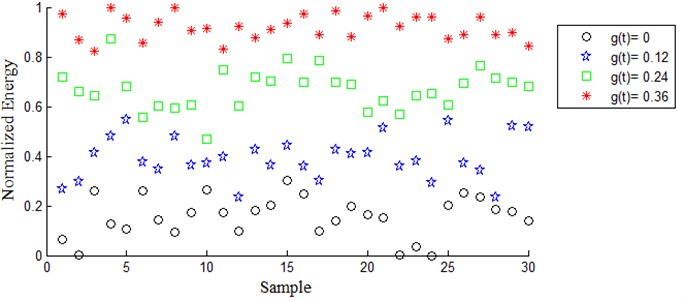
Table 2 shows Mahalanobis distances for four different conditions of the simulated signals. In all cases, Mahalanobis distance of two different conditions of features extracted based on normalized energy of reconstructed signal of (4, 3) Packet node, is greater than normalized energy of coefficients in (4, 3) wavelet packet. Therefore, compared with the normalized energy of coefficients in (4, 3), the normalized energy of reconstructed signal of (4, 3) Packet node have higher distinguishability.
Fig. 4Normalized energy of reconstructed signal from (4, 3) wavelet packet with dmey for four different fault severity
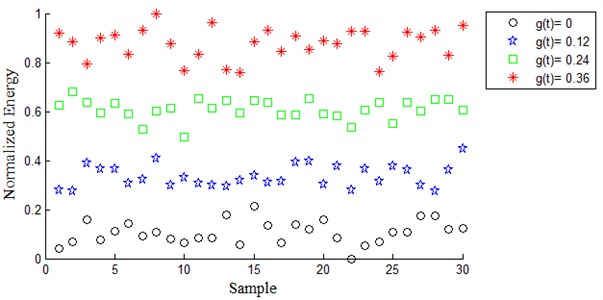
Table 2Mahalanobis distances for four different conditions of the simulated signals
Fault class | Features (Normalized energy of) | Fault class | |||
0 | 0.12 | 0.24 | 0.36 | ||
0 | Reconstructed signal of (4, 3) | 5.0323 | 11.4056 | 13.9504 | |
Coefficients in (4, 3) WP | 2.8595 | 6.3513 | 11.2818 | ||
0.12 | Reconstructed signal of (4,3) | 5.0323 | 6.3054 | 9.9112 | |
Coefficients in (4, 3) WP | 2.8595 | 3.3158 | 7.4886 | ||
0.24 | Reconstructed signal of (4,3) | 11.4056 | 6.3054 | 5.0576 | |
Coefficients in (4, 3) WP | 6.3513 | 3.3158 | 3.7363 | ||
0.36 | Reconstructed signal of (4,3) | 13.9504 | 9.9112 | 5.0576 | |
Coefficients in (4, 3) WP | 11.2818 | 3.7363 | |||
3.2. Real vibration data
In order to show effectiveness of feature extracted from reconstructed signals, a Yamaha motorcycle gearbox was used for experimental test.
The vibration data used in this research was kindly provided by the Vibration and Modal Analysis Laboratory, University of Tabriz, Tabriz, Iran.
Fig. 5Experiment setup [18]
![Experiment setup [18]](https://static-01.extrica.com/articles/16458/16458-img5.jpg)
Fig. 5 shows the experimental set up in this laboratory from which the vibration data were extracted [7, 18]. The input shaft of a motorcycle's four-speed gearbox that contained gearbox oil while collecting signals was rotated by an electric motor with the nominal speed of 1420 RPM. A load mechanism that was a friction wheel was positioned on its output shaft. The vibration signals were collected by the sampling frequency of 16384 Hz using an accelerometer sensor which was installed on the outer surface of the gearbox housing, near its input shaft. The real rotational speed of the motor was measured by a tachometer. There were four shock absorbers under the bases of the test-bed.
Data collection of the gearbox was implemented in four states: with faultless gear, slight-worn, medium-worn, and broken tooth gear. Fig. 6 shows a gear of the studied gearbox in two states of broken tooth fault and slight-worn.
Fig. 6a) Broken-tooth gear, b) Slight-worn gear [18]
![a) Broken-tooth gear, b) Slight-worn gear [18]](https://static-01.extrica.com/articles/16458/16458-img6.jpg)
a)
![a) Broken-tooth gear, b) Slight-worn gear [18]](https://static-01.extrica.com/articles/16458/16458-img7.jpg)
b)
Fig. 7 shows the schematic of the studied gearbox in the healthy state. The faults were created on the B4 gear at the 4th stage of the gearbox mating. In this stage, the A4 and B4 gears were mating.
The vibration data collected under all of the four gear conditions were divided into 90 pieces indicated by the pulses acquired by the tachometer, with each piece corresponding to one revolution of the input shaft.
Fig. 7Schematic of the studied gearbox [19]
![Schematic of the studied gearbox [19]](https://static-01.extrica.com/articles/16458/16458-img8.jpg)
First, the proper mother wavelet function was chosen by maximum energy to Shannon entropy criterion. Fig. 8 shows energy to Shannon entropy ratio for 75 different mother wavelet functions, given in Table 1. As shown in this figure, the 39th wavelet which was db39 had the maximum ratio of energy to Shannon entropy and thus was chosen as the best mother wavelet function.
In previous papers on fault diagnosis of gearbox by wavelet packet [7, 18, 20, 21], features were extracted from wavelet coefficients and none of them used feature extracted from reconstructed signals [7, 18, 20, 21]. In the aforementioned references standard deviation (SD) feature of different wavelet packets have been used for gearbox fault diagnosis. In this research SD feature vector of wavelet coefficients as well as SD feature vector of reconstructed signals from wavelet packets have been extracted.
Signals were decomposed with db39 mother wavelet to level 4 therefore 24 16 wavelet packets were produced. SD of coefficients of each wavelet packet were calculated separately to form SD feature vector with 16 dimension. To extract features from reconstructed signals, after decomposition of the main signal with db39 in level 4, a time waveform was reconstructed from each packet, then SD of each of these signals were computed separately and the 16 dimension feature vector were constructed. To compare feature of SD from reconstructed signal and feature obtained from SD of wavelet packet coefficient MD metric was used.
Fig. 8Comparison between energy to Shannon entropy ratio for 75 different mother wavelet functions from the faulty and healthy gearbox
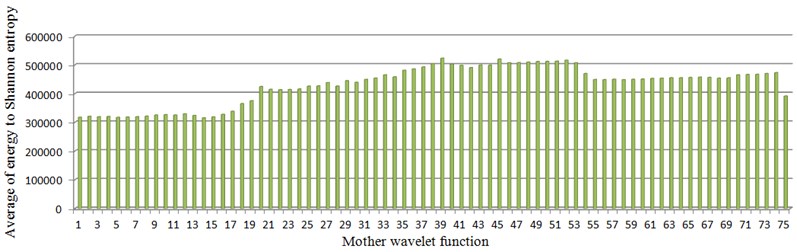
Table 3 shows Mahalanobis distances for four different distinguishing condition. From Table 3 it can be seen that always the SD feature vector obtained from reconstructed signal is better than that is obtained from wavelet packet coefficients.
It is clearly demonstrated in fault diagnosis of gearbox system, feature vector extracted from reconstructed signal outperforms feature vector extracted from wavelet packet coefficients.
Table 3Mahalanobis distances for four different conditions of the gearbox
Gear condition | Features (SD of) | Gear condition | |||
Normal | Slight-worn | Medium-worn | broken-tooth | ||
Normal | Reconstructed signal | 23.9653 | 24.4762 | 11.5093 | |
WP coefficients | 17.1057 | 18.7205 | 8.4991 | ||
Slight-worn | Reconstructed signal | 23.9653 | 14.3874 | 13.9191 | |
WP coefficients | 17.1057 | 10.2216 | 9.8931 | ||
Medium-worn | Reconstructed signal | 24.4762 | 14.3874 | 12.1106 | |
WP coefficients | 18.7205 | 10.2216 | 9.3749 | ||
Broken-tooth | Reconstructed signal | 11.5093 | 13.9191 | 12.1106 | |
WP coefficients | 8.4991 | 9.8931 | 9.3749 | ||
3.3. Discussion
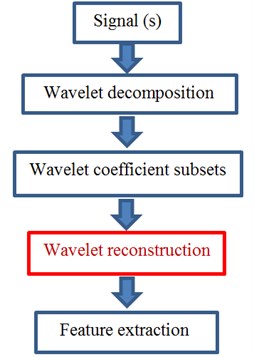
In this research features extracted from wavelet packet coefficients have been compared to features extracted from reconstructed signals from wavelet packet nodes for the first time. Most researches use features extracted from wavelet packet coefficients. In some researches features extracted from reconstructed signals from packet nodes alone have been used. In this research it has been shown that features extracted from reconstructed signals are more appropriate when signal being analysed is complex or has low SNR (Signal to Noise Ratio). We strongly recommend consideration of features extracted from reconstructed signals regarding feature extraction. As shown in flowchart in Fig. 9 it is recommended on machine condition monitoring, reconstructed signals from packet nodes would be used for feature extraction.
Fig. 9Feature extraction flow chart which recommends consideration of reconstructed signals
4. Conclusions
It has been shown feature extraction from reconstructed signals from packet nodes has better performance especially in signals with low SNR. It is strongly recommended for feature extraction; features extracted from reconstructed signals will be considered.
As a real a practical case study in extracting features for gearbox faults, it was shown that feature extracted from reconstructed signal outperforms features extracted from wavelet packets regarding fault diagnosis.
This research recommends feature extraction from signals reconstructed from wavelet packet nodes for fault diagnosis of rotating machineries.
References
-
Bin G. F., Gao J. J., Li X. J., Dhillon B. S. Early fault diagnosis of rotating machinery based on wavelet packets – empirical mode decomposition feature extraction and neural network. Mechanical Systems and Signal Processing, Vol. 27, 2012, p. 696-711.
-
Purushotham V., Narayanan S., Prasad S. A. N. Multi-fault diagnosis of rolling bearing elements using wavelet analysis and hidden Markov model based fault recognition. NDT&E International, Vol. 38, 2005, p. 654-664.
-
Saravanan N., Ramachandran K. I. Fault diagnosis of spur bevel gearbox using discrete wavelet features and decision tree classification. Expert Systems with Applications, Vol. 36, 2009, p. 9546-9573.
-
Yu G., Li C., Kamarthi S. Machine fault diagnosis using a cluster-based wavelet feature extraction and probabilistic neural networks. International Journal of Advanced Manufacturing Technology, Vol. 42, 2009, p. 145-151.
-
Sanz J., Perera R., Huerta C. Gear dynamics monitoring using discrete wavelet transformation and multi-layer perceptron neural networks. Applied Soft Computing, Vol. 12, 2012, p. 2867-2878.
-
Nikolaou N. G., Antoniadis I. A. Rolling element bearing fault diagnosis using wavelet packets. NDT&E International, Vol. 35, 2002, p. 197-205.
-
Rafiee J., Arvani F., Harifi A., Sadeghi M. H. Intelligent condition monitoring of a gearbox using artificial neural network. Mechanical Systems and Signal Processing, 2007, p. 1746-1754.
-
Boskoski P., Juricic D. Fault detection of mechanical drives under variable operating conditions based on wavelet packet Renyi entropy signatures. Mechanical Systems and Signal Processing, Vol. 31, 2012, p. 369-381.
-
Li F., Meng G., Ye L., Chen P. Wavelet transform-based higher-order statistics for fault diagnosis in rolling element bearings. Journal of Vibration and Control, Vol. 14, 2008, p. 1691-1709.
-
Pan Y., Chen J., Li X. Bearing performance degradation assessment based on lifting wavelet packet decomposition and fuzzy c-means. Mechanical Systems and Signal Processing, Vol. 24, 2010, p. 559-566.
-
Yen G. G., Lin K. Wavelet packet feature extraction for vibration monitoring. IEEE Transactions on Industrial Electronics, Vol. 47, 2000, p. 650-667.
-
Zou J., Chen J., Geng Z. M. Application of wavelet packets algorithm to diesel engines vibroacoustic signature extraction. Proceedings of the Institution of Mechanical Engineers, Part D: Journal of Automobile Engineering, Vol. 215, 2001, p. 987-993.
-
Gao R. X., Yan R. Wavelets: Theory and Applications for Manufacturing. Springer, New York, Dordrecht, Heidelberg, London, 2011.
-
Yan R. Base Wavelet Selection Criteria for Non-Stationary Vibration Analysis in Bearing Health Diagnosis. Ph.D. Thesis, University of Massachusetts Amherst, 2007.
-
Crossman J. A., Guo H., Murphey Y. L., Cardillo J. Automotive signal fault diagnostics. Part 1: signal fault analysis, signal segmentation, feature extraction and quasi-optimal feature selection. IEEE Transactions on Vehicular Technology, Vol. 52, 2003, p. 1063-1075.
-
Wu S. D., Wu C. W., Lin S. G., Wang C. C., Lee K. Y. Time series analysis using composite multiscale. Entropy, Vol. 15, 2013, p. 1069-1084.
-
Wu S. D., Wu C. W., Wu T. Y., Wang C. C. Multi-scale analysis based ball bearing defect diagnostics using Mahalanobis distance and support vector machine. Entropy, Vol. 15, 2013, p. 416-433.
-
Rafiee J., Tse P. W., Harifi A., Sadeghi M. H. A novel technique for selecting mother wavelet function using an intelligent fault diagnosis system. Expert Systems with Applications, Vol. 36, 2009, p. 4862-4875.
-
Rafiee J., Tse P. W. Use of autocorrelation of wavelet coefficients for fault diagnosis. Mechanical Systems and Signal Processing, Vol. 23, 2009, p. 1554-1572.
-
Liu L. S., Yang Y. H., Li Z. Y., Yu W. Condition monitoring for helicopter main gearbox based on wavelet packet transform and wavelet neural network. International Conference on Quality, Reliability, Risk, Maintenance, and Safety Engineering, Xi’an, China, 2011, p. 454-458.
-
Long Z., Xiong G., Liu L., Cao Q. Gearbox health condition identification by neuro-fuzzy ensemble. Journal of Mechanical Science and Technology, Vol. 27, 2013, p. 603-608.
About this article

The authors would like to sincerely thank Dr. Keyvan Rafiee from Rensselaer Polytechnic Institute, USA, who made the laboratory data available to the authors of this article.
