Abstract
The flow field and sound field of trapezoidal rudder-wing under different rudder angles are numerically predicted by CFD LES theory, Lighthill acoustic analogy theory and vibro-acoustic theory. And characteristics of hydrodynamic noise including flow noise and vibroacoustics under hydrodynamic excitations are analyzed. Results show that: at the same speed, the hydrodynamic noise raises with the increase of rudder angle; sound pressure level spectrum band of flow noise is wide and there is no obvious dominant frequency while there is a very obvious peak value of vibroacoustics under hydrodynamic excitations corresponding to the first order modal frequency in the band of 520-530 Hz; sound intensity at the front of leading edge and after trailing edge is higher than that at both sides of rudder-wing; the vibration of trailing edge is large, so it is the concentrated area of noise source.
1. Introduction
There are many kinds of noise sources for ships, which can be divided into mechanical noise, propeller noise and hydrodynamic noise. In recent years, with the application of low-noise equipment and vibration-reducing-and-isolating technology to ships, mechanical noise of ships has been more effectively controlled; propeller noise is dominant in ships at medium and high speed, while by using the new type of propulsion, propeller noise could also have been effectively controlled; and then hydrodynamic noise becomes main noise source when ship is sailing. Hydrodynamic noise is divided into flow noise and vibroacoustics under hydrodynamic excitations. The protruding parts on the ships’ streamlined structure such as rudder-wing, will fracture flow field and pressure field. The changing of rudder angle is also a serious impact on turbulent flow pressure field, and hydrodynamic noise has become an important factor affecting ships’ acoustic stealth when sailing.
In 2006, the Australian Department of Defense in the open submarine report [1] pointed out that flow field of submarine viscous hydrodynamic noise performance is one of the three main objectives of the submarine design. With the development of ship vibration and noise reduction technology, it has been paid more and more attention by domestic and foreign scholars on improving acoustic stealth of ships. Jiang Wencheng [2] numerically simulated flow noise of drip-type submarine by boundary element method and traditional FW-H equations, and then pointed out the far-field results were similar while the near-field results by BEM was closer to experimental values. Fan Guodong [3] simulated the flow field and acoustic field distribution of two-dimension airfoil by using CFD and Lighthill acoustic analogy method under different working conditions, and showed that velocity and attack angle are important factors affecting noise level and the contribution to flow noise is bigger than that to vibroacoustics under hydrodynamic excitations. Huang Qiaogao [4] did experiment study on flow noise of underwater vehicles in high speed water tunnel, and the flow noise sound pressure spectrum characteristics of underwater vehicle scaled model with different head shapes and different velocities and different positions of test points were measured. Shang Dajing [5] proposed a new method to measure flow noise of underwater airfoil by reverberation chamber, and verified the radiation law of dipole. Yang Qiongfang [6] used LES and acoustic boundary element method to predict the spatial distribution of vorticity field and hydrodynamic noise of the SUBOFF submarine. Liu Zhansheng [7] predicted unsteady flow field and flow induced noise of a flexible NACA0018 airfoil using LES method and FW-H equations considering arbitrary boundary movement and the interaction between flexible body and fluid and obtained effects of the deformation of the flexible body at different attack angles on the flow and sound source characteristics and the radiation characteristics of the flow noise.
The included angle between rudder’s symmetry and stable wing’s symmetry is called rudder angle. This paper numerically simulates the flow field of the rudder-wing under rudder angle of 0°, 10°, 20°, 30° by CFD LES method, and analyses the vorticity characteristics, and then hydrodynamic noise characteristics of rudder-wing under each rudder angle is predicted and analyzed by Lighthill acoustic analogy theory and vibro-acoustic theory.
2. Flow field simulation theory and acoustic simulation theory
2.1. Flow field simulation theory
The flow field of ship rudder-wing is a complex viscous turbulent flow, and the turbulent pressure can be captured by large eddy simulation SGS model. LES uses the filter function to filter out small scale vortex in the fluid pulsation, only to calculate large scale vortex. The spatial filtering Navier-Stokes equation is:
where is velocity component after filtering. is stress tensor caused by fluid viscosity.
The Smagorinsky-Lilly model is used to simulate the subgrid stress:
where is the symbol of Kronecker; is strain tensor of scale vortex; is isotropic subgrid stress; is turbulent viscosity of subgrid scale eddy, is mesh size, is Smagorinsky constant, and here it is 0.1.
2.2. Acoustic simulation theory
The Lighthill equation is derived from N-S equation: the left of equation is wave equation of classical acoustics; the right of equation is wave term caused by all hydrodynamic forces, and it is also namely sound source term. The equation is described as follows:
where:
is Lighthill stress tensor; is velocity of sound; is the change of fluid density.
According to the literature [8], the free turbulent noise is dominated by quadrupole source. When there is a wall boundary, the dipole source will be generated, and it is the main source of the low Reynolds number. This paper mainly studies hydrodynamic noise of rudder at low speed (3 knots), so the dipole source is only taken into considering.
3. Simulation and analysis of flow noise of rudder with different rudder angle
The trapezoidal rudder-wing scaled model under 30° rudder angle is shown in Fig. 1(a), with the same-size computational domain as literature [9] (as shown in Fig. 1(b)). The whole computational domain is meshed by unstructured grids of about 9.6×10⁶ elements and 2×10⁶ nodes, and the element size in accordance with the proportion of 1.1 from rudder-wing wall to the peripheral expansion, and the prismatic layer mesh is arranged on the wall surface (as shown in Fig. 1(c)). The inlet of model is set as velocity-inlet at the speed of 1.5 m/s, and the outlet is set as pressure-outlet of 1 atm, and the rudder surface is set as no slip wall. When using LES to calculate the transient condition, the time step is set as 10-5 s to capture the turbulent fluctuation pressure, and the calculation results by SST turbulence model is used as initial condition to accelerate convergence of residual error.
Fig. 1Computational model of rudder-wing: a) geometry model; b) computational domain of flow field; c) mesh model
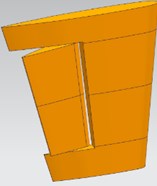
a)
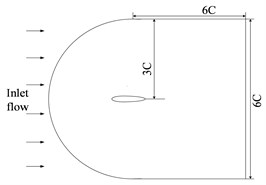
b)
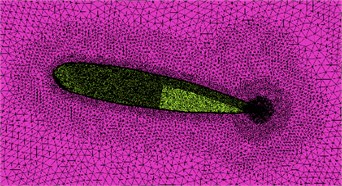
c)
After calculating the flow field of rudder-wing, the flow noise is calculated. Based on BEM, 2D mesh is taken to meshing rudder-wing model. As shown in Fig. 2, acoustic grid unit is about 4500, and acoustic mesh size is less than 1/12 wavelength of the maximum frequency for satisfying the requirement of accuracy.
When acoustic field prediction is performed by using Lighthill acoustic analogy theory, monopole and quadrupole sources are neglected due to the static wall and low velocity, and only considering dipole source.
Fig. 2Acoustic grid
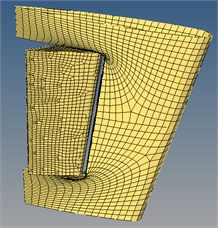
Fig. 3Position of monitor points
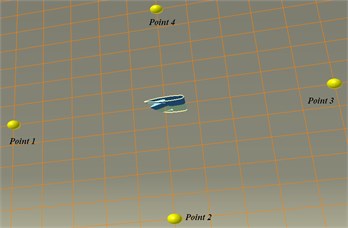
At the flow rate of 1.5 m/s, 4 monitor points were respectively set up in the 4 direction along axial of 0 plane distancing 1000 mm from the center of rudder-wing (as shown in Fig. 3). Then the flow noise of rudder-wing under rudder angle of 0°, 10°, 20°, 30° were calculated.
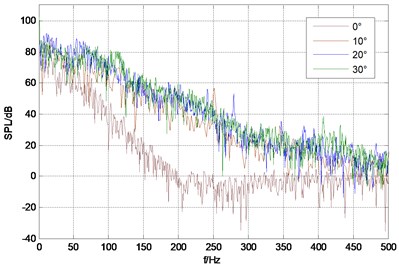
Fig. 4 shows sound pressure spectrum under different rudder angle of each monitoring point, from which can be seen that sound pressure level spectrum band of monitoring point is wide and there is no obvious dominant frequency; low frequency sound pressure level is higher and it continues to decline with the increasing of frequency. The total sound pressure level of monitor points are shown in Table 1. From the data in the table, it can be seen that at the same velocity the total sound pressure also raises with the increase of rudder angle, but the increase amplitude becomes decrease; while at the same angle, total sound pressure of monitor point 1 and point 3 is bigger than that of point 2 and point 4. Obviously sound radiation intensity of trailing edge and the front of stabilizing wing leading edge is relatively bigger, which is consistent with analysis results of vorticity.
Fig. 4Sound pressure spectrum of each monitor point under different rudder angles
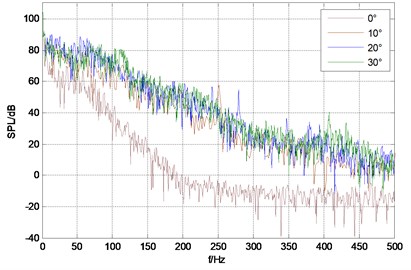
a) Monitor point 1
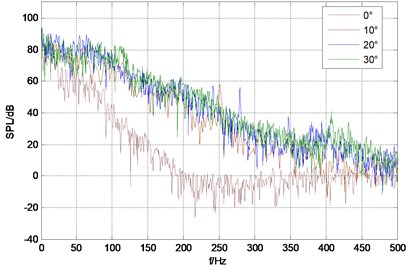
b) Monitor point 2
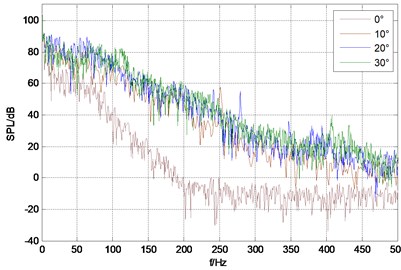
c) Monitor point 3
d) Monitor point 4
Table 1Total sound pressure level of monitor points under different rudder angles
Rudder angle | Point 1 | Point 2 | Point 3 | Point 4 | Mean value |
0° | 91.1 | 90.5 | 92.0 | 89.6 | 90.8 |
10° | 98.5 | 98.0 | 99.2 | 98.3 | 98.5 |
20° | 103.4 | 102.8 | 103.7 | 103.0 | 103.2 |
30° | 105.2 | 102.9 | 105.2 | 103.0 | 104.0 |
4. Calculation and analysis of vibroacoustics under hydrodynamic excitations characteristics of rudder with different rudder angles
Based on FEM, modal of rudder-wing is calculated and the result is mapped into the surface of model, and then the fluid excitation is also mapped to the surface. Finally, the vibroacoustics under hydrodynamic excitations is calculated based on modal superposition method.
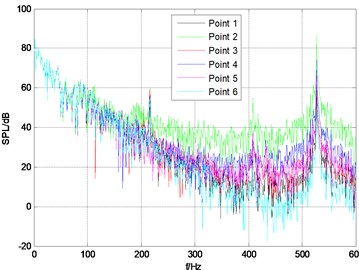
As shown in Figs. 5, 6 representative points are selected as monitor points: point 2 is the midpoint of rudder blade trailing edge; point 3 and 4 respectively are located on upper and lower rudder stock; point 1, 5 and 6 are on the leading edge of the stabilizing wing.
The upper plane of stable wing is set as a fixed displacement constraints. The vibro-acoustic coupling excited by turbulent pressure fluctuation of the rudder-wing model with the rudder angle of 10°, 20°, 30°is calculated, and the pressure frequency response curves are shown in Fig. 6. There is a very obvious peak value in the frequency band of 520 Hz-530 Hz under each rudder angle and the peak frequency corresponds to the first order modal frequency of the rudder-wing model.
Fig. 5Position of monitor points
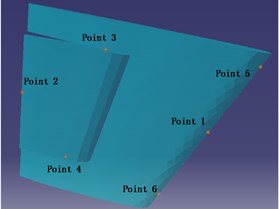
Fig. 6Sound pressure frequency response curves under different rudder angles
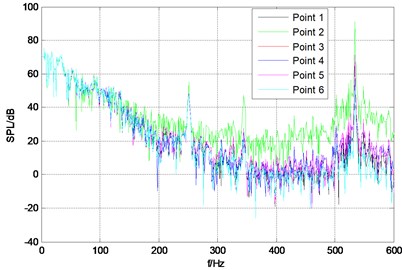
a) 10°
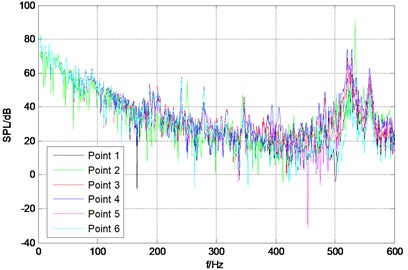
b) 20°
c) 30°
Total sound pressure level of each monitor point is shown in Table 2, and from the data in the table it can be seen that: total sound pressure of point 2 at the trailing edge is larger than that of other points, and there is no obvious difference between any other two; with the increase of rudder angle, the total sound pressure of each monitor point is also increased, but the sound pressure at point 2 is basically unchanged. It can be seen that the vibration at the trailing edge is large, and it is the concentrated area of the noise source.
Table 2Total sound pressure level at each monitor point
Rudder angle | Point 1 | Point 2 | Point 3 | Point 4 | Point 5 | Point 6 | Mean value |
10° | 85.31 | 92.23 | 85.35 | 85.43 | 85.45 | 85.28 | 86.51 |
20° | 90.53 | 92.25 | 90.64 | 90.90 | 90.58 | 90.52 | 90.90 |
30° | 91.14 | 92.78 | 91.15 | 91.25 | 91.15 | 91.13 | 91.43 |
5. Conclusion
In this paper, the characteristics of flow field and hydrodynamic noise of trapezoidal rudder-wing under different rudder angles are studied by large eddy simulation, Lighthill acoustic analogy equations and vibro-acoustic theory. The main conclusions are as follows:
1) Sound pressure level spectrum band of flow noise is wide and there is no obvious dominant frequency; low frequency sound pressure level is higher and it continues to decline with the increasing of frequency.
2) At the same velocity, both the flow noise and vibroacoustics under hydrodynamic excitations also raise with the increase of rudder angle.
3) For flow noise, sound radiation intensity of trailing edge and the front of stabilizing wing leading edge is relatively bigger, and this is also consistent with analysis results of vorticity, which shows that the eddy is the fundamental cause of flow noise.
4) For vibroacoustics under hydrodynamic excitations, there is a very obvious peak value corresponding to the first order modal frequency in the band of 520 Hz-530 Hz. The vibration of trailing edge is large, and it is the concentrated area of noise source.
References
-
Joubert P. N. Some Aspects of Submarine Design: Shape of a Submarine 2026. Defense Science and Technology Organization, Australia, 2006.
-
Wencheng J., Huaixin Z., Kunyu M. Research on the flow noise of underwater submarine based on boundary element method. Chinese Journal of Hydrodynamics, Issue 4, 2013, p. 453-459.
-
Guodong F., Yong C., Hongxing H. Study on the 2D hydrofoil vibration and noise induced by ingested turbulence. Noise and Vibration Control, Issue 4, 2015, p. 56-60.
-
Qiaogao H., Guang P. Flow tunnel experimental study on flow noise characteristics of underwater vehicles. Journal of Northwestern Polytechnical University, Issue 1, 2015, p. 141-146.
-
Dajing S., Qi L., Dejiang S., et al. Experimental investigation on flow-induced noise of the underwater hydrofoil structure. ACTA Acustica, Issue 4, 2012, p. 416-423.
-
Qiongfang Y., Yongsheng W., Mingmin Z. Numerical simulation of vorticity field and determination of equivalent acoustic source of flow noises for submarine. Journal of Huazhong University of Science and Technology (Natural Science Edition), Issue 5, 2012, p. 64-70.
-
Zhansheng L., Ruixian M., Fan Y., et al. Study on noise reduction mechanism of flow induced noise for flexible body based on fluid-structure interaction. Journal of Mechanical Engineering, Vol. 52, Issue 10, 2016, p. 176-184.
-
Chunxu W., Chongjian W., Lejia C., et al. A comprehensive review on the mechanism of flow-induced noise and related prediction methods. Chinese Journal of Ship Research, Issue 1, 2016, p. 57-71.
-
Shja Sani A., Roohi E., Kahrom M., et al. Investigation of aerodynamic characteristics of rarefied flow around NACA 0012 airfoil using DSMC and NS solvers. European Journal of Mechanics-B/Fluids, Vol. 48, 2014, p. 59-74.
Cited by
About this article

