Abstract
The article deals with an analysis of the mean value of the torque of the truck with 8×8 drive. Torque was measured using a noncontact device on the powertrain shaft. This shaft is used to drive the first front axle. For a better understanding of the experiment results, computational model of the truck was developed in Simulink software. To build the computational model, custom library was used and users could create different modifications of vehicles. Subsequently, analysis of torsional vibration was carried out. In the first study, the truck showed problems with directional vibrations and noise after reaching a certain speed, therefore, this article also continues with an analysis of the torsional vibration.
1. Introduction
Vibrations affect passengers not only in passenger cars but also in trucks. In the case of the truck, these are complex and unique powertrains that may exhibit different types of vibrations such as directional or torsional, to name but a few. The aim is to design a vehicle without vibrations that affect passengers [1, 2]. However, some vibrations will only occur during an uncommon operation.
This article deals with the analysis of the torque of the truck with 8×8 drive. This is a unique powertrain where torsional vibrations can occur. In the following study of the vibration formation on the truck powertrain [5], directional vibrations, driver comfort and deflection of the same shaft were analysed. Mean torque and torsional vibration will be also analysed.
In the first phase of torque study, its mean value was monitored. The tests were performed on special roads with a precisely defined grade. In this case, the experiment of a vehicle driving up the hill with a 6 % grade will be described. There were two tests with two different transmission gears. To verify the torque, the computational model of the vehicle was developed for uphill analysis and compared with the measured data. The computational model of the vehicle uses blocks describing individual parts of the powertrain. Computational model blocks are elements of a custom library [4] which was intended for various vehicle dynamics analyses and simulations.
In the second phase, the aim was to analyse the curve shape of the measured torque and to evaluate torsional vibrations. This analysis is a continuation of the study mentioned in [5]. This will determine the effect of the torsional vibrations on the overall vibrations generated by a vehicle. It should be noted that the previously observed vibrations do not occur in normal vehicle speed mode as set by limitation in the European Union.
2. Measurement
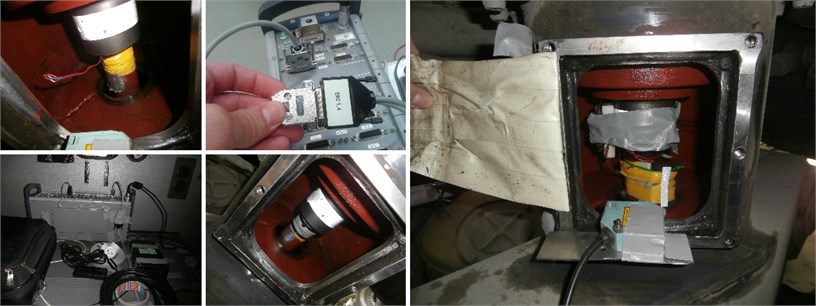
The measurement of the torque was carried out on the shaft driving of the first front axle. Because the vehicle has permanent drive of the rear axles, it was necessary to activate drive of the front axles. This divided the engine torque across the whole powertrain. For testing a special road was used with a precisely defined 6 % grade. The road surface was asphalt. A strain gauge was attached to the shaft which was connected to a non-contact data transfer device. A reflector for the shaft speed sensor was placed on the shaft. The engine speed was also recorded. The IMC measuring device was used and appropriate speed sensors were connected. An asynchronous torque measurement was performed using device for a contactless data transmission. Unfortunately, the device was lent from its developers so it is not possible to provide more detailed information here. The measurement was performed at a sampling rate of 5 kHz and both parallel measurements were synchronized only when data was processed. This was possible through the curve shape of variables. For the evaluation of the data, sections that correspond to the continuous driving with the gradual increase of the engine speed are used. This was in progress at a predetermined transmission gear without changing it during the measurement. Fig. 1 shows the individual devices and sensors used to measure the torque and the engine and shaft speed. The location of the non-contact data transfer device is shown in the figure on the right. First, the strain gauge was attached to the shaft and then the non-contact data transfer device was placed. The device also included memory media and power supplies. Saved data were already specific as strain values. From these values and using the basic equation from the mechanics, the torque was evaluated.
Fig. 1Sensors and the measuring position
The measured data was processed using the prepared scripts in the Matlab software which is shown in Fig. 3-4.
3. Computational model
To verify the measured data, a vehicle computational model was created. This model consists of blocks with computational models describing the individual parts of the powertrain.
Fig. 2Computational model of the truck with 8×8 drive
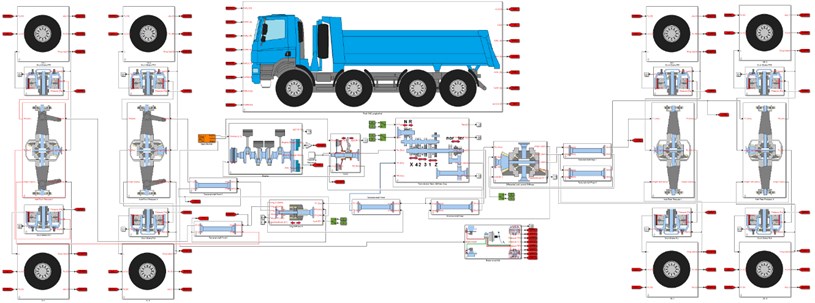
Blocks are used from a custom library created in Simulink software and described in [4]. The user of the library can use the blocks of computational models to simulate the behaviour of engines, clutches, transmissions, axles, differentials, brakes, tyres or vehicle dynamics, to name but a few. The user connects the respective blocks and can simulate the vehicles up to an 8×8 drive. The user can perform not only various vehicle dynamics simulations but can also analyse vibrations. This tool is also used to test the development of mechatronic systems. In this case, the computational model of the vehicle was simulated for driving on the graded road. It is shown in Fig. 2. Because the vehicle did not turn in the simulation, the blocks describing the vehicle only used the longitudinal dynamics. The computational model of powertrain is developed as a torsion system including an engine block, clutch and a transmission. Subsequently, parts of the axles with differential are connected. The axle blocks are terminated by drum brakes and computational models of the tyre. The main block is the vehicle model where the dynamics of the whole vehicle is solved. The basic parameters of the vehicle are weight of 36 000 kg, engine power of 325 kW at 1 800 rpm and engine torque of 2 100 Nm at 1 100 rpm.
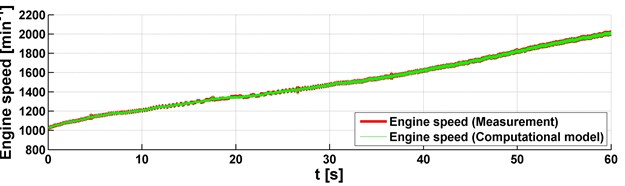
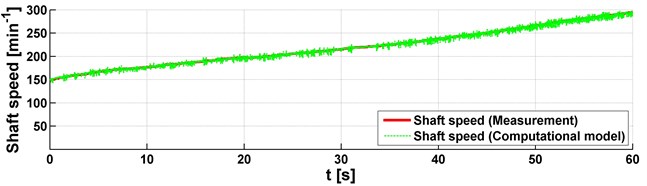
Fig. 3Measured data on the truck powertrain, a 6 % Grade, gear stage 1R
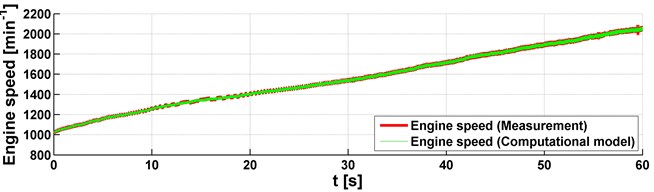
a) Engine speed
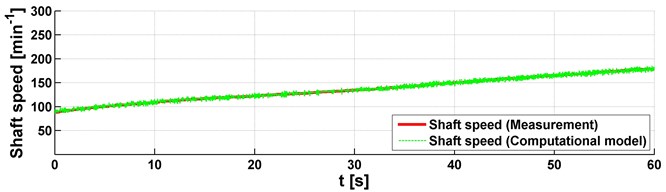
b) Shaft speed
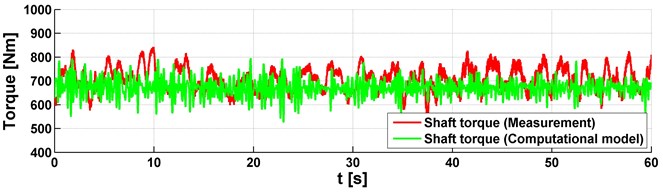
c) Shaft torque
These parameters, and many others, were added to the computational model and a simulation of the drive up the hill was performed. The drive simulation was in progress so that the measured data of the engine speed were used as an input for the computational model of the vehicle. These measured data were supplied to the clutch block with a time dependence and a similar vehicle simulation was performed as during the measurement. This eliminates the engine block which can also simulate the engine torque from creating individual combustion processes. Therefore, the harmonic components of the torque are missing in the output data of torque shape from the simulation. It means that the resultant data were compared only in terms of the mean value. This torque was simulated on the same shaft as on the real vehicle. The results are shown in Figs. 3-4 where they are compared with the measured data. Thus, two simulations were made for two different transmission gear 1R and 2R, this means that for the first and second reduced gears.
4. Torque analysis
Two approaches were used to analyse the torque. It means that the measurement and simulation were performed. In both cases, the vehicle was driven on a road with a 6 % grade. The measurement and simulation results are shown in Figs. 3-4 and they correspond to the utilization of two gears. Individual figures are shown on three graphs with engine speed, shaft speed and torque. Everything is displayed with dependence on time. As already mentioned, the vehicle speed was gradually increased in the operating range of the engine speed. This corresponds to the shaft speed. Also, the strain gauge for the torque analysis was included. These graphs compare data from measurement and simulation and it can be concluded that the data and their mean values are identical. It means that the used vehicle model was correctly assembled and no problems occurred during the measurement.
Fig. 4Measured data on the truck powertrain, a 6 % grade, gear stage 2R
a) Engine speed
b) Shaft speed
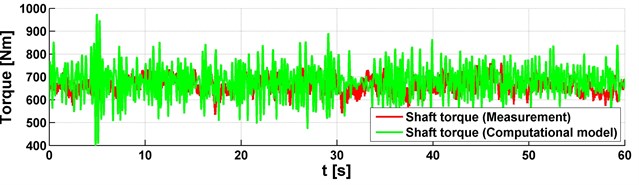
c) Shaft torque
By comparing the torques in Figs. 3-4, it can be assumed that the mean values of the torque are the same for different gears. This could be assumed because the torque, in the measuring position, is not influenced by the gear but by the driving resistances. In this case, the grade of the road has a significant effect on the torque value. To evaluate torsional vibrations from the simulation, it would be necessary to design a PID regulator to control the position of the accelerator pedal in the block of the engine. This was not the aim of this analysis, the aim was to compare the mean values of the torque. It showed that the computational model works well and can be used for other vehicle simulations and torque analysis.
5. Vibration analysis
Torsion vibration analysis was performed only based on the measured data. FFT analysis was used [3]. Therefore, a data processing script was prepared. Its function was that a set value of engine speed was found first and then it was processed by FFT analysis. The complete FFT spectrums were evaluated by successive processing after the specified engine speed step. These FFT spectrums are shown in Figs. 5-6. As mentioned above, they are for two different transmission gears. This influence of the different gears will already be noticeable in shifting the frequencies of harmonic orders of the axle, shaft and pneumatic speed.
Fig. 5Results of FFT analysis of the torque, a 6 % grade, gear stage 1R
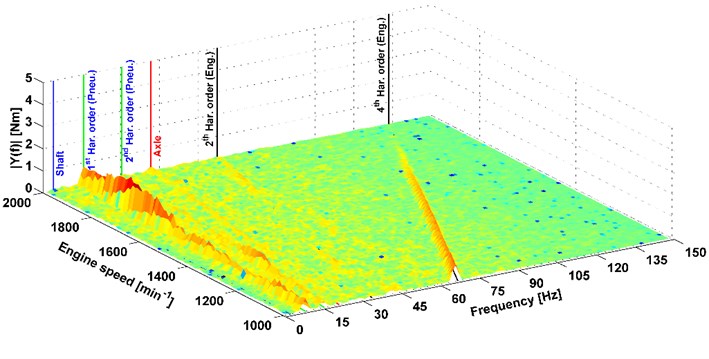
Fig. 6Results of FFT analysis of the torque, a 6 % grade, gear stage 2R
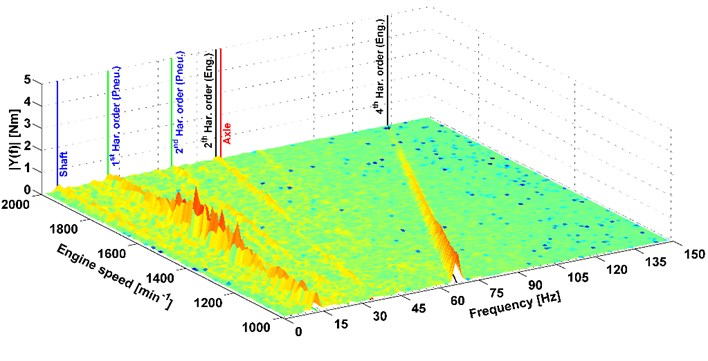
The vertical axis of the graph describes the amplitude from the FFT analysis. The transverse axis is the engine speed and the longitudinal axis is frequencies. The graphs present different peaks corresponding to some parts of the powertrain. This is the 4th harmonic order of the engine speed. There is a V8 engine in the vehicle, therefore, harmonic order could be assumed. Furthermore, the 1st and 2nd harmonic order of tyre speeds are shown in the graphs. It can be said that this is the analogy of the gearing frequency of some mechanical gear, because, the tyres had big shaped part of the tyre tread. These amplitudes were the most significant in terms of torsional vibrations. Further, there are peaks representing the gearing frequency of the axle which is not significant. In the graph in Fig. 6, its peak is merged with the 2nd harmonic order of engine speed.
An important frequency of the shaft speed was monitored because the drive shaft was deflected at the uncommon vehicle speeds and thus generated vibrations. This was solved and described in article [5]. The results of the torsional analysis on the graphs, show the peak of the harmonic order of the shaft speed as partially visible. But it can be assumed that it is negligible for the overall vibration of the vehicle. If road tyres were used on the vehicle, the amplitude representing the 1st and 2nd harmonic orders of the tyre speed would be significantly reduced. Therefore, the 4th harmonic order of engine speed would be the most important component of torsional vibrations.
6. Conclusions
The intensity of development is increasing and it needs to use sophisticated instruments to simulate the vehicle dynamics, vibration analysis or mechatronic system development, to name but a few.
This article dealt with the analysis of the powertrain torque and the vibrations caused by them on a truck with 8×8 drive. Measurements were performed on the vehicle drive on the road with 6 % grade. To obtain the measured data, non-contact devices were used and shaft and engine speeds were also recorded. To verify the measured data, the computational model of the vehicle was created and it simulated the same drive as on the test vehicle. Evaluation of two approaches determined that the mean value of the measured torque is comparable and the speeds overlap completely. Therefore, it can be concluded that the computational model works properly and can be used for further vehicle development and torque analysis.
The measured torque was analysed to evaluate the torsional vibrations. This corresponds to the article [5]. This article present continuation of the analyses of the torsional vibrations and their influence on the overall truck vibration. The results of the FFT spectrums of the torsional vibrations (Figs. 5-6) showed that the 1st harmonics order of the shaft speed is present but is negligible. Therefore, a connection of the torsional vibrations with deflection of the shaft is not confirmed. There are other peaks of harmonic order of speed in the FFT spectrums. It is 4th harmonic order of the engine speed. The most important part of the torsional vibration is the 1st and 2nd harmonic orders of tyre speed. It is caused by a distinctive repeating segments of tyre. These frequencies could be significantly reduced by using road tyres. This would be significant only if the frequency was corresponding to the 4th harmonic order of engine speed and the other peaks of the frequency were negligible for the overall effect on vehicle vibration.
The design of a PID regulator could be another procedure to control engine throttle and it could simulate the torque from the combustion process. The resultant FFT could be also compare with those measurements.
References
-
Gillespie T. D. Fundamentals of Vehicle Dynamics. Society of Automotive Engineers, Warrendale, 1992.
-
Budynas R. G. Shigley’s Mechanical Engineering Design. McGraw-Hill, New York, 2006.
-
Tůma J. Vehicle Gearbox Noise and Vibration. Wiley, Chichester, 2014.
-
Kučera P. Mechatronic Approach to Vehicle Dynamics. Doctoral Thesis, BUT Brno, 2015
-
Kučera P., Píštěk V. Truck vibrations caused by unbalanced rotating shaft. Vibroengineering Procedia, Vol. 7, 2016, p. 148-153.
About this article

This work is an output of the internal BUT research Project Reg. No. FSI-S-17-4104.
