Abstract
This study proposes a nonlinear dynamic model of the heavy trucks to evaluate the influence of the various working conditions on the ride comfort and road friendliness of the heavy vehicles based on Matlab/Simulink software. The weighted root mean square (RMS) acceleration responses of the vertical driver’s seat, the cab’s pitch and roll angles, and the dynamic load coefficient (DLC) are chosen as objective functions. The influence of the vehicle velocity and loads on the different road surfaces are evaluated based on the standard ISO 2631-1. The results show that the vehicle’s ride comfort is clearly affected on the road surfaces of ISO level C and D at the range of the vehicle velocity. Especially, the vehicle’s ride comfort is very poor at the velocity of 10-30 m.s-1 on ISO level D. The road friendliness of the vehicle is greatly decreased in the condition of the half-loaded vehicle. Particularly the vertical dynamic wheel loads at 2nd axle strongly affect the road damage at the velocity of 10-30 m.s-1.
Highlights
- Heavy trucks, ride comfort, road friendliness, DLC, weighted RMS acceleration responses.
- Vibration isolation system, heavy truck's vibration, vehicle dynamic model.
1. Introduction
The market of the heavy trucks was competing very fierce and the features of the heavy trucks were claimed higher. One of the most important requirements is to improve the ride comfort and road friendless. In order to solve these problems, the heavy truck dynamic parameters were analyzed and optimized. The influence of the heavy truck dynamic parameters on the ride comfort was analyzed via 3D vehicle dynamic model, and the suspension system parameters of the cab and the vehicle of the heavy trucks were then designed and optimized through a half-vehicle model [1-3], the objective functions were to improve the driver’s seat comfort and controlling the cab’s pitch angle.
In recent years, the traditional suspension systems almost were studied and replaced by using air suspension system, active or semi-active suspension systems with its capabilities of consuming less power, low cost and providing better ride quality. A half-vehicle model with hybrid balance control of a heavy truck suspension system was studied [4], and the PID-fuzzy control and wheelbase preview were combined to control the semi-active air suspension of the half-heavy truck model [5]. The heavy truck’s ride comfort also was the goal of researches.
The performance of the heavy trucks is also evaluated via the road friendliness apart from the ride comfort. The effect of dynamic load coefficients (DLC) of type suspension systems from truck axles on the road friendliness and the design of the suspension systems to minimize road damage were studied [6, 7]. An optimal design of “road-friendly” the vehicle suspension system was also done based on the rough pavement surfaces [8], a 3D heavy truck model with air suspension systems was optimized by semi-active fuzzy control [9]. However, all the above researches almost focus to study the vehicle dynamic parameters and optimize the structure of type suspension systems to improve the ride comfort as well as the road friendliness. Influence of the various working conditions of the heavy trucks received only a little attention.
This study proposes a 3D dynamic model of a typical heavy truck, the weighted RMS acceleration responses of the driver’s seat, cab’s pitch and roll angles, and the DLC’s value are chosen as the objective function. Matlab/Simulink software is used to simulate and calculate the objections. This major goal is to evaluate the influence of the ride comfort and road friendliness of heavy truck under the various working conditions.
2. Materials and methods
2.1. Heavy truck dynamic model
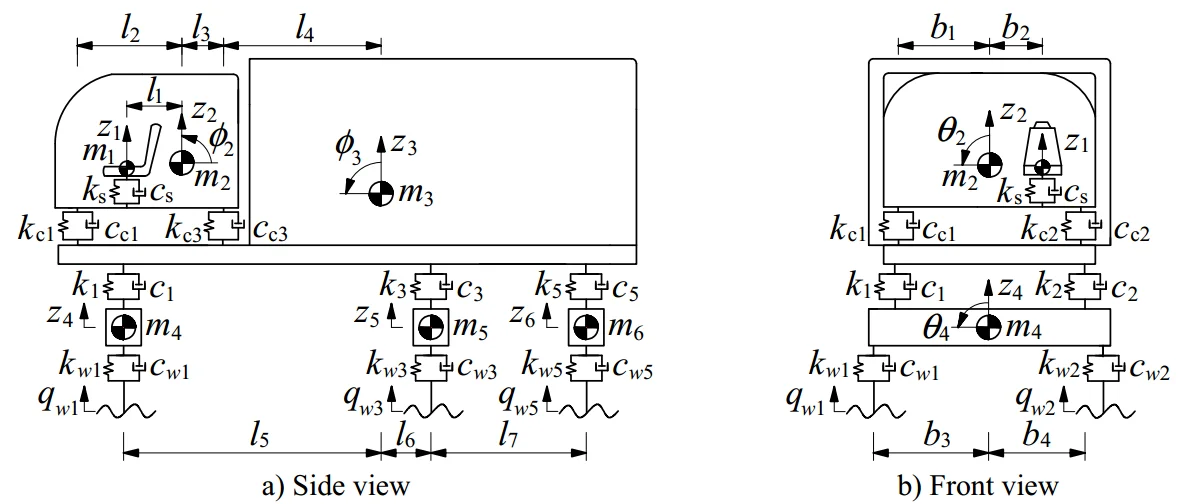
A three-axle heavy truck with the dependent suspension for the steering axle (1st axle) and the trailing arm type suspensions for two rear vehicle axles (2nd axle and 3rd axle) is selected for the vehicle dynamic analysis. A 3-D model of vehicle with 13-DOF is established to analyze the effect of the various operating conditions, as modeled in Fig. 1, where and are the vertical displacements and masses of the driver’s seat, the cab, the vehicle body and the axles; and are the angular displacements of the cab, the vehicle body and the axles; , , , and , , , are damping and stiffness coefficients of the suspension systems of the seat, the cab, the vehicle and the wheels; is the excitation of the road on the tire; and are the distances of the vehicle ( 1-4, 1-6, 2-6, 1-7).
Fig. 13D dynamic model of a heavy truck
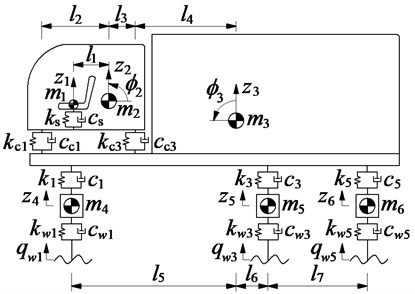
a) Side view
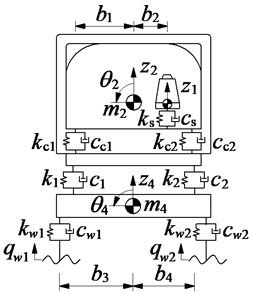
b) Front view
The dynamic reaction forces , , , and of the suspension systems of the seat, cab, vehicle, and wheels are respectively written by:
when 1-2, then 1, , ; when 3-4 then 2, , ; when 5-6 then 2, .
Based on the vehicle dynamic model in Fig. 1, and by applying Newton’s second law of motion, the motion equations of the vehicle can be represented in the matrix form as follows:
where [], [] and [] are (×) mass, damping and stiffness matrices, respectively, {} is the (×) displacement vector, {} is the (×1) exciting force vector, and is the number of DOF, ( 13).
2.2. Random excitation of the road surface
The vehicle’s ride comfort is strongly influenced not only by the vehicle dynamic coefficients but also by the dynamic interaction between vehicles and roads. The random excitation of the road surface can be represented with a periodic modulated random process. Thus, the spectral density of the road terrain surface is written in accordance with the ISO proposal [10] over the different spatial frequency ranges by. Herein, space frequency is the reciprocal of the wavelength and 0.1 m-1 is reference space frequency, 2 is the frequency index, and the value provides a measure for the random terrain with the reference spatial frequency 1/2 cycle.m-1.
More specifically, road surface roughness is assumed to be a zero-mean stationary Gaussian random process. It can be generated through an inverse Fourier transformation:
where is the number of intervals and is a random phase uniformly distributed from 0 to 2.
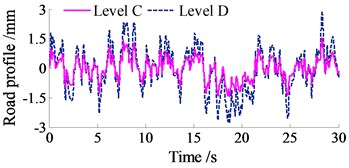
In this study, four types of road surface roughness including ISO level A-D are adopted according to the standard ISO 8068 [11], and the simulation results are shown in Fig. 2.
Fig. 2Typical road surface roughness according to ISO 8068
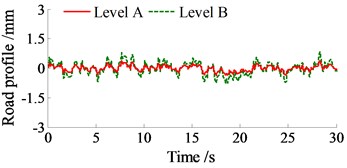
a)
b)
3. Results and analysis
3.1. Evaluate criteria
In order to evaluate the effect of the various operating conditions on the ride comfort and road friendliness of heavy truck, two evaluate methods are carried out including:
Basic evaluation method: According to the international standard ISO 2631-1 [12], the effect of vibration on ride comfort is evaluated based on the weighted root-mean-square (RMS) acceleration responses, which is defined as in Eq. (7). Herein, is the acceleration (translational and rotational) that depends on the time of measurement .
The weighted RMS value () of the vertical driver’s seat, the cab’s pitch and roll angles are calculated in Eq. (7), and the results are compared with given in ISO 2631-1:
Dynamic load coefficient (DLC): The DLC is frequently used to characterize dynamic loading of axles and it is defined as in Eq. (8) [9]. Herein, is the RMS’s value of the vertical dynamic wheel load and is the average vertical wheel load.
The DLC’s value is a range of 0.05 to 0.3 under normal operating conditions. The DLC’s value can reduce to the zero when the wheels move on a special smooth road or increase up to 0.4 when the wheels-road contact is broken [7]. In this study, the DLC’s value to analyze the vehicle-road interaction and evaluate the road friendliness of the vehicle.
3.2. Effect of the vehicle velocity and the random road surfaces
In order to evaluate the effect, the vehicle velocity and road surfaces on the ride comfort, simulations are carried out when the vehicle moves on various road surfaces in the vehicle velocities. The parameters of the heavy truck are given in Table 1. The simulation results of the acceleration responses of the vertical driver’s seat, cab’s pitch and roll angles when the vehicle moves on the road surface conditions of ISO level A and C at 20 m.s-1 forward speed are shown in Fig. 3. Besides, the weighted RMS values also are listed in Table 2.
Table 1The heavy truck dynamic parameters
Parameters | Values | Parameters | Values | Parameters | Values | Parameters | Values |
/ kg | 120 | ; / m | 0.2; 1.1 | / kN.m-1 | 20 | / kNm.s-1 | 0.2 |
/ kg | 500 | ; / m | 1; 4.68 | / kN.m-1 | 100 | / kNm.s-1 | 0.75 |
/ kg | 19 000 | ; / m | 5.18; 0.62 | / kN.m-1 | 102 | / kNm.s-1 | 7.029 |
/ kg | 450 | / m | 1.35 | / kN.m-1 | 545.4 | / kNm.s-1 | 24.09 |
/ kg | 1 025 | ; / m | 0.38; 0.8 | / kN.m-1 | 690 | / kNm.s-1 | 1.5 |
/ kg | 1 025 | ; / m | 1; 0.4 | / kN.m-1 | 1 380 | / kNm.s-1 | 3.0 |
Fig. 3The acceleration responses on the ISO level A and ISO level C
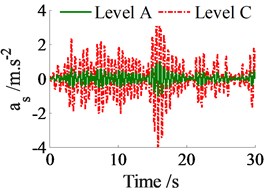
a) Vertical driver’s seat
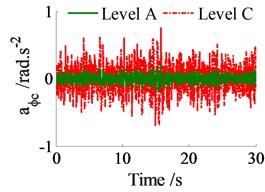
b) Cab’s pitch angle
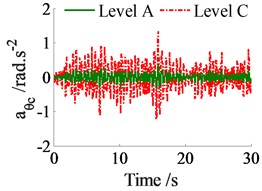
c) Cab’s roll angle
Fig. 4The weighted RMS acceleration responses on various roads in the vehicle velocity region
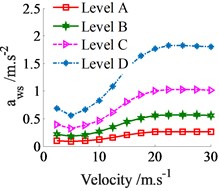
a) Vertical driver’s seat
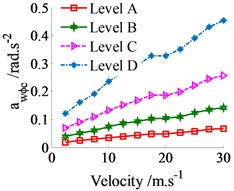
b) Cab’s pitch angle
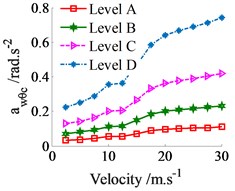
c) Cab’s roll angle
From results in Table 2 and comparison with the standard ISO 2631-1 [12], the driver feels “Not uncomfortable” and “A little uncomfortable” when the vehicle moves on road surfaces of ISO level A and B. The driver feels “Fairly uncomfortable” and “Very uncomfortable” when the vehicle moves on road surfaces of ISO level C and D. Therefore, the vehicle’ ride comfort is strongly affected on the very poor road surfaces of ISO level C and D, especially of ISO level D.
The simulation results of the weighted RMS acceleration responses on the various road surfaces in a range of the vehicle velocity from 2.5-30 m.s-1 are shown in Fig. 4. All weighted RMS acceleration responses in Fig. 4(a), (b) and (c) are greatly affected by the vehicle velocity. When the vehicle velocity is increased, the weighted RMS values are also increased, thus the vehicle’s ride comfort is reduced. Especially the ride comfort is strongly decreased at velocities from 15-30 m.s-1. However, the ride comfort is insignificantly decreased at velocities from 2.5-7.5 m.s-1. In addition, all the weighted RMS values are also clearly affected by the random road surfaces in velocity region. The weighted RMS values are the smallest when the vehicle moves on the road surface of ISO level A and the weighted RMS values are the biggest on the road surface of ISO level D. Therefore, the vehicle’s ride comfort is very poor on the road surface of ISO level D, meanwhile, good on the road surface of ISO level A.
Fig. 5The vertical dynamic wheel load at the axles
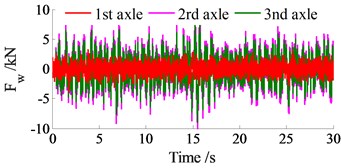
Table 2The weighted RMS values
Parameters | Road surface roughness | |||
ISO A | ISO B | ISO C | ISO D | |
/m.s-2 | 0.26 | 0.55 | 0.99 | 1.76 |
/ rad.s-2 | 0.04 | 0.10 | 0.18 | 0.32 |
/ rad.s-2 | 0.09 | 0.20 | 0.36 | 0.64 |
3.3. Effect of the loaded conditions
In order to evaluate the effect of the loaded condition on the ride comfort, three conditions of the half-loaded vehicle (Half-), fully-loaded vehicle (Fully-) and over-loaded vehicle (Over-) are respectively simulated on a road surface of ISO level B in the vehicle velocity. The result is plotted in Fig. 6. The weighted RMS values of the vertical driver’s seat, cab’s pitch and roll angles in Fig. 6(a), (b) and (c) shown that the vehicle’s ride comfort is significantly affected by the loaded conditions. All the weighted RMS values are reduced in the half-loaded condition and increased in the over-loaded condition in comparison with the fully-loaded condition. Especially, the results are clearly seen at the velocity of 10-30 m.s-1.
Fig. 6The weighted RMS values under the loaded conditions in the vehicle velocity region
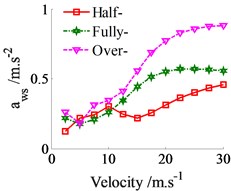
a) Vertical driver’s seat
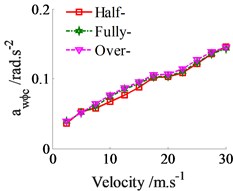
b) Cab’s pitch angle
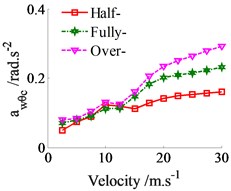
c) Cab’s roll angle
Besides, the road friendliness is concerned under the loaded conditions at 20 m.s-1 forward speed. The dynamic reaction forces between wheels and road at the axles are shown in Fig. 5. The results shown that the vertical dynamic wheel load at the 2nd axle is the biggest meanwhile at the 1st axle is the smallest. Fig. 7 also shown that the DLC’s values at the 2nd axle is higher than both 1st axle and 3rd axle when the vehicle moves on various road surfaces of ISO level A-D. This implies that the vertical dynamic wheel loads at 2nd axle greatly affect the road damage as well as the durability of the suspension system. However, this DLC’s values are in the range of 0.05 to 0.3 under normal operation conditions.
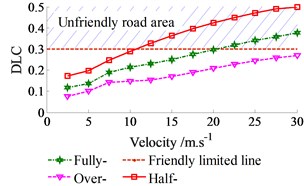
The DLC’s values are clearly affected by the velocity and the loaded conditions. At the 2nd axle and on the road surface of ISO level B, the simulation results in Fig. 8 shown that when the velocity of vehicle increasing, the DLC’s values are also increased. Besides, the DLC’s values are strongly increased in the half-loaded condition and reduced in the over-loaded condition in comparison with the fully-loaded condition. Especially at the velocity of 10-30 m.s-1 and in the condition of the half-loaded vehicle, the DLC’s value is over 0.3. It implies that the wheels on the 2nd axle and road contact are broken.
Fig. 7The DLC at the axles on the various road roughness
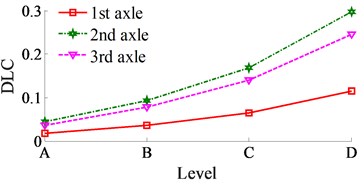
Fig. 8The DLC at 2nd axle on ISO level B
4. Conclusions
The vehicle’s ride comfort is poor when the vehicle moves on road surfaces of ISO level C and D at a range of the vehicle velocity. Especially, the vehicle’s ride comfort is very poor at the velocity of 10-30 m.s-1 on ISO level D.
In the condition of the over-loaded vehicle, the DLC’s values are reduced but the weighted RMS values are increased, on the contrary, in the half-loaded condition, the DLC’s values are increased and the weighted RMS values are decreased. Therefore, the vehicle’s ride comfort is reduced in the over-loaded condition, and the road friendliness of the vehicle on the road surface is greatly decreased in the condition of the half-loaded vehicle.
The vertical dynamic wheel load and the DLC’s value at the 2nd axle is the biggest. Therefore, the wheels at 2nd axle greatly affect the road damage, especially at the velocity of 10-30 m.s-1 in the half-loaded condition.
References
-
Li Peng Fei, Ma Li, He Tian Ming A simulation study on vibration isolation of cab mounts in a commercial vehicle. Automotive Engineering, Vol. 27, Issue 6, 2005, p. 741-743.
-
Zhang Jun Feng, He Yan Song, Yang Hai Wei Modification of cab suspension system based on pitch angular acceleration. China Mechanical Engineering, Vol. 23, Issue 18, 2012, p. 2258-2262.
-
Mahmoodabadi M. J., et al. A novel combination of particle swarm optimization and GA for pareto optimal design of a vehicle vibration model. Applied Soft Computing, Vol. 13, 2013, p. 2577-2591.
-
Tsampardoukas Georgios, Stammers Charles W. Hybrid balance control of a magnetorheo logical truck suspension. Journal of Sound and Vibration, Vol. 317, 2008, p. 514-536.
-
Xie Zheng Chao, et al. Noise-insensitive semi-active air suspension for heavy-duty vehicles with an integrated fuzzy-wheelbase preview control. Mathematical Problems in Engineering, Vol. 2013, 2013, p. 121953.
-
Buhari R., Rohani M. M., Abdullah M. E. Dynamic load coefficient of type forces from truck axles. Applied Mechanics and Materials, Vol. 405, Issue 408, 2013, p. 1900-1911.
-
Cole D. J., Cebon D. Truck suspension design to minimise road damage. Proceedings of the Institute of Mechanical Engineers, Part D: Journal of Automobile Engineering, Vol. 210, 1996, p. 95-107.
-
Lu Sun Optimum design of “road-friendly” vehicle suspension systems subjected to rough pavement surfaces. Applied Mathematical Modelling, Vol. 26, Issue 5, 2002, p. 635-652.
-
Nguyen V., Zhang J., et al. Performance analysis of air suspension system of heavy truck with semi-active fuzzy control. Journal of Southeast University, Vol. 33, Issue 2, 2017, p. 159-165.
-
ISO/TC108/SC2/WG4 N57. Reporting Vehicle Road Surface Irregularities, 1982.
-
ISO 8068. Mechanical Vibration-Road Surface Profiles-Reporting of Measured Data, 1995.
-
12ISO 2631-1. Mechanical Vibration and Shock-Evaluation of Human Exposure to Whole Body Vibration-Part 1: General Requirements, 1997.
Cited by
About this article

