Abstract
The wind induced responses of transmission tower line system are studied by finite element method. Firstly, a slip model considering eccentricity and bolt joint slippage in diagonal bracings, tower legs and tower head is built by ANSYS. The slip model has a more accurate result compared with conventional models. Secondly, the finite element models of tower line systems are established and the wind speed time histories are simulated using MATLAB. Finally, the wind induced responses of different tower line systems are studied. The results of a single tower and the tower line systems are compared to study the effects of tower-line coupling effects and bolt slippage on wind induced responses of transmission tower line systems.
1. Introduction
The transmission tower line system plays an important role in our life as a carrier of electric energy transmission. Typically, transmission line system with common characteristics such as high-rise tower, span large, flexible. So, it is very sensitive to seismic, wind, ice and other environmental loads. Wind load is more frequent compared with seismic effect because of the characteristics of wind load such as low frequency. The wind induced disasters are more than the disasters caused by the seismic effect [1, 2].
The Chinese technical code of the tower line system is separate transmission tower and transmission line before structure design [3]. The code regards transmission line’s wind load as a static load on the suspension point. So, it does not consider the interaction vibration between the tower and line in the calculation. But in recent years, several wind induced damage accidents show that the original design specification has its limitations. The existence of transmission lines has impacts on the dynamic behavior of the tower [4, 5] and the wind induced response [6, 7]. So, it is necessary to establish the transmission tower-line model and to research the dynamic characteristics, the wind induced response in order to get conclusion that has reference value of theory research and transmission tower line system design.
A finite element model considering comprehensive is very important when we study the wind induced responses. There are lots of steel angels connected by bolts within transmission towers. Bolt slippage is the relative motion caused by transverse shear loads due to the gaps between screws and screw holes. Traditional structural model for transmission towers is based on the linear elastic assumption. It is usually simplified as rigid or pinned joint by the structure analysis software in common use but without considering bolt slippage and load eccentricity. But bolt slippage can lead to that the simulated results have obvious discrepancies from the experiment and field observations in the aspect of the deformation, strain and internal force [8-10]. So, effects of bolt slippage behavior should be taken into account to study the wind induced responses of transmission tower and tower line system. However, no one had studied the effects of bolt slippage on the wind induced responses of transmission tower line system.
In this paper, two conventional models and a new model named as slip model which consider the bolt slippage is established. Compared with conventional models, the slip model has a more accurate result [10]. The tower line coupling systems corresponding to the same single tower are established. The wind speed time histories of some spatial correlative points are simulated using MATLAB. Finally, the wind induced responses of different tower line systems are studied to obtain the tower line system’s coupling effects and bolt slippage effects on the wind induced response of transmission tower line systems by comparing the results of a single tower and the tower line systems.
2. Description of the finite element model
Analysis object in this paper is a single-circuit 110 KV ZM-11 transmission tower with a nominal height of 21.0 m (Fig. 1), where is the along-line direction and is the vertical direction. Three finite element models based on ANSYS are established. The tower members are simulated by element beam188 in these models. The only difference is that the constraining conditions of the elemental nodes. One of the conventional models is called the Rigid Model, in which six degrees of freedom of elemental nodes are constrained. And the other conventional model is called Beam-Truss Model, in which single-bolt bracings are pinned connected by restricting displacement degrees of freedom and relaxing rotation degrees of freedom of elemental nodes. The third model, called the Slip Model, is established with bolt joint effects into consideration by introducing the nonlinear spring elements which were obtained in our previous work and has been verified in our previous work [10]. By setting the local coordinates of beam elements, the eccentric connections are automatically taken into account in each model.
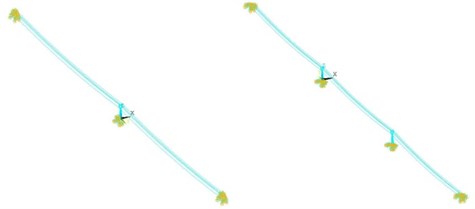
The finite element models of a transmission tower coupled with lines and transmission twin towers coupled with three-lines are established on the basis of the three finite element models mentioned above. For the convenience of description, they are abbreviated 1T2L and 2T3L respectively. This tower-line system has three conductor wires(LGJ-240/30) and two ground wires(GJ-50). The transmission line is suspension cable structure, so it can only under tension but not compression and torsion force. So, the conductor/ground wires are simulated using link10 space spar element. This element has the unique feature of a bilinear stiffness matrix resulting in a uniaxial tension-only (or compression-only). Here, the tower footing is completely restrained. The connection of the side span and the adjacent tower is simplified as hinge support. Fig. 2 shows the representative finite element models of the transmission tower-line system.
Fig. 1The picture of transmission tower
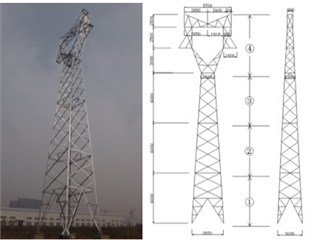
Fig. 2Finite element models of tower-line system
3. The simulation of wind field
The simulation of the wind velocity time history curves especially the fluctuating wind velocity is primary to analyze the wind induced responses of transmission tower line system.
3.1. Description of the wind velocity
The wind velocity could be expressed in the following equation:
where is the total wind velocity, is the mean wind velocity, and denotes the fluctuating wind velocity. The mean wind velocity varying with the altitude can be obtained by the exponential wind profile expression:
where (10) is the basic wind velocity representing the mean wind velocity during 10 min at the altitude of 10 m, equal to 25 m/s in this study, is the altitude, and is the ground roughness coefficient, equal to 0.15 in this study.
The time history of the fluctuating wind can be regarded as a random process with a specific power spectrum. According to the theory presented by Davenport, the fluctuating wind velocity power spectral density (PSD) function and spatial correlativity function are given:
where is the surface resistance coefficient, equal to 0.003 in this study and is frequency. , , are the space attenuation coefficient of three directions, equal to 16, 16, 10 respectively. Here only the correlation of the vertical direction is considered, so 0.
3.2. The simulation of wind velocity
The time history of the fluctuating wind velocity is simulated using auto regressive model. In which the fluctuating wind velocity is a linear combination of values added to a zero-mean random impulse:
where is the time history of the fluctuating wind, are the auto regressive parameters and is the auto-regressive order. In this paper, the mean wind velocity at the height of 10 m is 25 m/s, the time is from 0.1 s to 200s, 0.1 s, the frequency is from 0.001 Hz to 10 Hz, 0.001 Hz. The count of simulation points 20.
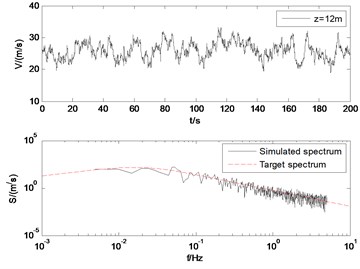
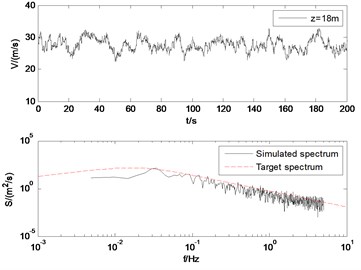
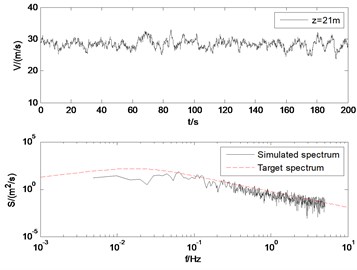
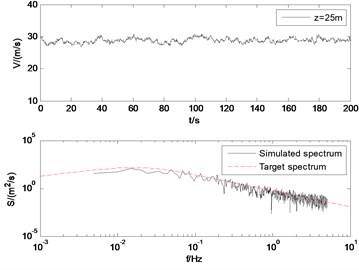
The wind velocity at the height of 12 m, 18 m, 21 m, 25 m are showed in Fig. 8. Also, the target wind power spectrum and the simulated time history of the fluctuating wind are compared. As shown in Fig. 8, the simulation results agree well with the target spectrum. With the increase of altitude, the pulsation of fluctuating wind decreases. It verifies the rationality of the model and the simulation parameters.
Fig. 3Simulated wind velocity and the PSD of the simulated fluctuating wind velocity
3.3. The wind forces
The global wind force time history of the tower is the global wind pressure and the effective area of the structure (Eq. (8)). The load of the wires can be obtained from (Eq. (9)):
where is air density, , are the shape coefficient of wind load and transmission lines respectively, is the inhomogeneous coefficient of wind pressure, is the external diameter of lines, is the span length, is the height variation coefficient of wind pressure. So, we can obtain the time history of wind load. It provides condition to the calculation of wind induced response.
4. The analysis of wind induced responses
The dynamic time history responses of different tower line systems under wind loads are studied. To obtain the tower line system’s coupling effects and bolt slippage effects on the wind induced response of transmission tower line system, the displacement and acceleration root mean square (RMS) with five altitudes of the tower concluding 6 m, 12 m, 18 m, 21 m and 25 m are extracted to analyze.
4.1. The comparisons among different tower models
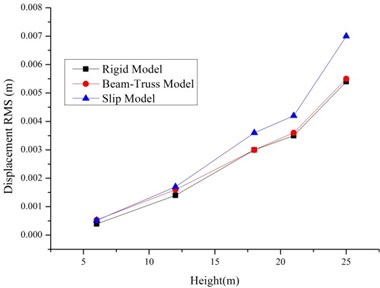
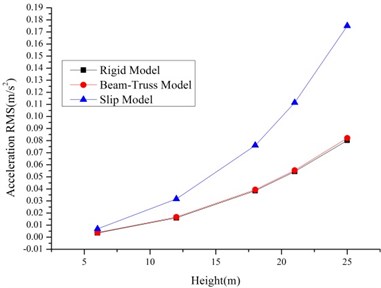
As shown in Fig. 4-5, the RMS of the displacement and accelerations increase with the increase of the height. It is because of the existence of bolt slippage especially the tower head bolt slippage. The result of the Rigid Model and Beam-Truss Model are very similar, while Slip Model has a larger value. And the increase ratios relative to the Rigid Model of 1T2L system are larger than single tower. It is because of the existence of the transmission lines.
Fig. 4The RMS of displacements and accelerations of the single tower with different models
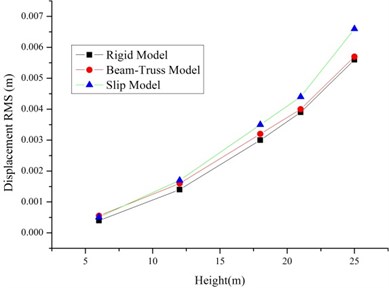
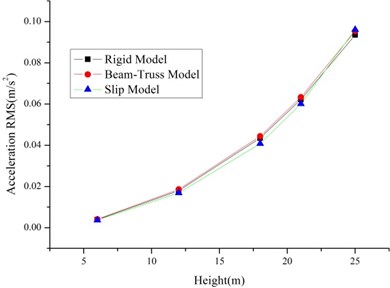
Fig. 5The RMS of displacements and accelerations of the 1T2L system based on different models
4.2. The comparisons among single tower and tower line systems
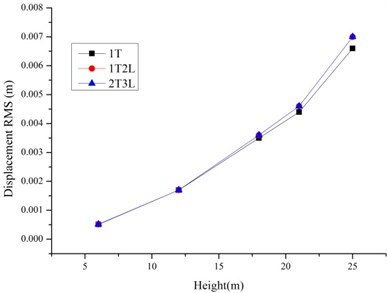
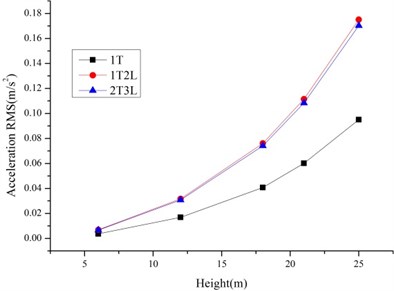
As shown in Fig. 6-7, the RMS of the displacement and accelerations of tower line systems are larger than single tower because of the tower line coupling effects especially for the tower line systems based on Slip Model. The increase ratios relative to the single tower for Rigid Model is lower than the Slip Model. So, the tower-line coupling effects and bolt slippage have effects on the wind induced responses of transmission tower line systems.
Fig. 6The RMS of displacements and accelerations of the tower line systems based on rigid model
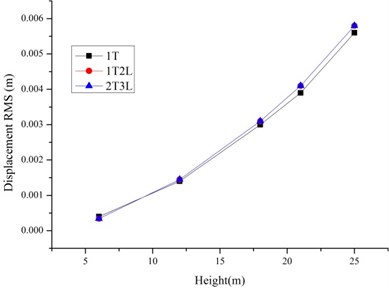
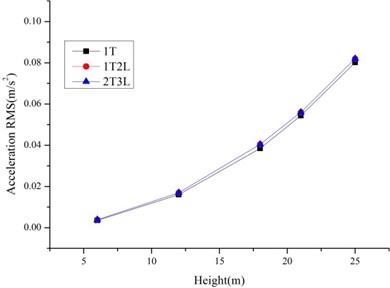
Fig. 7The RMS of displacements and accelerations of the tower line systems based on slip model
5. Conclusions
The tower line systems finite element models based on three single tower models are established to study how the bolt slippage and tower-line coupling affect wind induced responses of transmission tower line systems. The existence of the transmission lines and bolt slippage leads to the larger value of RMS of the displacement and accelerations of tower line systems. And the influence of bolt slippage increases because of the transmission lines. So, considering the bolt slippage and tower-line coupling effects can be further optimize the transmission tower structure.
References
-
Xie Q., Zhang Y., Li J. Investigation on tower collapses of 500 kV Renshang 5237 transmission line caused by downburst. Power System Technology, Vol. 30, Issue 10, 2006, p. 59-63.
-
Zhi Z. Analysis of the galloping fault on the 117# 110 kV Mafu transmission line. High Voltage Engineering, Vol. 30, Issue 1, 2004, p. 54-56.
-
Code for Design of 110-750 kV Overhead Transmission Line, GB 5045-2010. China Electricity Council, China Planning Press, Beijing, 2010.
-
Li H. N., Wang Q. X. Dynamic characteristics of long-span transmission lines and their supporting towers. China Civil Engineering Journal, Vol. 30, Issue 5, 1997, p. 28-36.
-
Feng X. D., Fu F. R., Miao T. C., et al. Effect of the dynamic characteristic of long-span transmission tower on high voltage transmission line. Applied Mechanics and Materials, Vol. 687, Issue 691, 2014, p. 3423-3426.
-
Zhang L. L., Xie Q., Li J. Dynamic wind-induced response analysis of multi-tower-line coupled system of transmission line. Journal of Disaster Prevention and Mitigation Engineering, Vol. 26, Issue 3, 2006, p. 261-267.
-
Song Y. J., Dai Z. H., Wang W., et al. Analysis of wind-induced dynamic response of transmission tower-line system. Journal of Natural Disaster, Vol. 16, Issue 4, 2007, p. 91-96.
-
Ahmed K. I. E., Rajapakse R. K. N. D., Gadala M. S. Influence of bolted-Joint slippage on the response of transmission towers subjected to frost-heave. Advances in Structural Engineering, Vol. 12, Issue 1, 2009, p. 1-17.
-
Jiang W. Q., Wang Z. Q., McClure G., et al. Accurate modeling of joint effects in lattice transmission towers. Engineering Structures, Vol. 33, Issue 5, 2011, p. 1817-1827.
-
Wang P., Chen H. B., Zhang H. W., et al. Effect of bolt joint on the behavior of transmission tower with non-uniform settlement. Engineering Mechanics, Vol. 32, Issue 10, 2015, p. 209-219.
About this article

