Abstract
A hybrid method to obtain nanometric displacements based on interference fringes movement by optical beam deflection is proposed. A proof-of-principle experiment is described as a new method for real-time detection and measurement of small vibrations, experimental results shows an increase in the resolution compared with a simply optical beam deflection read out. Also, there is minimum detectable displacement in an assumed noise environment.
1. Introduction
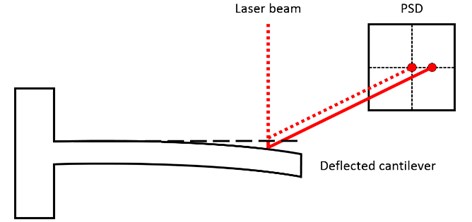
The quantification of displacement is one of the most important physical variables to determine for science and engineering; in which surface profiles, velocity and vibrations are obtained by means of the change in distance measured. An attribute of relative distance measurement is that it is needed for very long and very short distances. For both cases, optical measurement methods offer plenty advantages compared to other measurement methods; being sensitivity, stability and non-contact measurement its most remarkable characteristics [1]. Since the invention of the laser in the 1960s and the emerging progress into optoelectronics, different optical measurement methods have been developed, where laser interferometry has predominated as the most accurate technique for displacements on nanometer scales. But, on the other hand, through optical beam deflection (OBD) it is possible achieve accurate nanometric displacement measurements, with a less complex setup than the required for an interferometer. The OBD technique introduced by Meyer and Amer [2] is a very reliable and simple detection method developed in the 1980s as a novel optical approach to atomic force microscopy (AFM). In an OBD readout system, as shows Fig. 1, a light beam from a laser is focused at the end of the cantilever and reflected to a position sensitive detector (PSD). The bending of the cantilever results in a large change in the direction of the reflected beam, which can be detected by the PSD as an electric current difference [3, 4].
Fig. 1Optical beam deflection readout system
For the detection of the cantilever displacements in AFM, as in any optical detection system, the fundamental limits to the resolving power of the OBD are set by diffraction and shot noise due to the particle nature of light [5]. Otherwise, the resolution of the OBD increases with the radius of the waist of the beam, the power carried by the beam, and the reciprocal of the wavelength. Nevertheless, with these parameters in the practice it is not easy to increase the resolution of the OBD, i.e., to achieve a high spatial resolution a small waist beam in needed, but on the other hand a small waist may restrict the optical power. Also, in case of biological samples, with a high optical power there is a high probability of damaging the sample [6]. Then, the aim of this work is to show that it is possible achieve high resolution with a novel OBD setup and readout system notwithstanding the fundamental limits that exist in a conventional OBD system.
2. Experimental setup
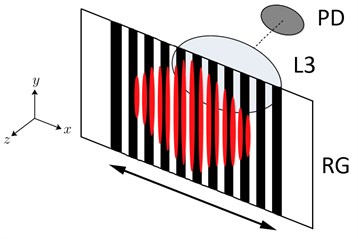
Accordingly, a hybrid method based on interference fringes movement by optical beam deflection is proposed to develop a nanometric displacement sensor. Implementing a simply OBD setup, as shows Fig. 2., a diode laser (DL) Coherent 0221-698-01 REV B, which generated 1 mW circular beam with 1/e2 diameter of 1 mm, is focused by a convex lens (L1) in a glass microscope slide (GS) placed at 45° respect to the optical path. The interaction of the light beam with the glass slide, as in all matter, can take four forms; transmission, reflection, scattering and absorption [7]. Only a small portion of the spectrum is scattered and absorbed by the glass slide, being practically non-issue. Otherwise, due to the changes in refractive index that exists between media bounding air-glass and glass-air, the laser beam experiments multiple reflections inside the glass slide. This produces an optical path difference and consequently creates a multiple beam fringes by transmission and reflection [8]. The interference pattern formed by reflection strikes a mirror (M1) attached to an optical post assembly, and it reflection strikes a mirror (M2) attached to an aluminum cantilever with a lumped mass at it free end. The interference pattern is reflected back to the mirror M1, and strikes again the glass slide to be transmitted towards a 37 mm camera lens (L2). This lens expands the interference fringe pattern in order to match it with a grating with opaque and transparent parallel lines uniformly spaced, known as a Ronchi grating (RG). As shows Fig. 3, the opaque lines block partially the constructive interference fringes, then, when the cantilever undergoes deflection, the interference fringes moves horizontally, leading to the constructive interference fringes to gradually leave the blocking lines and be transmitted, and focused by a convex lens (L3), to a silicon detector (PD). As a consequence, there is an incident intensity increment in the photodetector as a function of the deflection.
Fig. 2Experimental setup
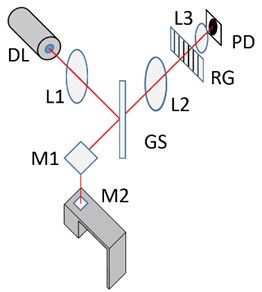
Fig. 3Partial blocking of interference fringes as intensity modulation
Most of the analysis instruments are based on voltage measurements, and since the photodetector is a current source, the photocurrent generated is converted to voltage as impedance through a transimpedance amplifier (TIA) with a T network in the feedback loop, in order to get a low dc resistance path in the feedback loop. By means of a DAQ NI-USB 6216 the proportional analog voltage is converted to a digital data to be analyzed in a LabVIEW® virtual instrument. It is important to mention that the experimental setup is placed in a vibration isolated optical table with the purpose of reduce the uncertainty of measurements.
3. Results and discussion
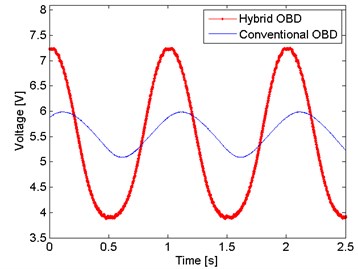
Accordingly, to the main objective, the first measurements were the comparison between the proposed OBD and the conventional OBD. For this experiment the setup shown in Fig. 2 is modified, i.e., the aluminum cantilever is replaced by a Lead Zirconate Titanate piezoelectric (PZT), in order to ensure a controlled displacement and it is placed vertically, this means that the mirror M1 is removed. The conventional OBD setup consist only of three elements; the light source, the PZT cantilever, and a photodetector. As an equivalent of the PSD detection, a knife is placed in front of a half part of the photodetector. A function generator Agilent® 33521A is used to feed the PZT with an amplitude of 20 Vpp and a frequency of 1 Hz in both setups. The Fig. 4 shows the comparison between the conventional and hybrid OBD.
Both signals are not in phase due that were recorded at different times. The amplitude of the hybrid OBD is, approximately, 1.24 times bigger than the conventional OBD; there is only an amplitude difference of 24 %, not big enough to mention the hybrid OBD as a better technique. But on the other hand, it is important to mention that in the conventional OBD the optical power carried by the beam is bigger than the carried in the hybrid OBD, i.e., the optical power measured that strikes the photodetector in the conventional OBD is almost 400 µW, meanwhile in the hybrid OBD the optical power measured at the photodetector is 40 µW. This due to that the interference pattern used in the hybrid OBD is obtained from the reflection of the glass slide, thus there is a low optical power that strikes the mirror attached to the PZT. Then, another conventional OBD setup was develop using the optical power reflected by the glass slide. A convex lens is placed before the photodetector in order to focused the optical power in the knife edge. As shows the Fig. 5, there is an increase in the amplitude of 3 times when both setups were with the same conditions of optical power.
Fig. 4Hybrid OBD against conventional OBD
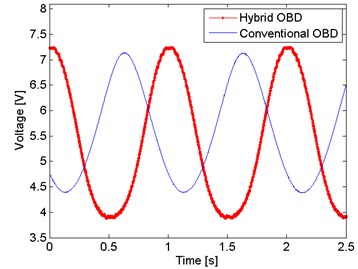
Fig. 5Hybrid OBD against conventional OBD with the same conditions of optical power
3.1. Characterization of the aluminum cantilever
When a cantilever system is subjected to free vibration and the system is considered as a discrete system in which the cantilever is considered as mass-less and the whole mass is concentrated at the free end of the it. The governing equation of motion for such system will be:
where is the concentrated mass at the free end of the cantilever, and is the stiffness of the system. The transverse stiffness of a cantilever beam is given as [9]:
where is the Young’s modulus of the cantilever material, is the cantilever length and is the moment of inertia given by [10]:
where and are the breadth and depth of the cantilever beam cross-section respectively. The fundamental undamped natural frequency of the lumped mass system is given as [9]:
where is the cantilever mass. Dimensions and parameters of the cantilever used are given in Table 1.
Table 1Parameters and dimensions of the cantilever with lumped mass at it free end.
Parameter | Symbol | Value | Unit |
Material | – | Aluminum | – |
Density | 2700 | kg∙m-3 | |
Young’s module | 69 ×109 | N∙m-2 | |
Cantilever length | 46.10×10⁻³ | m | |
Cantilever breadth | 16×10-3 | m | |
Cantilever depth | 1.10×10⁻³ | m | |
Cantilever mass | 2.20×10⁻³ | kg | |
Lumped mass | 17.10×10⁻³ | kg |
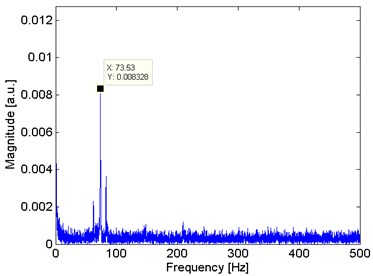
Resolving Eq. (2) and Eq. (3) with the values displayed in Table 1, and substituting in Eq. (4), the fundamental natural frequency of the cantilever used in the experiment is 73.56 Hz. In the time domain signal, as Fig. 6 shows that there is not an appreciable amplitude from the readout system. But, through Fourier analysis from the signal in time domain, a predominant frequency in 73.53 Hz is appreciated. Other two components are appreciated in 62.10 Hz and 82.69 Hz, when the first one is related to the fundamental frequency of electric power. The predominant frequency match with the natural frequency of the cantilever obtained in Eq. (4).
Fig. 6Time domain signal with the cantilever in steady state
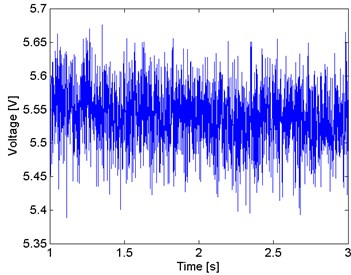
Fig. 7Frequency domain analysis from the cantilever in steady state
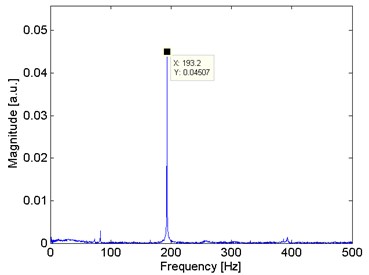
In the presence of a frictional force, the natural frequency oscillation is determined by the ratio between the damping factor and the cantilever natural frequency in radians per second. Oscillations with periodic and exponentially decreasing amplitude means . Then, a frictional force is introduced in the fixed end of the cantilever, as shows Fig. 8, and there is an appreciable under damped response. Furthermore, in Fig. 9, the predominant frequency changes to 193.20 Hz, but the natural frequency is still appreciating in a less magnitude.
Fig. 8Time domain signal with the cantilever perturbed
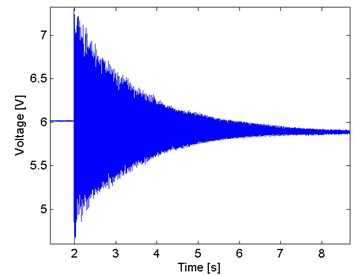
Fig. 9Frequency domain analysis from the cantilever perturbed
4. Conclusions
With the same conditions of optical power, the hybrid OBD have a sensitivity of 3 times bigger than the conventional OBD. The minimum displacement detected, without a lock-in amplifier system, is almost 16 nm in the PZT cantilever. Furthermore, in the last experiments developed, the aluminum cantilever is useful to determinate liquid characteristics when the lumped mass is in contact with the sample, i.e., the damping factor of the cantilever is related with some properties as density. A resonator instead a glass slide to get an interference fringes with less losses in the optical power would be useful as an improvement, but on the other hand, with a low optical power is possible handling biological samples and get information about its behavior.
References
-
Donges A., Roll N. Laser Measurement Technologies Fundamentals and Applications. 1st Edition, Springer Verlag, Berlin, 2015.
-
Meyer G., Amer N. Novel optical approach to atomic force microscopy. Applied Physics Letters, Vol. 53, Issue 24, 1988, p. 2400-2402.
-
Sarid D. Scanning Force Microscopy. 1st Edition, Oxford University Press, New York, 1994.
-
Bashir R., Werely S., Bimolecular Sensing. Processing and Analysis. 1st Edition, Springer, 2006.
-
Putman C., De Grooth B., Van Hulst N., Greve J. A detailed analysis of the optical beam deflection technique for use in atomic force microscopy. Journal of Applied Physics, Vol. 72, Issue 1, 1992, p. 6-12.
-
García-Valenzuela A., Díaz-Uribe R. Approach to improve the angle sensitivity and resolution of the optical beam deflection method using a passive interferometer and a Ronchi grating. Optical Engineering, Vol. 36, Issue 6, 1997, p. 1770-1778.
-
Callister W.D. Jr. Fundamentals of Material Science and Engineering 5th Edition, John Wiley and Sons, New York, 2001.
-
Hariharan P. Basics of Interferometry. 2nd Edition, Academic Press, San Diego, 2007.
-
Harris C. M. Shock and Vibration Handbook. 4th Edition, McGraw Hill, New York, 1996.
-
Gere J.M., Goodno B. J. Mechanics of Materials. 8ht Edition, Cengage Learning, Toronto, 2012.
About this article
This work was supported by DGAPA-UNAM through financing of Project PAPIIT IT101515. Besides we thank to Consejo Nacional de Ciencia y Tecnología (CONACyT) for its financial support in form of a scholarship for the Master and Ph.D. Engineering Program at Universidad Nacional Autónoma de México.
