Abstract
Vibration analysis is generally used in the industries for condition monitoring of various electromechanical equipment. For the predictive maintenance of the industry equipment, several techniques have been applied which are based on capacitive and piezoelectric accelerometers. However, they possess several real time problems due to the negative influence of electromagnetic interference. The major problem lies in the detection and transmission of various physical parameters in the noisy and harsh environment. In order to solve the weak points of commonly used structural vibration detection sensors that are easily affected by the harsh environment of the engineering site, the principle of optical fiber sensing is studied, and the system optical path is designed based on MZ interference technology. In this work, a special data acquisition and processing software is developed to acquire the sensed data and the vibration detection is carried out on the steel cantilever structure pasted with fiber optic sensors. Extraction using FFT and pattern recognition through bp neural network yields the system accuracy rate of 96.7 %. The proposed interference type optical fiber technology provides a novel approach for real-time monitoring of engineering structure vibration laying the foundation for the research of intelligent buildings.
Highlights
- This work solve the weak points of commonly used structural vibration detection sensors
- The system optical path is designed based on mz interference technology
- A special data acquisition and processing software is developed to acquire the sensed data
- The vibration detection is carried out on the steel cantilever structure pasted with fiber optic sensors
- Extraction using fft and pattern recognition through bp neural network yields the system accuracy rate of 96.7%
- The proposed interference type optical fiber technology provides a novel approach for real-time monitoring of engineering structure vibration
1. Introduction
The vibration problems in the actual engineering structure are very complicated, such as the vibration of high-rise buildings, high-rise buildings, suspension bridges, etc. under load, and the vibration of buildings under the action of earthquakes and explosion shock waves. It is used to investigate whether the researched object is working normally and whether there are hidden safety hazards, so as to evaluate the original calculation, design and construction. The vibration detection of the structure used mechanical instruments [1]. in the early stage, and the frequency was measured with a spring based on the principle of resonance. The amplitude is measured with a dial indicator, and manual readings are taken, which results in the limit of the measurable frequency amplitude range. The vibration frequency and dynamic range of the magnetoelectric vibration sensor that appeared later have been expanded, but they are easily affected by harsh environments.
The optical fiber sensor developed from the 1970s uses the change in the propagation characteristics of light in the optical fiber to measure the environmental changes it receives. The advantages of the optical fiber sensor include small size, light weight, soft and easy to arrange, and will not Change the stress state of the structure; strong anti-interference ability (electromagnetic field, humidity, chemical corrosion), high sensitivity, long life; real-time online measurement on site, wide measurement range, good stability, and easy implementation of sensor network, etc. Therefore, optical fiber sensors have been widely used in aerospace, bridges, dams, new materials and other fields [2]. A revolutionary technological intervention came across by the usage of fiber optic sensor telecommunication technology with optoelectronic devices [3-6]. This new advent replaces the majority of environmental sensor nodes in the present world, thereby replacing the current marketing scenario where the sensors with the comparable abilities are not present. Remote vibration monitoring has become possible by the usage of compact portable instrument packages combined with the advanced optical transducers and other localized parts of electrical machinery. These equipment are immune to electromagnetic interference [4, 5] due to its inherent electrical isolation and superior dielectric properties. Additional to these properties, optical fiber sensors generally provide the non-contact and perturbation free monitoring by providing a new dimension to the vibration monitoring of electromechanical equipment [6, 7]. Fiber optic sensors are of two types: extrinsic and intrinsic; depending upon the sensing criteria. Extrinsic fiber optic sensors are characterized by those whose sensing takes place outside the fiber whereas, intrinsic fiber optic sensors are characterized by the sensing taking place with the fiber itself [8-13].
The main source of undesired vibrations are the environment, the machine tool or the process involved in it [14]. There have been various attempts over the past decades for finding the best operating point considering the tool vibration, its cutting efficiency as well as quality. Out of various methods, the approach utilizing dynamic precision measuring for tool vibration control is superior as it involves vibration control and optimized health monitoring of the tools [15, 16].
In this paper, a fiber-optic sensor vibration detection system based on the principle of Mech-eZhnder (MZ) interference is proposed. A special data acquisition and processing software is developed to acquire the sensed data. Forced vibration detection and freedom are carried out on the steel cantilever structure pasted with fiber optic sensors. The vibration detection approach faces attenuation while using the traditional mature dynamic strain measurement system for detection. However, after analysis, it is seen that the detection outcome indicates that the optical fiber sensor vibration detection system and the corresponding software are reliable and practical [17]. This work contributed in pattern recognition of the vibration signal utilizing the Fast Fourier Transform (FFT) and back propagation (BP) neural networks. The novelty of the proposed approach is that it provides a new approach for real-time structure vibration monitoring which has a long service life and can be buried in the structure for long-term online monitoring. This novel approach provides various advantages like high sensitivity, small size and light weight, interference from electromagnetic fields, no heat, sparks, electromagnetic fields, small information loss, remote monitoring and corrosion resistance. It shows that the interference type optical fiber technology where the sensing part is pasted on the surface of the structural part (or buried inside the structural part) provides a new method for real-time monitoring of engineering structure vibration and also lays the foundation for the research of intelligent buildings. When compared to the contemporary methods, the proposed fiber-optic sensor vibration detection system outperforms while providing a reliable and feasible vibration monitoring solution.
The rest of this article is arranged as: Section 2 providing the literature review of existing techniques in the field of optical fiber technology. The test principles of all fiver sensing detection systems are discussed in Section 3 followed by the discussion of research on pattern recognition algorithms in Section 4. Section 5 provides the experimental results and analysis part and the conclusion and future rationale of this work is presented in Section 6.
2. Literature review
Wu, et al. proposed a slope deformation monitoring strategy based on embedded ARM and Linux system, an optical fiber temperature sensor detection circuit is designed. Embedded driver programme is design by using Linux kernel, indirect location of peak reflectance spectra is achieved by capturing multiple external interrupts, multisim software is used to simulate the performance of the peripheral hardware of detection circuit, and the graphical interface of embedded system is designed based on QT. The results of hardware circuit operation show that the Linux kernel of embedded system can boot and start normally, and the peak value of optical fiber reflectance spectrum and corresponding temperature can be displayed in real time on the graphical interface of QT. Compared with the traditional industrial control development board, the system can display the measurement results more visually and intuitively [18]. Zhang, et al. presents an overview of the latest development and application of OFS based slope deformation monitoring from two aspects: 1) Fiber Bragg grating (FBG) based sensing and monitoring technology; 2) Distributed optical fiber sensors (DOFS) including Brillouin Optical Time Domain Reflectometry (BOTDR) and Brillouin Optical Time Domain Analysis (BOTDA) for slope monitoring. Meanwhile, current challenges in implementing the OFS-based slope monitoring technology are discussed [19]. Yao and Jia designed a set of intelligent monitoring system based on FIX configuration software and SHCAN field bus, realizes man-machine interface, completes real-time data acquisition and display, remote monitoring and control, data recording, alarm and other functions, and meets the production monitoring requirements of LNG gas station. Experimental results show that the real-time display of the completed data can be refreshed within 300 ms, the historical data of several years can be recorded, and the alarm management can be realized. The effect proves that the design scheme of the monitoring system is correct and effective [20].
The technological advent in fiber optic vibration sensors consist of various types like point sensors, quasi-distributed and distributed sensors. All these sensors are deployed for vibration monitoring and among then FBG vibration sensors have gained popularity due to its advantages like low noise, easy multiplexing, and embeddability. A low-cost system employing optical accelerometer system have been proposed by the authors in [21], which is capable of detecting the frequency range upto 45 Hz. Utilizing the L-shaped cantilever beam another compact FBG accelerometer-based approach was proposed by [22], which was able to measure the vibrations at frequency range of 0-110Hz. A novel FBG accelerometer-based approach was developed, which offers vibration measurement over the wider frequency range of 10 to 200 Hz [23]. The field of vibration measurement was extended to quasi-distributed vibrations while applying the FBG sensors [24, 25]. However, from the literature, it is clear that these approaches require the prior knowledge of vibration positions which is not practically feasible for variety of applications. Therefore, these approaches are needed to be improved. This improvement was made possible with the technological advent in distributed fiber-optic vibration sensors. These sensors provide the complete distributed vibration information of the entire optical fiber link, thus providing the arbitrary locations to be detected. These sensors are comparatively much more light weight, having flexibility, geometrical versatile providing prompt response with simplicity and are immune to electromagnetic interference [26-28]. These distributed sensors mainly include interferometric sensors which have attracted the significant amount of research advents involving Sagnac interferometer [29], the Mach-Zehnder interferometer (MZI) and Michelson interferometer (MI) [30]. This research work utilizes the MZI interferometer for the vibration measurement of very small vibrations which are highly sensitive and difficult to measure. These sensors have good concealment, are highly sensitive and provide accurate location estimation, thereby suitable for large scale monitoring.
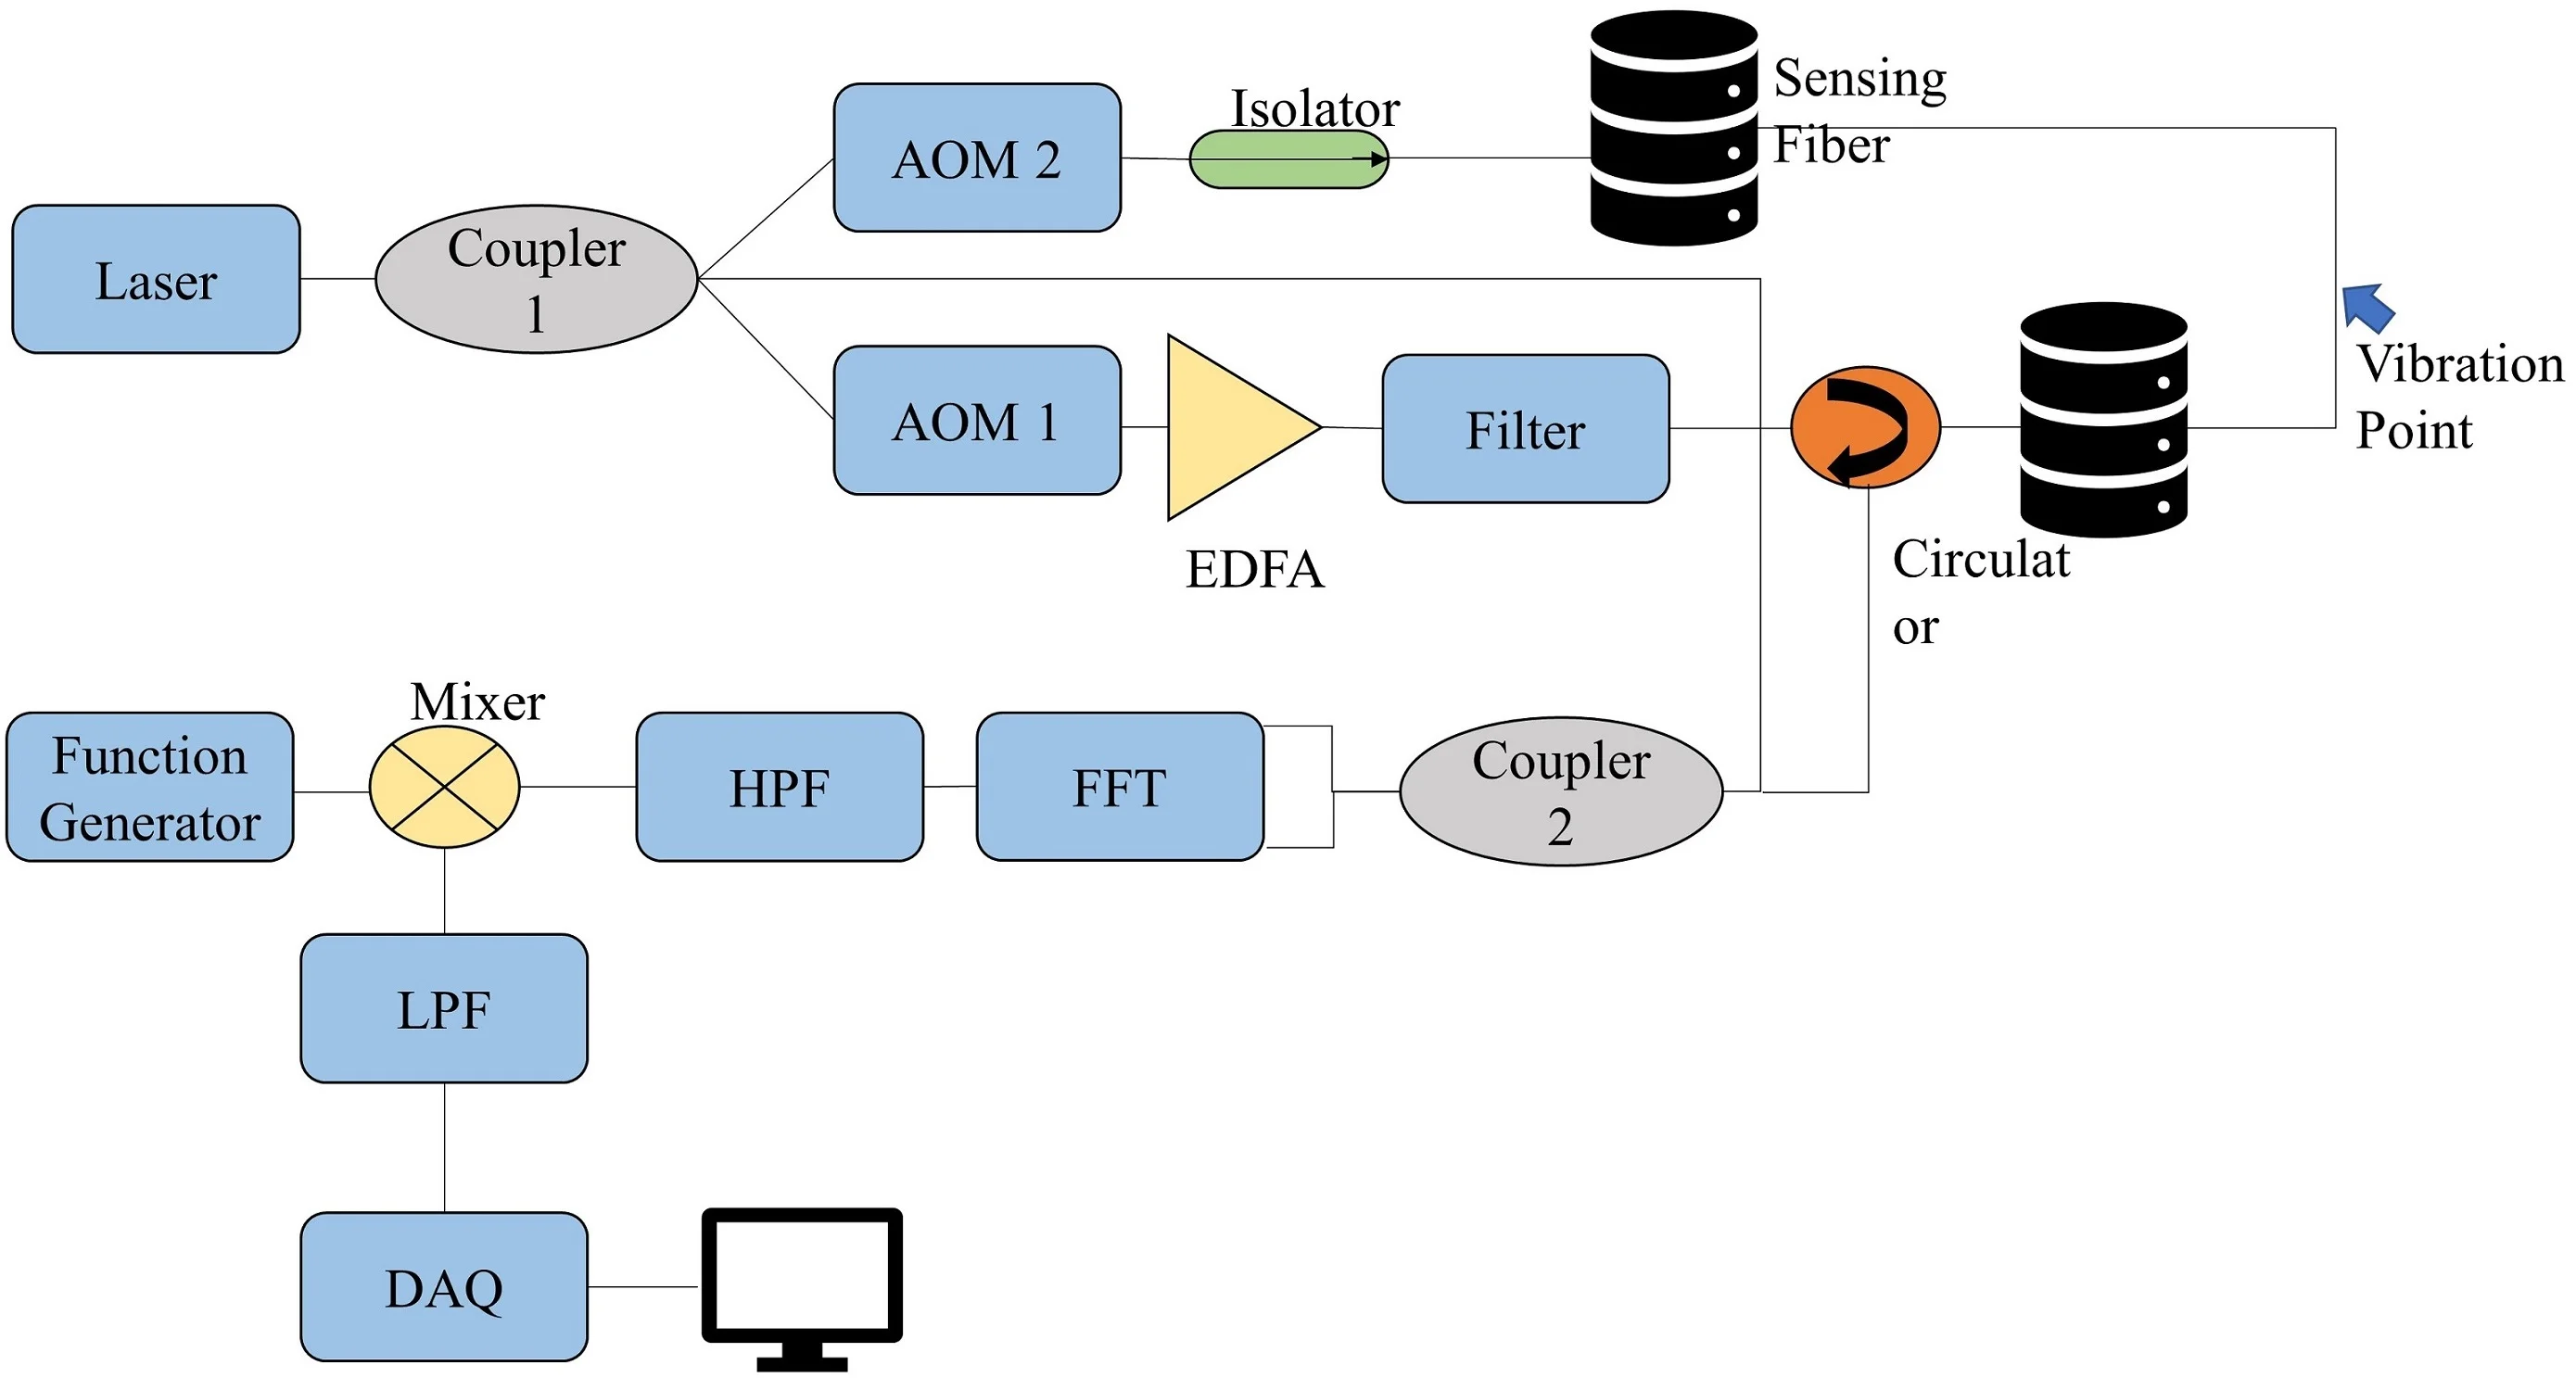
3. Test principle of all-fiber sensing detection system
The all-fiber Mach-Zengde sensor detection system can be used for strain and vibration detection of complex material structures. The fiber optic sensor system is mainly composed of three parts: light source, fiber and detector. The coherent light emitted from the laser is injected through the lens group. The input end of the optical fiber is divided into two equal beams by the first coupler (3 dB), injected into the measurement fiber and the reference fiber, and then gathered into the second coupler (3 dB). When an external signal acts on the measurement fiber, the internal light beam and the reference optical fiber internal light beam have an optical path difference and interfere, and the light intensity received by the photodetector is:
In the above formula, is the light intensity emitted by the laser, is the coupling coefficient, is the phase shift caused by the external signal. The signal received by the photodetector is the change in light intensity, and it is converted into the electrical signal is amplified and then converted to an input to the PC, and finally the self-editing software can be used for data processing.
3.1. Principle of strain test
When the optical fiber is pasted on the surface of the object, its strain is mainly caused by the axial strain of the object, and the influence of the lateral strain and shear strain of the object on the optical fiber strain is negligible. The phase of the transmitted light in the optical fiber, the phase shift of the output light caused by the change of the optical fiber is:
where is the optical phase, is the mode propagation constant, is the strain constant, is the measured length of the fiber, and is the change in refractive index. This value of optical phase is used in the following Eq. (3) to calculate the calibrated value of optical fiber constant denoted by :
Among them, the fiber constant is related to the strain coefficient and refractive index of the fiber, that is, the phase change of the optical fiber per unit length of the fiber should be proportional to the average of this length. Due to the difference of various fiber parameter values, each measurement in each experiment. The calibration experiments are conducted in order to evaluate and adjust the precision and accuracy of the fiber constant using different values of optical phase , length of the optical fiber and strain constant .
Paste the fiber optic sensor and the resistance strain gauge on the corresponding positions of the upper and lower surfaces of the same cantilever beam respectively, then add a load to the cantilever beam to deform it. Analyze the phase change of the output signal of the fiber optic sensor, that is, the light intensity change; at the same time collect the resistance strain. According to the calculated data, the strain is obtained, and finally the relationship between the phase (light intensity) change and the strain per unit length of the fiber is obtained, and the value [31]is obtained according to the formula depicted in Eq. (3).
3.2. Principle of vibration test
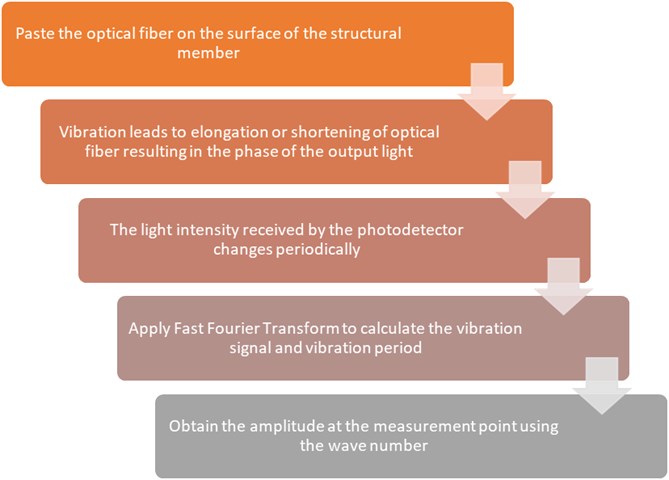
The principle of vibration test done in this experimental work is illustrated in Fig. 1.
Paste the measurement optical fiber on the surface of the structural member (or buried inside the structural member). When the structural member vibrates, it causes the measurement optical fiber to elongate and shorten alternately. The phase difference changes alternately lead to the vibration response, resulting in the phase of the output light. Make periodic changes, and the light intensity received by the photodetector also changes periodically. After FFT (Fast Fourier Transform) calculation of the vibration signal, the vibration spectrum of the structural parts can be obtained, thus obtaining the vibration period (). Then calculate the wave number in the quarter-cycle (TT4) of the vibration signal, and combine with the fiber material constant to obtain the amplitude at the measurement point, and then draw the amplitude of the structural component time history curve.
Fig. 1Principle of vibration test
4. Research on pattern recognition algorithms
The optical fiber sensing system based on the principle of MZ interference has extremely high sensitivity and is also very sensitive to small vibrations. When interference signals appear in the external environment, such as small animals such as birds climbing and touching, wind, rain, etc., causes interference effects on the optical cable. It will also cause the vibration of the optical fiber, which will cause the detection signal to change and affects the system’s correct determination of the external intrusion behavior and cause false alarms [32]. Therefore, the main aim is to eliminate environmental interference and conduct the signal. Feature extraction and pattern recognition can effectively reduce the false alarm rate of the system.
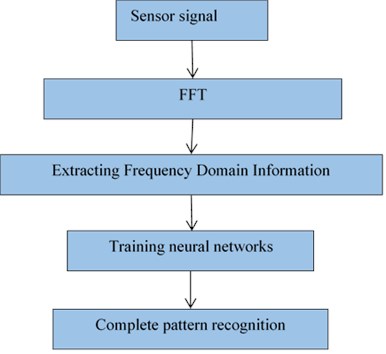
In view of the characteristics of the output signal of the MZ vibration monitoring system, this paper uses fast Fourier transform (FFT) to extract the frequency domain features of the signal, and input the extracted features into the neural network for training to achieve pattern recognition. The pattern recognition flowchart is shown in the Fig. 2.
Fig. 2Pattern recognition process
4.1. Feature extraction of vibration signals
Feature extraction is a very important part of the entire signal pattern recognition. It is basically to extract the feature parameters that most represent the essence of the signal. Signal feature extraction directly affects the accuracy of the entire system. It is the key to reducing the false alarm rate. Satisfy:
(1) The characteristics of different types of signals are very different, and the characteristics of the same type of signals are similar;
(2) The correlation of different characteristic parameters of the same signal is small;
(3) The algorithm is simple and real-time.
Signal pattern recognition can generally analyze the signal in the time domain and the frequency domain. Analyzing the signal in the time domain is mainly to obtain the characteristic parameters by observing the time waveform of the signal, and to compare the difference between the parameters to interfere the intrusive disturbance signal with the environment. The signal is discriminated and accurately determined in real time to achieve the purpose of security. Generally, analysis in the time domain is more intuitive and simpler. By observing the time domain waveform, you can directly obtain parameters such as signal amplitude peak value and peak number [33].
The application environment of the fiber-optic sensor vibration monitoring system studied in this paper is complex and requires high real-time performance. In order to control the cost of using an embedded system, the amount of calculation should be as small as possible. Through the above analysis,
In order to meet the requirements of high accuracy, low false alarm rate, good real-time performance and the normal operation of the system, this paper uses FFT to extract the frequency domain characteristics of the signal, the calculation amount is relatively small, and the effect is also ideal.
4.2. FFT algorithm
The FFT algorithm can be divided into a time-based decimation method and a frequency-based decimation method. Here we focus on describing the time-based radix 2FFT algorithm.
Let the number of sequence points be , where the is a positive integer, and a number of zero points can be artificially added to make it meet the requirements. The sequence of is divided into two groups according to the parity of the :
where, .
Using its reducibility, the Fourier transform can be expressed as:
The points of and are expressed by and respectively DFT, then Eqs. (4-9) can be expressed as:
Therefore, using Eq. (10) to calculate only the first half of , in order to express all values of in terms of and , the periodicity must be applied to obtain:
After the operation, the second half of can be obtained:
where, .
So, just ask to all and values in the interval, the values of all in the 0 to interval can be obtained, which greatly saves the operation.
5. Results and discussion
This section provides the analysis of results and discussion for various experiments involved in vibration measurement. Initially, the experimental set up of vibration signal analysis is discussed and then comparative analysis of vibration signal frequency domain is presented followed by the analysis of pattern recognition of vibration signals.
5.1. Experimental Set-up vibration signal analysis
The experimental set up done for the analysis of vibration signal is depicted in Fig. 3.
Fig. 3Experimental set-up for vibration signal analysis using MZ interference
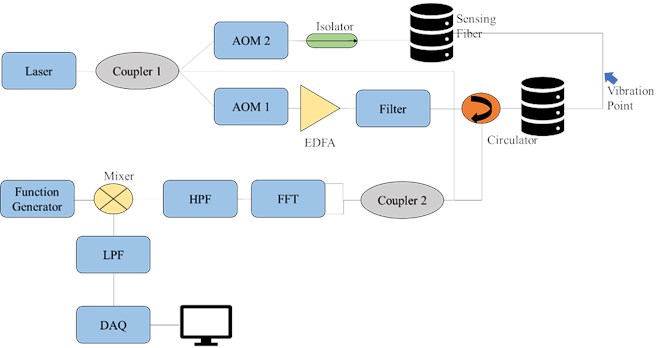
This set up uses two AOM (acousto-optic modulator) for the generation of a narrow and wide band pulses at both the ends of the sensing optical fiber. These signal pulses generated have certain time difference. The narrow band pulse is generated using the combination of low pass and high pass filter (LPF and HPF) which is further subjected to FFT. The data acquisition (DAQ) block is responsible for showing the acquired data on the computer system. The wide pulse interferes with the reference light as an MZ interference in order to attain the frequency response. The time domain modulation strategy is adopted to improve the signal intensity and the highest detectable frequency is increased.
5.2. Comparison of vibration signal frequency domain analysis
After the signal undergoes fast Fourier transform, the distribution of the signal in the frequency domain and the phase and amplitude characteristics of the signal at each frequency point can be obtained. In this paper, five different signals, including noise and knock, were tested at a sampling frequency of 200 kHz. Impact, impact, chainsaw cutting, and wind signal. The original time-domain waveforms of the five signals and the amplitude of the signal at each frequency point after FFT calculation were analyzed and compared in MATLAB, which confirmed that the optical fiber vibration monitoring system can be performed by FFT Frequency domain feature extraction. Due to the symmetry of the FFT results, only the first half of the spectrum results are analyzed here, making the spectral features more intuitive to observe [34, 35].
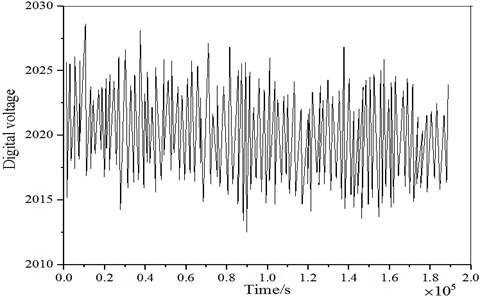
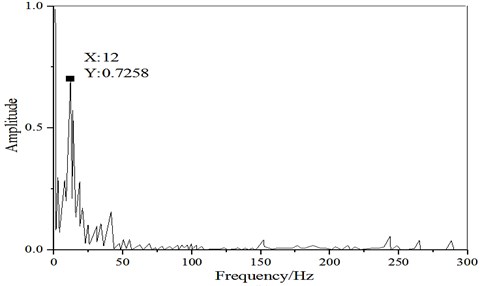
First, the noise signal is detected in the acquired signal. The noise signal is caused by environmental noise and system noise, and it cannot be avoided. Fig. 4 shows the original signal waveform and Fourier transform spectrum of the noise signal. Observing the collected original signal, you can see that the amplitude of the fluctuation is very small, and there is no obvious change in the waveform. From the FFT spectrum results, it can be observed that the amplitude of the noise signal is less than 0.8 except for the 0 Hz DC component. The maximum amplitude is 0.7258 at 12 Hz.
Fig. 4a) Noise signal waveform; b) noise signal transformation spectrum
a)
b)
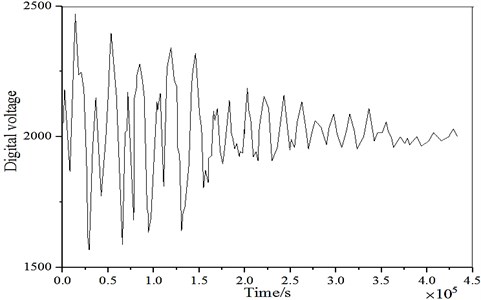
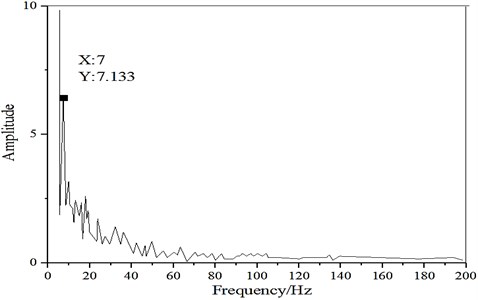
Fig. 5 is the original signal and FFT spectrum of the system in the windy state. When the system is in the windy state, the signal will produce a series of fluctuations. Although the amplitude of the vibration is larger than the noise signal, the overall amplitude of the fluctuation is still relatively small. When the interference received by the system is large, a relatively large peak will appear.
The process of wind blowing is relatively slow, so it can be seen in the waveform diagram that the rise from the low level to the peak is a slow change process. From the FFT spectrum result, it can be observed that the frequency of the wind signal is basically distributed between 1-50 Hz, without high-frequency components, and the amplitude is distributed below 8 except for the 0 Hz DC component, and the maximum amplitude reaches 7.133 at 7 Hz.
Fig. 5a) Windy signal waveform; b) windy signal conversion spectrum
a)
b)
In addition to collecting and analyzing the environmental noise signal and the wind signal, this article also analyzes the signal during the intrusion state, which includes three modes of knocking, violent impact and chainsaw cutting optical cable. Because the intrusion signal is a relatively fast Process, so the rate of tapping impact, and chainsaw cutting signal jumps is faster than the environmental signal, the amplitude of the fluctuation is much larger, and the amplitude of the FFT spectrum becomes significantly larger.
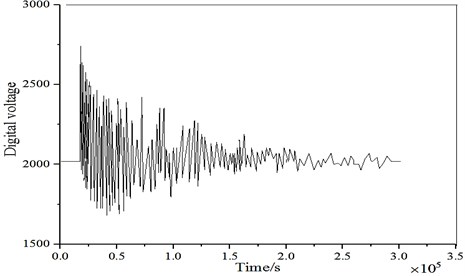
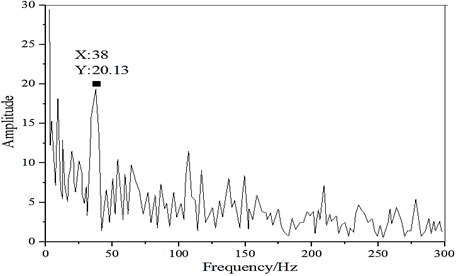
Figs. 6 and 7 are the original signal and FFT spectrum of the system under the knocking state and the violent impact state. When there is a knocking behavior, the system will suddenly produce a violent fluctuation with a large fluctuation amplitude. From the FFT spectrum results, it can be observed that the frequency of the knock signal is mainly concentrated between 1-210 Hz, and the amplitude can reach a maximum of 20.13 at 38 Hz.
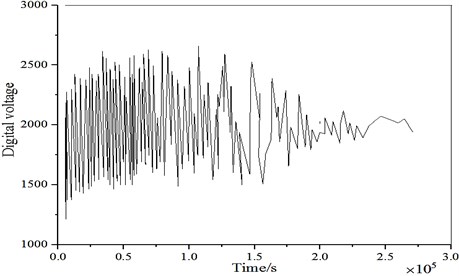
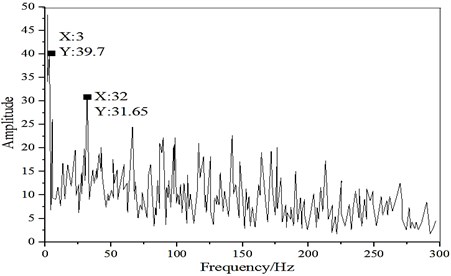
The trend of severe impact is similar to that of the knock signal, but the fluctuation is more intense and the degree of change is more obvious. After the impact behavior will cause a series of vibrations in the optical cable, it can be observed from the FFT spectrum results that the severe impact signal has the largest amplitude at 3 Hz It can reach 39.7, which is larger than the knock signal, and the frequency is mainly concentrated between 1-260 Hz.
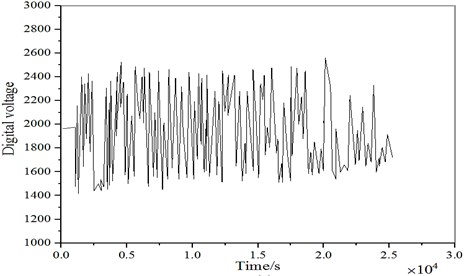
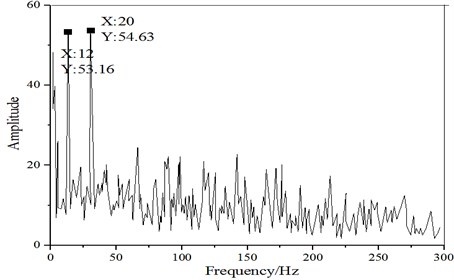
Fig. 8 shows the original signal and FFT spectrum of the system in the state of electric saw cutting. The original signal fluctuates sharply. The frequency of the violent impact signal is mainly concentrated between 1-180 Hz, and the amplitude becomes significantly larger, and the maximum can reach 54.63 at 20 Hz.
Fig. 6a) Tapping signal waveform; b) tapping signal transform spectrum
a)
b)
Fig. 7a) Impact signal waveform; b) impact signal conversion spectrum
a)
b)
Fig. 8a) Chainsaw cutting signal waveform; b) chainsaw signal conversion spectrum
a)
b)
After comparing the FFT spectrum of the five signals of noise, wind, knock, impact and chainsaw cutting, the characteristics of different types of signals are very different, and the characteristics of the same type of signals are similar.
The frequency characteristics of the five signals are compared and summarized in Table 1. It can be observed that different signals have obvious differences in the frequency concentration distribution range and the frequency corresponding to the maximum amplitude and the maximum amplitude. Therefore, the frequency domain features of the signal can be extracted by FFT for pattern recognition.
Table 1Comparison of signal frequency domain characteristics
Type of signal | Frequency range | Maximum amplitude response frequency | Maximum amplitude |
Noise | 1-20 Hz | 12 Hz | 0.7258 |
Wind blowing | 1-50 Hz | 7 Hz | 7.133 |
Percussion | 1-210 Hz | 38 Hz | 20.13 |
Severe impact | 1-260 Hz | 3 Hz | 39.7 |
Saw cutting | 1-180 Hz | 20 Hz | 54 |
5.3. Pattern recognition analysis of vibration signals
After collecting the signal output from the optical fiber sensor and performing feature extraction on the FFT spectrum after signal processing, it is also necessary to perform feature training on it and identify and classify it, so as to effectively determine whether it is an intrusive behavior and ensure the accuracy of the system. Common pattern classification Algorithms include neural network algorithm, K-means algorithm, Bayesian classifier’ SVM classification, etc. Any kind of algorithm, the accuracy is high, the training is difficult, and the time required for operation will increase, so when designing a pattern recognition algorithm. It is necessary to comprehensively examine the factors of accuracy and time, and select the appropriate algorithm. The development of neural network algorithms is relatively mature.
5.3.1. Artificial neural network architecture
In practical engineering applications, backpropagation neural networks occupy an important position in pattern recognition, data fitting, and function approximation. Adaptive and self-learning characteristics. Therefore, this paper chooses BP neural network as the algorithm of fiber vibration signal pattern recognition to meet the requirements of low false alarm rate and stability of the system. Artificial Neural Network (ANN) involves three basic layers: input layer, hidden layer, and the output layer. Input spectral features ( to ) are fed to the network using input layer. The hidden layer is the processing unit which does the weight (, , ) updating to obtain better network performance and the output layer provides the network outcomes. The basic architecture of ANN is presented in Fig. 9.
Fig. 9Basic architecture of ANN
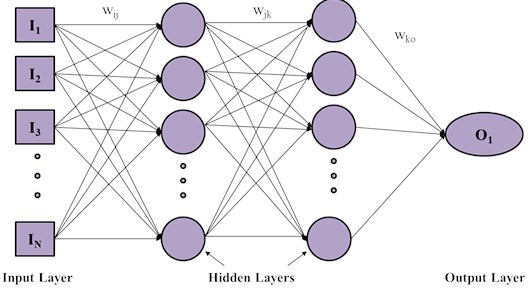
Network performance is determined by the weight updating, propagation function and the learning rule. Let indicates the output of the preceding neuron then input to the thneuron is determined by propagation function expressed in Eq. (11):
where is the propagation function, is the output of the preceding neuron, is the weight and is bias. The neural network parameters are modified by the learning rule such that the favourable network outcome is obtained.
5.3.2. Pattern recognition experiment and result analysis
In the laboratory, due to the limited experimental conditions, only the fan blowing can be used to simulate the windy environment, and three artificial disturbance signals of knocking, violent impact and chainsaw cutting are added to identify and test these four different types of signals.
Collect 500 sets of sensor signals for wind, knock, violent impact and chainsaw cutting respectively for neural network learning and training. After the training, test the type of sensor signals to verify the effect of the neural network algorithm. [1, 0, 0, 0], [0, 1, 0, 0], [0, 0, 1, 0] and [0, 0, 0, 1] represent four signal types, of which [1, 0, 0, 0] means simulated wind signal, [0, 1, 0, 0] means knock signal, [0, 0, 1, 0] means severe impact signal, [0, 0, 0, 1] means electricity Saw cutting signal.
Table 2 shows the statistical results of the classification patterns of the neural network, and the recognition accuracy rate is 7 %. Among them, the false alarm rate of the knock signal is relatively high, because when the striking force is relatively large, the knock signal and the severe impact signal. The frequency domain features are relatively similar and will be judged as a violent impact signal. In order to make the system pattern recognition accuracy higher, the training sample can be appropriately enlarged. In addition to the above signals, more signal types should be trained and carried out. After many tests, the system has been optimized and upgraded to make the recognition results more accurate.
Table 2Pattern recognition results
Type of signal | Number of tests | Number of correctly identified |
Simulated blowing | 81 | 78 |
Percussion | 87 | 82 |
Severe impact | 85 | 83 |
Saw cutting | 82 | 81 |
This section provides a brief introduction to the FFT algorithm, and analyzes and compares the five signal FFT spectrum characteristics of noise, knock, impact, chainsaw cutting and wind in MATLAB. It is observed that the difference in spectrum characteristics of different signals is more obvious, so you can use FFT to extract signal frequency domain features. The extracted features are input into the neural network for pattern recognition. Through experimental testing, the accuracy of the pattern recognition results reaches 96.7 %.
5.3.3. Comparison of the proposed system with the contemporary methods
A comparison is made with the other contemporary algorithms in order to justify the capability of the proposed Optical Fiber Sensing based Vibration Monitoring System using the combination of MZ interference, FFT and ANN for vibration analysis and it is depicted in Fig. 10.
Fig. 10Accuracy comparison of different vibration system analysis approaches
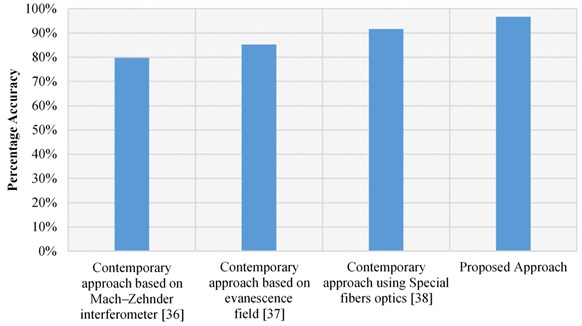
It is revealed from this work, that the better results can be obtained for ANN based proposed approach for optical fiber sensing-based vibration monitoring. The neural network using the systematically trained labelled data from MZ interference and FFT, provides the best reliable outcomes comparative to its other counterpart.
6. Conclusions
This work presents a fiber-optic sensor vibration detection system based on the principle of Mech-eZhnder (MZ) interference. It introduces the testing principle, various components and related software of the all-fiber sensor detection system, and carries out system reliability experiments. The data acquisition was carried out utilizing a special data acquisition and processing software, however, forced vibration detection and freedom are carried out on the steel cantilever structure pasted with fiber optic sensors. The results show that it is reliable and feasible to apply the system to detect strain and vibration of structural parts. The proposed detection system has the following advantages: (1) high sensitivity (2) small size and light weight (3) no interference from electromagnetic fields, no heat, sparks, electromagnetic fields (4) small information loss, remote monitoring (5) corrosion resistance. It has a long service life and can be buried in the structure for long-term online monitoring. The optical fiber sensor is reliable and highly sensitive for the vibration measurement of structural parts, and it has a wide application prospect in the field of vibration detection. The presented system provides a new approach for real-time structure vibration monitoring with pattern recognition accuracy of 96.7 %, thus, providing the future perspective for the research of intelligent buildings. The future scope of this work will focus on the small vibration measurement and control that yields high sensitivity and accuracy in vibration location estimation.
References
-
Stratikopoulos A., Kotselidis C., Goodacre J., Luján M. FastPath: towards wire-speed NVMe SSDs. 28th International Conference on Field Programmable Logic and Applications (FPL), 2018.
-
Linessio R. P., Dos Santos Tavares L. H., Da Silva T., De Oliveira V., Bavastri C. A., Da Costa Antunes P. F., Da Silva J. C. C. Biaxial optical accelerometer based on ultra-high numerical aperture fiber. IEEE Sensors Journal, Vol. 19, Issue 10, 2019, p. 3690-3697.
-
Lequime M. Fiber sensors for industrial applications. Optical Fiber Sensors, 1997.
-
Medlock R. Fibre optics in process control. Control and Instrumentation, Vol. 21, 1989, p. 105.
-
Demjanenko V., Valtin R. A., Soumekh M., Naidu H., Antur A., Hess D. P., Wright S. E. A noninvasive diagnostic instrument for power circuit breakers. IEEE Transactions on Power Delivery, Vol. 7, Issue 2, 1992, p. 656-663.
-
Sharma A., Singh P. K., Sharma A., Kumar R. An efficient architecture for the accurate detection and monitoring of an event through the sky. Computer Communications, Vol. 148, 2019, p. 115-128.
-
Rathee G., Sharma A., Kumar R., Iqbal R. A secure communicating things network framework for industrial IoT using blockchain technology. Ad Hoc Networks, Vol. 94, 2019, p. 101933.
-
Dakin J., Culshaw B. Fiber Sensors: Principals and Components. Vol. 1. Artech, Boston, Mass, USA, 1988.
-
Culshaw B., Dakin J. Optical Fiber Sensors: Volume Two: Systems and Applications. Artech House, 1989.
-
Giallorenzi T. G., Bucaro J. A., Dandridge A., Sigel G. H., Cole J. H., Rashleigh S. C., Priest R. G. Optical fiber sensor technology. IEEE Transactions on Microwave Theory and Techniques, Vol. 30, Issue 4, 1982, p. 472-511.
-
Krohn D. A. Fiber Optic Sensors-Fundamentals and Applications. Instrument Society of America, Research Triangle Park, NC, 1988.
-
Lagakos N., Litovitz T., Macedo P., Mohr R., Meister R. Multimode optical fiber displacement sensor. Applied Optics, Vol. 20, Issue 2, 1981, p. 167-168.
-
Gangopadhyay T. K. Prospects for fibre bragg gratings and fabry-perot interferometers in fibre-optic vibration sensing. Sensors and Actuators A: Physical, Vol. 113, Issue 1, 2004, p. 20-38.
-
Binghui J., Yong F. An optical fiber measurement system design on tool radial vibration. Vibroengineering Procedia, Vol. 14, 2017, p. 18-22.
-
Poongodi M., Hamdi M., Sharma A., Ma M., Singh P. K. DDoS detection mechanism using trust-based evaluation system in VANET. IEEE Access, Vol. 7, 2019, p. 183532-183544.
-
Sharma A., Kumar R. Computation of the reliable and quickest data path for healthcare services by using service-level agreements and energy constraints. Arabian Journal for Science and Engineering, Vol. 44, Issue 11, 2019, p. 9087-9104.
-
Marr K. D., Morrow W. H., Brown C. M., Englert C. R., Harlander J. M., Cerrato A., Harris S. E. Calibration lamp design, characterization, and implementation for the Michelson interferometer for global high-resolution thermospheric imaging instrument on the ionospheric connection satellite. Optical Engineering, Vol. 58, Issue 5, 2019, p. 054104.
-
Wu H., Guo Y., Xiong L., Liu W., Li G., Zhou X. Optical fiber-based sensing, measuring, and implementation methods for slope deformation monitoring: a review. IEEE Sensors Journal, Vol. 19, Issue 8, 2019, p. 2786-2800.
-
Zhang J., Meng F., Qiao L., Zhu K. Design and implementation of optical fiber SSD exploiting FPGA accelerated NVMe. IEEE Access, Vol. 7, 2019, p. 152944-152952.
-
Yao Xiaofeng, Jia Xi Design and implementation of lng gas station monitoring system based on shcan fieldbus. Electronic Measurement Technology, Vol. 42, Issue 10, 2019, p. 115-119.
-
Da Costa Antunes P. F., Lima H. F., Alberto N. J., Rodrigues H., Pinto P. M., De Lemos Pinto J., De Brito André P. S. Optical fiber accelerometer system for structural dynamic monitoring. IEEE Sensors Journal, Vol. 9, Issue 11, 2009, p. 1347-1354.
-
Weng Y., Qiao X., Feng Z., Hu M., Zhang J., Yang Y. Compact FBG diaphragm accelerometer based on L-shaped rigid cantilever beam. Chinese Optics Letters, Vol. 9, Issue 10, 2011, p. 100604.
-
Liu Q. P., Qiao X. G., Zhao J. L., Jia Z. A., Gao H., Shao M. Novel fiber Bragg grating accelerometer based on diaphragm. IEEE Sensors Journal, Vol. 12, Issue 10, 2012, p. 3000-3004.
-
Taiwo A., Seyedzadeh S., Taiwo S., Sahbudin R. K. Z., Yaacob M. H., Mokhtar M. Performance and comparison of fiber vibration sensing using SAC-OCDMA with direct decoding techniques. Optik, Vol. 125, Issue 17, 2014, p. 4803-4806.
-
Taiwo A., Taiwo S., Sahbudin R. K. Z., Yaacob M. H., Mokhtar M. Fiber vibration sensor multiplexing techniques for quasi-distributed sensing. Optics and Laser Technology, Vol. 64, 2014, p. 34-40.
-
Xie S., Zhang M., Li Y., Liao Y. The influence of fiber inhomogeneity on the positioning accuracy of distributed fiber vibration sensor. In Advanced Sensor Systems and Applications. International Society for Optics and Photonics, Vol. 8561, 2012, p. 85610O.
-
Tu D., Xie S., Jiang Z., Zhang M. Ultra long distance distributed fiber-optic system for intrusion detection. Advanced Sensor Systems and Applications V, Vol. 8561, 2012, p. 85611W.
-
Rao Y. J., Luo J., Ran Z. L., Yue J. F., Luo X. D., Zhou Z. Long-distance fiber-optic Φ-OTDR intrusion sensing system. In 20th international conference on optical fibre sensors. 20th International Conference on Optical Fibre Sensors, 2009.
-
Udd E. A personal tour of the fiber optic Sagnac interferometer. Fiber Optic Sensors and Applications VI, Vol. 7316, 2009, p. 73160R.
-
Chen Q., Jin C., Bao Y., Li Z., Li J., Lu C., Li G. A distributed fiber vibration sensor utilizing dispersion induced walk-off effect in a unidirectional Mach-Zehnder interferometer. Optics express, Vol. 22, Issue 3, 2014, p. 2167-2173.
-
Qu K., Gong T., Shao J. Design and implementation of system generator based on rule engine. Procedia Computer Science, Vol. 166, 2020, p. 517-522.
-
Huang W., Xiao X., Xu M. Design and implementation of domain-specific cognitive system based on question similarity algorithm. Cognitive Systems Research, Vol. 57, 2019, p. 20-24.
-
Zhou C., Tong X., Mao Y., Xiong Q., Fang D., Pan X. Study on a high-temperature optical fiber F-P acceleration sensing system based on MEMS. Optics and Lasers in Engineering, Vol. 120, 2019, p. 95-100.
-
Cheng L., Li M., Li Y., Yang J. Quasi-distributed optical fiber sensing system to monitor the displacement of joints on the face slab of concrete-faced rockfill dams. Optical Engineering, Vol. 58, Issue 1, 2019, p. 016107.
-
Chang C., Hsu P. J., Lin Y. S., Wu Y. S., Chen P. L., Lin X. F., Yen C. E. Design and implementation of an internet-of-things roadside parking system based on raspberry PI 3 and bluetooth low energy mesh sensor network. Sensors and Materials, Vol. 31, Issue 2, 2019, p. 365-376.
-
Kim T. Y., Kim J. E., Suh K. S. On-line monitoring of transformer oil degradation based on fiber optic sensors. Sensors and Materials, Vol. 20, Issue 5, 2008, p. 201-209.
-
Rao T. V., Chakravarthy V. V. S. S. S., Murthy K. K. Working model of optical fiber sensor for estimation of sludge in oil in electrical transformer. Indian Journal of Pure and Applied Physics, Vol. 49, Issue 9, 2011, p. 596-599.
-
Liu Y., Jiang S., Fan X., Tian Y. Effects of degraded optical fiber sheaths on thermal aging characteristics of transformer oil. Applied Sciences, Vol. 8, Issue 8, 2018, p. 1401.
Cited by
About this article

The National Natural Science Foundation of China: Circuit Model and Algorithm for Geomagnetic Storm Infringement of High-speed rail Electrical System (41374189).
The Fundamental Research Funds for the Central Universities: Research on Indoor Positioning System Based on LED Visible Light Communication (2009MS005).
