Abstract
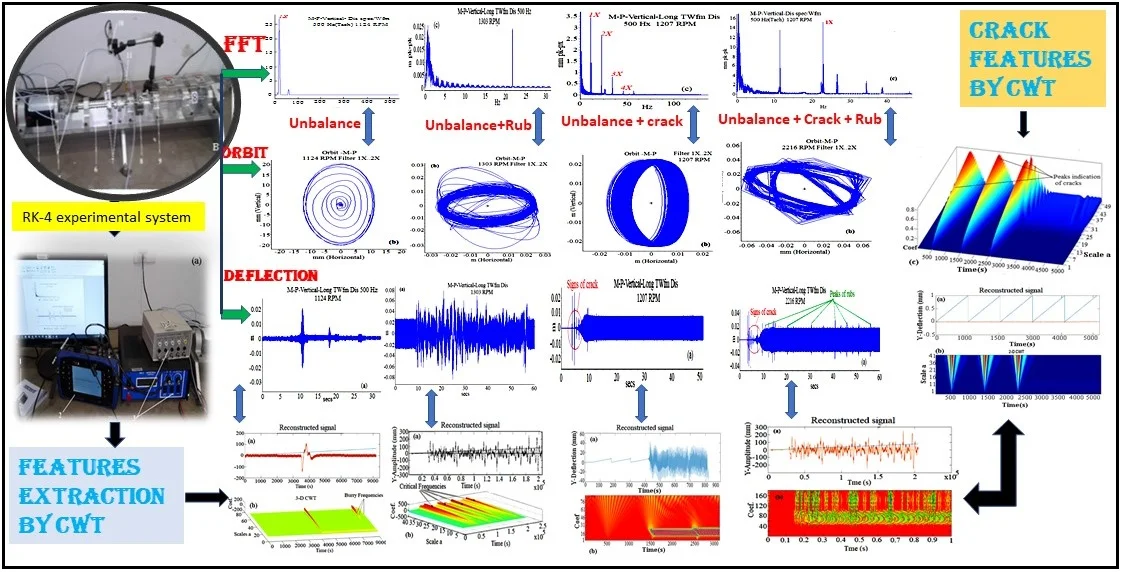
This paper presents the recent application of the scalogram of Continuous Wavelet Transform (CWT) as a vibration monitoring and signal processing tool for a rotor dynamic response under parametric excitation. The experimental test data of coupled lateral-torsional vibrations of a rotor-stator system with transverse crack was obtained through a data acquisition set-up interfaced with Rotor-Kit-4 (RK-4). Analysis was executed on rotor deflection, orbit, frequency and time-frequency spectrum of the RK-4 experimental data. The scalograms of CWT were used experimentally to represent the aperiodic occurrence of rub between the rotor-stator and crack features. Variation in 3-D scalogram peaks in the presence of rub and crack were unique and were used to distinguish quasi-periodic motion from other types of motion. An unbalanced cracked rotor gave a higher frequency amplitude response compared to an unbalanced rotor with rub under the same conditions. Irregularities in orbit orientation near sub-harmonic resonances were observed in the test data. Multiple rebounds inside the orbit loop were unique rub indicators. Conspicuous horizontal components of the higher harmonics were observed near the critical speed when a crack existed. CWT established inherent feature patterns that discriminated unbalance, rub and a crack.
Highlights
- Experimental faults diagnosis of rotor-kit 4 under unbalance, a crack and rub-impact parametric excitation.
- FFT indicated the higher frequency amplitude, irregularity in orbit, conspicuous deflection at a critical speed.
- 3D Scalogram of CWT exhibited the predominance of crack features in faulted rotor system.
- 3D Scalogram of CWT established inherent feature patterns that discriminated unbalance, rub and a crack.
- CWT experimentally revealed to be an effective tool to distinguish features between the coexisting faults.
1. Introduction
Discretisation of multiple faults in rotating machinery is a common problem in signal analysis. Rotors are often subjected to multiple faults, which lead to a gradual deterioration of the rotating components of the system. In order to limit maintenance costs and optimise the equipment efficiency, it is crucial to implement an effective and reliable fault diagnosis tool for the rotating machinery. Feature extraction is key to fault diagnosis and the technique used is expected to have good ability to indicate the presence of faults [1]. Several researchers have conducted the study of vibration of a rotor system carrying multiple faults. However, due to the strong nonlinearities and disturbance that occurs in the rotor operating in a harsh environment, it is difficult for effective diagnosis to extract features of unique faults once they coexist in a system. Multiple faults such as rub, and crack are potential causes of failures and the disrupted performance of the rotating machinery. The high vibration amplitude of the mixed nonlinear faults at the critical speed may mask features of discretising fault symptoms. Thus, it is imperative to diagnose and discretise the nonlinear features of the unbalance, rub and crack interaction in rotating systems. In this regard, several researchers have investigated the application of sophisticated techniques in order to extract the specific multiple fault features of transient signals [2-5].
Recently, research work mostly considers theoretical studies of multiple fault analysis in rotating system involving unbalance and other faults [6-9]. Zhou et al. [10] used an acceleration scheme to reduce shocks in a horizontal rotor and to detect a crack. Few studies on theoretical and experimental discretisation of multiple faults have been published. Patel and Darpe [11] numerically and experimentally investigated rotor vibration characteristics of unbalance, crack and rotor-stator rub faults using both classical Jeffcott rotor model and Timoshenko beam element. Despite the abovementioned faults that are partially identifiable using classical methods such as fast Fourier transform (FFT), fault signals in rotors are not often periodic or quasi-periodic in time and regularly give rise to various resonant frequencies for the same set of data (nonlinearity) [13-15]. Discretisation techniques and numerical simulation of rotor faults have shifted from classical FFT to new time-frequency analysis algorithms, where the analysis of the behaviour of a system is based on nonlinearity and non-stationary considerations. Therefore, a significant effort is devoted to research on time-frequency analysis based on fault diagnosis methods. Vibration analysis techniques, such as the wavelet transform (WT) [12-15] have been employed to analyse the rotor vibration signals.
Various WT have been used for multiple fault analysis of nonlinear rotor systems. Using local mean decomposition-based time-frequency representation. Jiao et al. [13] theoretically studied the vibration response of the rotor system in the presence of multiple rotor faults such as unbalance, crack and rotor-stator rub. Their study revealed that rub and uncracked rotor excites higher frequency components with almost equal periodic modes. In other studies [14-16], the authors used WT to detect a partial rub and crack. This non-stationary technique has been successfully used to simulate various faults and to perform damage localisation. Additionally, practical applications and experimental studies on the detection of unbalance, rub and crack in rotors by WT have been reported [14, 15].
Sinou [14] experimentally investigated the possibility of detecting an open crack on a rotor at low and high acceleration. In his studies, the transient signals of a notched rotor by both FFT and CWT were considered. The work revealed that the difficulties in identifying non-stationary vibration signals of the rotor with an open transverse crack at high acceleration could significantly be overcome by use of time-frequency spectral analysis.
Based on the model-based diagnostic approaches, Bachschmid and Pennacchi [17] studied numerically and experimentally the identification of multiple faults on the rotor system. The identification of multiple faults was made by a least-squares fitting approach in the frequency domain by means of the minimisation of a multi-dimensional residual between the vibrations in some measuring planes on the machine and the calculated vibrations due to the acting faults. Pennacchi and Vania [18] developed some techniques to measure with accuracy the results obtained with model-based diagnostic techniques with the aim of identifying faults in rotating machines. The results obtained by means of the experimental data collected in a power plant were very useful in detecting lack of accuracy in the model of the fully assembled machine as well as errors in the experimental vibration data. El-Mongy and Younes [19] analysed the vibrational transient response of a cracked rotor in the presence of unbalance and coupling misalignment on the possibility of using the sub-critical start-up response in solving the fault identification problem. Using numerical simulations by finite element modelling and experimental investigations, they carried out investigations for different individual and multi-fault conditions. Their study exhibited a unique feature for each fault that can be extracted and provided useful insights in the interactions between the various fault effects on the vibratory response.
In order to address the aforementioned multiple faults in failure detection, this work focuses on the features extraction of coexisting nonlinear and transient faults, such as unbalance, crack and rotor-stator rub in a high-speed rotor system using the time-domain response in a lateral direction, its orbit and both its FFT spectral and its WT techniques. Experiments were carried out on a RK-4 made by Bently-Nevada to collect vibration data under both healthy and faulty rotor conditions. The experimental data were used to validate the effectiveness of the WT method in features extraction. The principle of breathing crack behaviour is constructed via the aid of crack simulator, incorporated at the mid-span of the rotor. The obtained experimental vibration data sets were processed by FFT and CWT to identify unique features of each fault. This paper is organised as follows: in Section 2, the proposed method based on FFT and WT is introduced, Section 3 describes and demonstrates the experimental tests and results. The conclusions are drawn in Section 4. The basic system layout used is shown in Fig. 1.
2. Numerical method and experimental set-up
2.1. A brief background of continuous wavelet transform (CWT)
In order to describe qualitatively the oscillated feature of nonlinear and transient systems, an algorithm called wavelet transform (WT) technique is explained briefly in this section. WT offers a variable window technology that uses a time adaptive interval to analyse high and low frequency components of a signal.
In this paper, WT offers flexibility to describe experimental test signals that comprise time-variant frequencies.
Given a signal , the associated (CWT) is represented by:
where and are the scale parameter and time translation factor respectively. The term denotes the complex conjugate of , which are the daughter wavelets (i.e. the dilated and shifted versions of the ‘mother’ wavelet , which is continuous in time and frequency). It is worthwhile to note that when perfect reconstruction is required, the selection of the mother wavelet becomes restricted. In general, the function has to be such that:
where is the FFT of for a successful inverse transform, admissibility condition, implying that 0, , has to be fulfilled. Once meets this condition, can be adopted as a weighting function to synthesise the original signal from the dilated and translated versions of as follows [8]:
The representation of in terms of CW is redundant because it continuously varies the scaling parameter . The original signal can be completely reconstructed by a sampled version of as in [14]. Among the multiple types of wavelet families developed, the Morlet mother wavelet is quite well localised in time and frequency space and has been adopted in this paper. Morlet mother wavelet is defined in time domain by Eq. (3):
where is the wave number and is non-dimensional time parameter. Eq. (4) indicates the CWT of a signal can work as a band-pass filter with the wavelet function itself and its scale parameter controls the filtering performance.
2.2. Experiment set-up of Bently RK-4 rotor kit
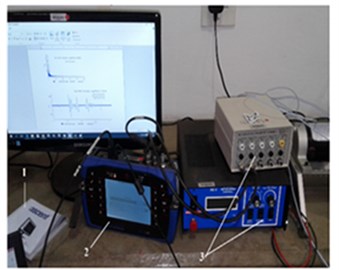
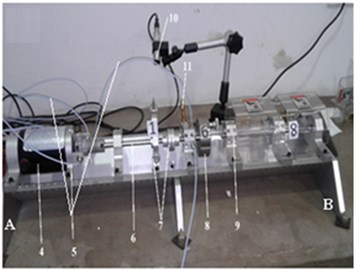
To analyse vibration signals and validate the effectiveness of the applying CWT method, an experiment is conducted on a RK-4 rotor test rig. A large number of tests on faulty and unfaulty rotor systems operating at variable motor speeds have been done. Fig. 1 shows an overall view of the experimental and the signal acquisition system. The rig consists of an elastic steel shaft coupled to a motor speed control and supported by two bearings. The shaft carries one rigid disc at the mid-span. The rotor shaft was supported on two roller bearings at both ends and sustained in position by two fixed steel supports (designated as supports A and B in Fig. 1(b)). Experimental test data were obtained using the RK-4 vibration test rig in healthy and faulty conditions. Two identical and perpendicular proximity probes mounted from the vertical and oriented in two planes perpendicular to the shaft, captured the relative deflection of the shaft.
Fig. 1A photo of the RK-4 experimental system: 1 – ascent; 2 – scout 100; 3 – data acquisition; 4 –motor; 5 – probes; 6 – shaft; 7 – crack simulator; 8 – disc; 9 – shaft support; 10 – tachometer; 11 – screw rub-contact
a)
b)
The rig, which was integrated with a crack simulator, comprised of two radial and orthogonal springs to emulate dynamics of breathing crack. An extra mass and a screw were used in practice to induce unbalance and to understand the nonlinear dynamics of coupling faults of crack and rub-impact in an RK-4 system.
Rub impact was set at a point located by a number 11 (Fig. 1(b)), which consists of a detachable small tight screw at a controlled distance between the rotor and the screw. The proximity probes recorded regular slightest contacts occurring during the rotation of the shaft. Motor speed control was set to ensure that the rotor was driven only in one direction to avoid reversal of the friction forces induced by rub. The Ascent signal amplifier was used in the data acquisition interface system controlled by Ascent via Matlab toolbox. The shaft’s speed was monitored by a laser tachometer that was mounted on the support.
Table 1RK-4 rotor system parameters
Shaft | Value and units | Discs | Value and units |
Length of the rotor () | 570 mm | Mass | 0.845 kg |
Shaft diameter | 10 mm | Eccentricity mass | 0.018 kg |
Outer diameter () | 75 mm | Unbalance eccentricity | 10 mm |
Inner diameter () | 10 mm | Disc thickness | 25 mm |
Density of the material | 7800 kgm-3 | Crack | |
Modulus of elasticity | 211×109 Pa | From the left bearing | 240 mm |
Damping coefficient | 0.8×10⁻⁶ s-1 | Depth | 5 mm |
Bearing stiffness | Motor | ||
Left bearing stiffness | 1.35×10⁵ Nm-1 | Frequency | 500 Hz |
Right bearing stiffness | 1.35×10⁵ Nm-1 | Volt | 415 V |
Rotor speed interval | [900-4500 rpm] | Ampere | Amp |
The signals were recorded in radial direction at various rotating speeds by four proximity probes staggered in the probe block as shown in Fig. 1(b). The sensors were positioned at distances enough to measure rotor shaft vibration in various positions. All the outputs were displayed on an oscilloscope integrated with a filter. A torsional elasticity of the shaft is considered by the assumption that the torque or axial force is applied to twist the rotor torsionally. For all the experiments conducted in this study, a Commtest instrument version 11.6.0 combined with an Ascent 2013 that linked with a data acquisition interface unit was used for data acquisition (Fig. 1(a)). The signals were analysed using Scout 100 and Vibration Assistant software. The acquired data were recorded and then transferred to the computer for digital processing using FFT and CWT. Table 1 gives the physical parameters of the RK-4 rig.
3. Experimental results and discussions
To validate previous work carried out by Tchomeni et al. [9], an experimental study is carried out using the vibration signals collected by RK-4 and the experimental bench is shown in Fig. 1. As shown in the Fig. 1, the motor is used to drive the shaft on which a crack was created at mid-span with a crack depth of 0.55 mm. All tests were carried out with the influence of the centrifugal force created by the unbalance mass. Each test was repeated several times to ensure that the results were replicable. In the second set of experiments, the rotor-stator clearance was set at 1.65×10⁻⁶ m and measurements were taken for the case of excitation force. The radial clearance was set at 1 mm and the vibration signals acquired at a sampling rate of 500 Hz. Vibrations in the axial direction were neglected since they did not provide useful information on rub and crack, thus, the axial direction data are not considered in this work. The motor torque was set to accelerate the rotor to a maximum speed of 5000 rpm. After the data had been acquired, analysis was performed on time deflection, frequency spectrum and orbit patterns. The currently obtained results from the multiple faults analysis have been correlated with the ones obtained in [9].
3.1. Dynamic vibration response of rotor with unbalance and axial force
In this first experiment, the torsional deflections were considered by varying the motor input torque. Subsequently, a joint examination of frequency spectrum, rotor trajectory, orbit patterns and CWT enabled the features of unbalance to be identified from experimental vibration test data. Unbalanced rotor responses at a high speed of up to 10.000 rpm were obtained manually by changing the motor’s speed (Fig. 1). Figs. 2 and 3 illustrate the obtained results.
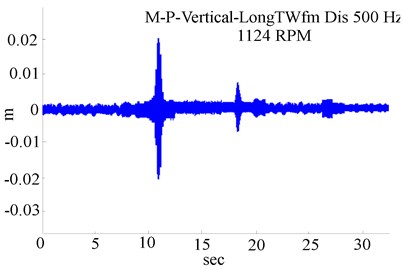
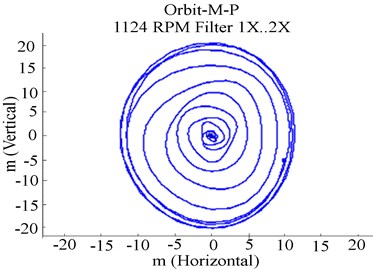
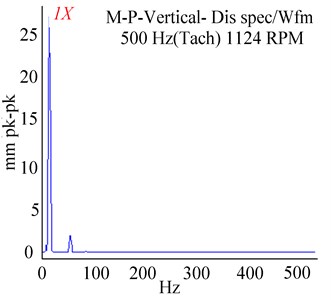
Response to unbalance in the absence of a crack and rub is shown in Figs. 2 and 3. Analysis of the orbit patterns presented in Fig. 2(b) reveals that the unbalance was a source of extra evolutions in the dynamic response, as rotor passed through its critical speed. It was observed in Fig. 2(b) that unbalance induced a regular orbit pattern containing a circular loop. As illustrated in Fig. 2(b), the orbit response initially varied from the start-up to a maximum amplitude 23.3 mm at resonance and ceded to a regular circular closed loop. The orbit amplitude is found to be 2.3×10⁻⁶ m in Fig. 2(b), where the first critical speed range is specifically 1132.27 rpm in Fig. 2(a). In Fig. 2(c), the amplitudes of the experimental frequency data revealed that the order 1X harmonic representing the higher vibration level was attained at 23.46 Hz. A correlation between the results in [9] and experimental results in the current paper can be perceived in deflection shapes, frequencies and orbits.
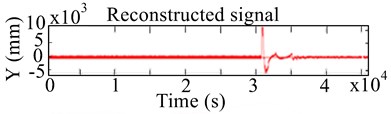
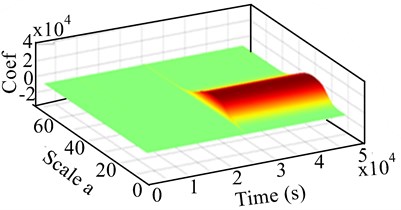
Further experimental investigation on unbalance at low and high speeds of 1150 rpm and 2570 rpm, sampled at 500 Hz was done using CWT. This was done in order to investigate further hidden information from the measured data. The choice of an appropriate wavelet was important for this signal analysis. Daubechies wavelet and the Morlet wavelet were adopted for diagnosis of unbalance. Experimental responses in terms of 2-D and 3-D scalograms are presented in Figs. 3 and 4. In Figs. 3 and 4, the 2-D and 3-D CWT response scalogram of an unbalanced rotor were smooth except at one point. The figure depicts a slight fluctuation and resonance at 3400 s due to eccentric mass elements. In 3-D of Fig. 3(b), at rotor speed of 1124 rpm, the unbalance mass caused excitation that is shown by a high concentration of energy (red colour) after the first resonance.
Fig. 2Start-up response of rotor system with unbalance at 1124 rpm: a) lateral shaft deflection, b) unbalanced orbit response, c) experimental FFT spectrum
a)
b)
c)
Fig. 3Experimental 2-D and 3-D response scalograms by CWT for unbalanced RK-4 at 1124 rpm: a) lateral shaft deflection, b) 3-D CWT of lateral unbalanced rotor
a)
b)
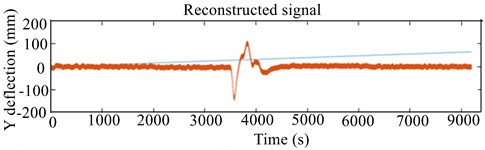
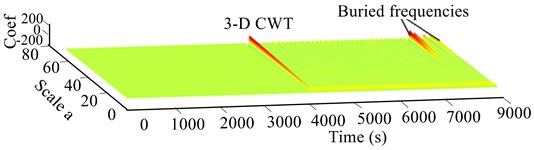
Increasing the rotor speed to 2570 rpm generated a slight change in frequencies as indicated in 3-D of Fig. 4(b). In Fig. 4(b), filtering the frequency range from 80 to 237 Hz revealed the existence of more than one mode (a rather dense red zone), with high precision on the existence of some buried frequencies not visible in the FFT spectrum. Examination of the Fig. 4(b) revealed that numerous small resonance peaks with lowest order frequencies appeared in the 3-D scalogram at varying periods of time. Such peaks were completely indiscernible in the experimental signal in Fig. 2(c). As seen in the CWT in Fig. 4(b), unbalance at a high speed of 2570 rpm caused a significant disturbance in the RK-4 system, which was manifested by numerous small buried frequency peaks.
Analysis confirms that unbalance in the rotor system led to significant energy fluctuations. Thus, it is clear that the fluctuations in rotor system time waveform curves became obvious in CWT and revealed multiple small changes in frequency with respect to the rotor speed. This ascertains that high speed excites high vibration, unbalance and nonlinear forces in the system.
Fig. 4Experimental 2-D and 3-D CWT response scalogram of unbalanced RK-4 at 2570 rpm: a) lateral unbalanced shaft deflection, b) 3-D CWT of lateral deflection of unbalanced rotor
a)
b)
3.2. Experimental vibration response of rotor with unbalance and rotor-stator rub
Evolution of this phenomenon has been investigated in this section following the same process of experimentation as in the previous section. Subsequently, for this purpose, the results of CWT applied to experimental test data of unbalanced rotor with rub are presented and discussed in the following section.
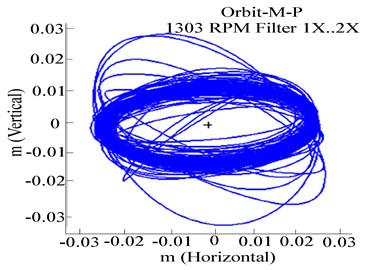
Fig. 5Experimental response of RK-4 at 1303 rpm, with rub-impact: a) Y-deflection, b) orbit patterns, c) frequency response
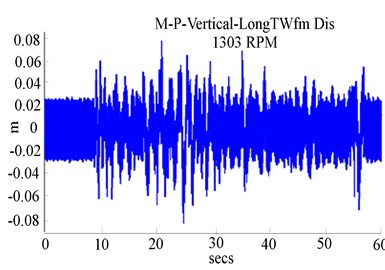
a)
b)
c)
The reduction of clearance generated not only a high rub-impact but also the existence of remarkable disparities in sub-resonances, which exhibits higher amplitudes in the lateral deflection under rub, where the first critical speed is observed at 12 s as illustrated in Fig. 5(a). Experimentally it was noted that rotor-stator rub increased the rotor critical speed. It is clearly shown rub-impact amplitude levels depend significantly on the rotor speed, which increased the rotor critical speed from 1124.43 rpm in Fig. 2(a) to 1300.43 rpm in Fig. 5(a) when the rotor is accelerated.
The experimental orbit patterns in Fig. 5(b) show a complex shape illustrating the multiple rotor-stator rebounds at impact points. A significant distortion in orbits due to rub in the system was obvious. In Fig. 5(b), the inside circular-loop orbit observed for a case of unbalance was significantly modified to an outside elliptic shaped orbit due to rub. The FFT in Fig. 5(c) indicates an increased amplitude of 1X harmonic components representing the higher vibration level as previously observed in Fig. 2(c) and disturbed sub-harmonic peaks. It should be noted that the tightening of 1/2X frequency peaks (sub-harmonics) in Fig. 5(c) was due to the presence of rub. In Fig. 5(c), the main peak coincided with the main rotor frequency at 22.5 Hz. The gap between two consecutive peaks was found to be in the range of 22.5 Hz, which was the unbalanced shaft’s rotational frequency.
By observing the peaks, evolution of energy associated with a fault could be traced. Consistently, it was concluded that the number and the level of the various peaks observed in the FFT depend on the severity of rub-impact. Distinguishing unbalance from rub can be done based on the size of the irregular and disorganised loops, the abrupt change in transient frequency response and the variation in deflection waveform as the rotor traverses the first critical speed. Furthermore, the assigned rub signature has been experimentally used in the CW analysis to obtain the wavelet coefficients and to detect the occurrence of rub. Fig. 6 shows the scalogram of the vibration signals of the unbalanced rotor-stator with rub conditions in time-frequency domains.
Fig. 6Experimental 2-D and 3-D of CWT and scalogram response of the RK-4 with unbalance and rub at 1303 rpm: a) lateral unbalanced shaft deflection with rub, b) corresponding 2-D CWT (c) 3-D CWT scalogram
a)
b)
c)
In 2-D of Figs. 6(b) and 6(c), the values of wavelet coefficients obtained during rotor-stator rub indicate high amplitude peaks when the rotation speed approaches the first critical frequency. The evolution with respect to wavelet coefficients was observed and drawn respectively at particular scales s of 10 and 50. Examining the respective scales, it became apparent that energy due to rotor-stator rub was mainly concentrated around the frequency intervals, 7-13 Hz at 1303 rpm followed by 27-81 Hz at 2216 rpm. The energy dissipated at the highest speed of 2216 rpm was obviously higher than the energy dissipated at 1303 rpm.
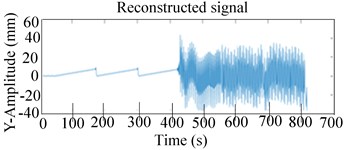
The concentration of energy emitted at the start-up of each signal indicated the existence of various frequency resonances but at different intervals of time as seen in 2-D Fig. 6(b) and 2-D Fig. 7(a). Indeed, in Figs. 6 and 7, when the speed of the shaft varied between the time ranges 2 to 14 seconds, various regularly spaced frequency lines asymmetric with the source frequency appeared in the distribution. In addition, the lines varied nonlinearly with time and were proportional to the shaft rotational frequency with a different proportionality factor from one line to another. At high speed operation, rub imparts an important component in the scalogram response. It was apparent that rub modulated the harmonic peaks at the critical shaft frequencies as shown in 3D CWT Fig. 7(b). The redundant largest peaks of the distribution were attained at 500 Hz (second harmonic of the maximum rotational frequency) observed at the end of the acceleration phase (after approximately 5000 seconds). This revealed that the observed phenomenon is strongly modulated by the rotor speed and that the signal is aperiodic. However, from the difference in the spectrum in Figs. 6 and 7, it was possible to identify the defect manifested by the signal.
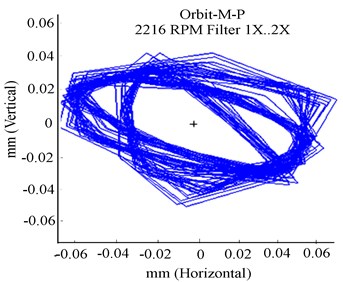
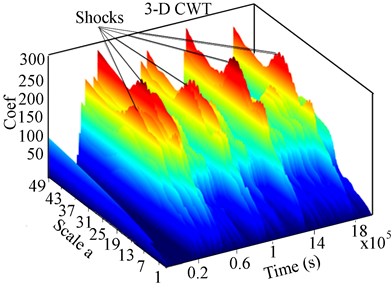
Fig. 7Experimental 2-D and 3-D CWT response of the RK-4 with unbalance and rub at 2216 rpm: a) lateral shaft deflection, b) corresponding 2-D CWT (c) 3-D CWT scalogram
a)
b)
In 3-D of Fig. 7(b), continuous bright fringes indicative of rub as a primary source of excitation in the vibrating system were evident. The scalogram produced at the rotational speed of 2216 rpm in 3-D of Fig. 7(b) was rich in peaks of relatively high amplitudes. These peaks, which are due to contact and unbalance, were observed in the scalogram, probably because of the high rotational speed (2216 rpm). The first harmonic occurring at 5000 s could not be easily discerned due to recurrent rub-impact in 3-D of Fig. 7(b). Rub was noted before and after the first resonance by tracing the number of resonance peaks in FFT, in Fig. 5(c) and CWT in 3-D of Fig. 7(b). The 3-D scalograms were illustratively conspicuous; they were adopted to indicate the number of shocks in the sampled signal. The scalogram in 3-D of Fig. 7(c) indicated that the peaks due to rub varied in magnitude and manifested a series of periodic shocks. The results in Figs. 6 and 7 suggest that the degree of rub can effectively be diagnosed with respect to the speed and the rub impact frequency. Therefore, time and scale coefficients of faults in Figs. 6 and 7 were localised based on time-frequency analysis and energy distribution in the 3-D scalogram of the CWT.
3.3. Dynamic vibration response of rotor excited by unbalance and a crack
For the coexisting multi-faults case (i.e., unbalance, crack), performance of the CWT method in faulted signal extraction is experimented for flexible RK-4 shafts. The performed investigations through the orbit, shaft’s deflection and the frequency spectrum are presented in Fig. 8 and further processed by CWT in 2-D and 3-D as shown in Figs. 9 and 10 for more wide analysis.
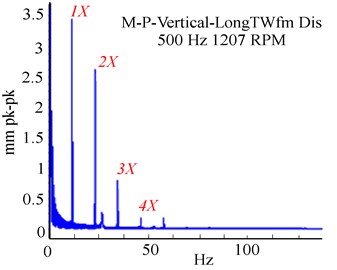
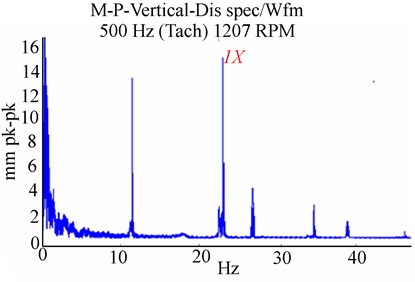
Fig. 8Experimental RK-4 response at 1207 rpm, with unbalance and a crack (ΔKξ/KYY= 0.55): a) Y-deflection, b) experimental orbit, c) frequency response
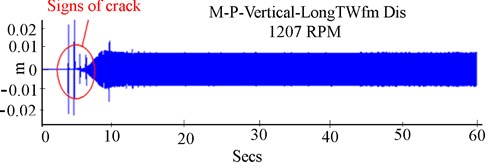
a)
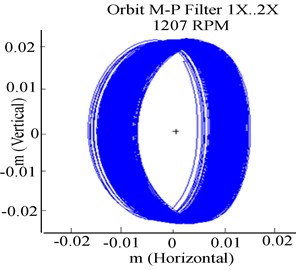
b)
c)
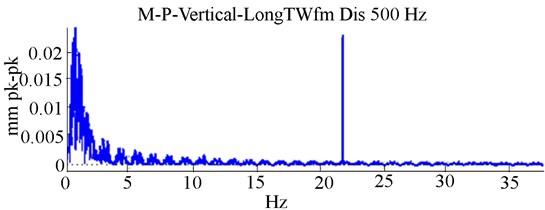
From the deflection in Fig. 8(a), some irregular and imprecise fluctuation peaks exist in the extracted lateral deflection. The crack features were manifested by small tight peaks at the rotor start-up, unlike the observations in the previous analysis (Fig. 2(a) and 5(a)). In Fig. 8(b), the presence of a crack presented strong tightening loops. A qualitative difference in this case compared to the orbit obtained in Fig. 2(b) is already apparent. In Fig. 8(c), a high vibrational level was attained by order 1X harmonic at 23.46 Hz. At this point, the crack generated a tremendous increase in vibration amplitudes, characterised by the 2X and 3X super harmonic peaks.
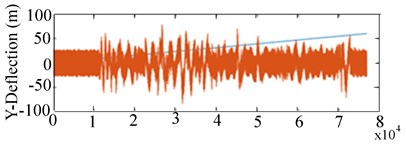
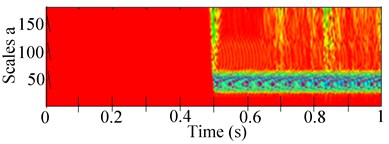
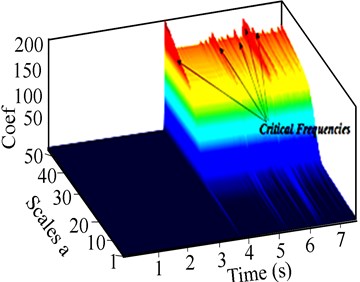
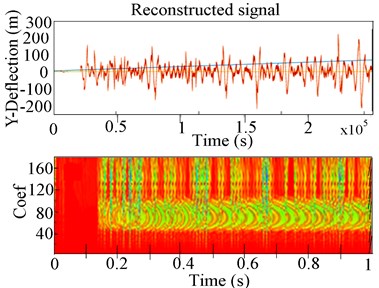
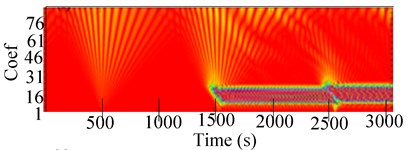
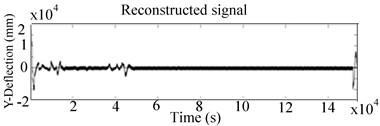
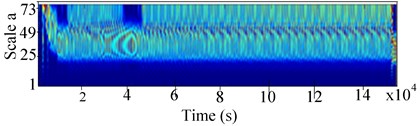
A better resolution was then found to extract features from the multi-faulted data by CWT at a translational frequency of 40 Hz and implemented in Fig. 9 and Fig. 10. In 3-D of CWT shown in Fig. 9(c), a series of peaks, three eigenmodes appeared clearly (respective values 500, 1500 and 2500 s). The peaks of frequencies are excited by breathing of the cracks; an accumulated energy distribution of these peaks can be observed from the higher spectral in Fig. 9(c). The order of the frequency appearance revealed the periodic opening and closing of the crack to be 1000 s as illustrated in Figs. 9(a), (b) and 10(c). The period increased as a function of the scale coefficients when the rotor speed increased to 2216 rpm.
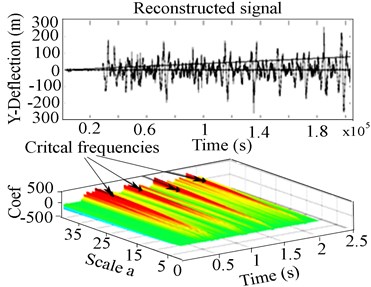
The time taken to pass through the critical and sub-critical speeds being more at a low speed of 1207 rpm, the sub-harmonic resonant peaks were clearly seen in the CWT scalogram Fig. 9(a). The higher peak indicators of a crack effect disappear once the rotor recovers its stability as observed in Fig. 9(c). However, as the RK-4 rotor speed increased as shown in Fig. 10(a) and 10 (b), the sub-harmonic peaks in time-response became hidden and considerable features of the crack could only be manifested in the CWT scalogram by accumulated energy distribution observed from the marginal spectral as revealed in Fig. 10.
In Fig. 10, the experimental test data at a high speed depicted the 1X critical speed at 500 s, characterising the effect of unbalance. It can be seen in Fig. 10(a) that the peaks appearance shows regular and precise variations of amplitude in the multi-faulted data, excited by the coexisting unbalance and crack faults. The main harmonic resonant peak was observed in Fig. 10(a), which became conspicuous in the 3-D CWT scalogram in Fig. 10(b). Increasing the speed to 2216 rpm intensified the system vibration, generating the second and third critical speeds (at 1500 s and 2500 s) as illustrated in the 3-D of CWT scalogram in Fig. 10(c).
Fig. 9Experimental 2-D CWT and 3-D scalogram of unbalanced RK-4 with transverse crack at 1207 rpm: a) Y-Lateral deflection, b) 2-D CWT of unbalanced rotor with a crack, c) 3-D CWT scalogram of rotor with a crack
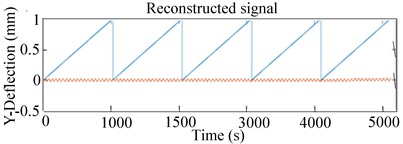
a)
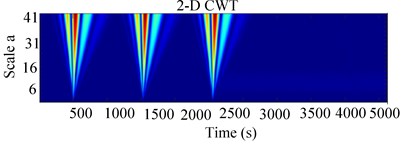
b)
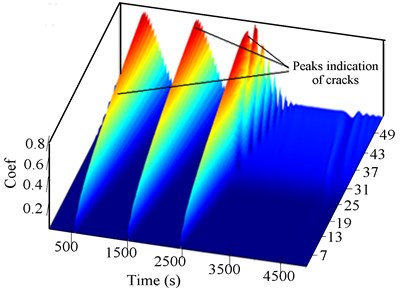
c)
Fig. 10Experimental 2-D CWT and 3-D scalogram of the unbalanced RK-4 with a crack at 2216 rpm: a) Y-Lateral deflection, b) 2-D CWT of rotor with crack, c) 3-D CWT scalogram
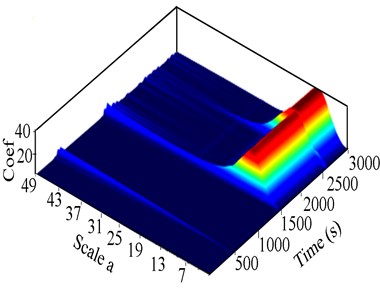
The latter observation was attributed to the effects of the crack as illustrated in Fig. 10(c). Two marginal spectral distributions by 3-D of CWT in Fig. 10(c) also show accumulated effect of energy of various frequencies different to that observed in Fig. 9(c). The CWT was sufficiently sensitive to local changes in the signal and revealed little changes in the response compared to the FFT. This analysis confirmed the effectiveness of CWT as a diagnostic tool for rotor cracks at a high rotation speed.
3.4. Dynamic vibration response of rotor excited by unbalance rotor-stator rub and a crack
In this section, rotors operate under tight rotor-stator clearances with a weak stiffness, which can become progressively worse if they are not well detected. For the coexisting faults case (i.e., unbalance, rotor-stator rub and crack), the time-domain response in lateral deflection, orbits and its FFT spectral are shown in this section. Consequently, the system was accelerated to a higher speed of 2216 rpm and the response near the rotor critical speed analysed using CWT. Evolutions of multiple faults phenomena at various motor speeds are presented in the Figs. 11 and 12.
Fig. 11Experimental unbalanced RK-4 at higher speed 2216 rpm with rub and a crack Δ= 1.65×10⁻⁶m, ΔKξ/KYY= 0.55: a) Y-deflection, b) orbit response, c) Y-frequency
a)
b)
c)
When crack and rub co-exist, fault detection and monitoring become more complex. In Figs. 11(a) and 11(b), the crack and rub combined generated high vibration as indicated by vertical deflection and orbit patterns. Abnormal movements of the shaft in the bearing can be detected using orbit plots in Fig. 11(b); the X-Y of the orbit exhibit the severity of rub by producing highly random orbit plots. Due to high nonlinearity, the evolution of the orbit patterns and the associated noise peaks became considerably irregular for combined fault and the feature extraction accuracy is not evident.
Similar to the results obtained in [9], the presence of rub increases the rotor critical speed, but subsequently, the crack effect decreased shaft flexibility and decreased the critical speed of the multi-faulted rotor as observed in Fig. 11(a). The harmonic resonances 1X, 2X, 3X and 1/2X were observed in the FFT in Fig. 11(c), where the 1X was excited by unbalance, whereas the 2X, 3X (super-harmonic) occurred due to the crack and the 1/2X were excited by rub. With a maximum limit on frequency at 500 Hz, the RK-4 speed became extremely unstable in the range 1207-2216 rpm. It was not feasible to acquire measurements experimentally within this range. In Fig. 11, the response was characterised by a main peak at the synchronous frequency of 22.5 Hz. In Fig. 11(c) it was noted that for a given crack depth, unbalance excited the 1X sup-harmonic resonance, whereas rub excited the 1/2X and 1/3X sub-harmonic resonance.
Finally, it can be inferred that the emergence of the sub-harmonics, 2X and 3X provides evidence on the existence of a breathing crack and can be easily distinguished near the first critical speed. This inference concurs with the results in [9]. In Fig. 11(c), the amplitudes of the sub-harmonic and sup-harmonic resonance increased due to the interaction of rub, a breathing crack and unbalance at a high speed. The crack and noise induced the sub-harmonics, 2X and 3X in Fig. 11(c), which were of smaller magnitude compared to the 1X harmonic.
The trend in Fig. 11(c) suggests that the harmonics were sensitive to the rotor rotation speed. The results in Fig. 11 indicate that the effect of the crack on the rotor response was considerably larger than that of rub as the amplitude of the latter was largely attenuated in comparison to that of the former. Once again, the experimental results correlated well with the simulated results in [9].
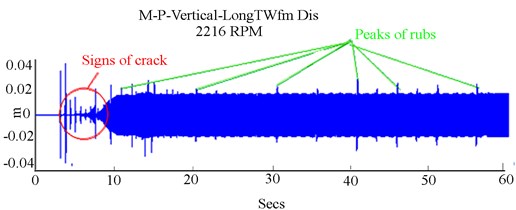
As previously observed in Fig. 7 and Fig. 10, in the presence of rubs and breathing crack, the signal is highly disturbed; these fluctuations affect the accuracy of fault diagnosis. It is difficult to use these features with irregular fluctuations for an effective and accurate mixed faults diagnosis. To overcome this issue, a features extraction method using the vibration signals collected by the dynamic rotor data and processing by CWT is presented in Fig. 12.
Fig. 12 shows the various versions of the system’s response under excitations by eccentric mass, crack and rub. The 2-D scalogram response in Fig. 12(a) exhibits few tight and small peaks harmonic frequencies at the beginning of the recorded signal, followed by multiple high frequency bands and intermittent high energy emission in the CWT, which can be attributed to the recurrent rub-impact and noise effect. This observation corresponds to the rapid change in the system momentum at rub contact and the excitation by the crack. The vibration intensified at the first resonance point, after which the regular impact became more complex, depicting large irregular spots band represented by the coloured stretched noise in 2-D of Fig. 12 (b) at 4028 s.
Fig. 12Experimental 2-D CWT and 3-D scalogram of the unbalance RK-4 rotor with crack and rub at 221 rpm: a) Y-Lateral deflection, b) 2-D CWT response, c) 3-D CWT scalogram
a)
b)
c)
Analysis in 3-D of Fig. 12(c) revealed a disproportionate concentration of energy at resonance, in the 3-D scalogram response. Rotor-stator contact indicated a huge exchange of accumulated effect of energy at various amplitudes. This was indicative of high energy emission (high energy impacts), the yellow-red colour in Fig. 12(c). The 3-D scalogram comprised a large spectrum of ridges, indicative of the recurrent rotor-stator contact. Various frequencies of shocks were detected at regular time ranges, but with distorted amplitudes for various reasons. Singular defects such as contact clearance, unsteady state and the anisotropic nature of the rotor were amongst these reasons. The difference between successive peaks was used to deduce the periodicity of shocks. The presence of peaks related to the second sub-critical speed due the effects of a crack was more evident in the CWT scalogram in Fig. 12(b) than in the time response.
In Fig. 12(b), the peaks were disproportional, indicating that high energy of rotor excitation occurred in the high frequency band. Referring to the 3-D CWT in Fig. 12(c), the effect of crack is indicated by the presence of disproportional ridges within the range of 0 to 3000 s, followed by the features of the rub-impact represented by the high accumulated effect energy at high coefficient (multiple small red crests observed). The scalogram analysis indicated that the centre of the concentrated energy corresponds to the most irregular regions. Analysis of the peaks features (yellow-red) appearance indicated the severity of the vibration. From the nature of the unbalance, rub-impact and crack collected response, the system was in a quasi-periodic motion.
The possible causes of the increase in vibration near the first and the second resonance were the fluctuation of the shaft’s stiffness during rotation and the energy emitted at rub-impact. Based on the above analysis, rub could be distinguished by the aperiodic changes of peaks in the CWT scalogram, whereas, a high variation of energy and frequency in the vicinity of the critical speed in CWT scalogram indicated a breathing crack. A combination of the breathing crack and rub in the system manifested complex evolutions in the CWT of 2-D and 3-D scalogram response of the experimental test data in Fig. 12.
In conjunction with the obtained experimental results, the proposed time-frequency technique for feature extraction can diagnose effectively and accurately unique and mixed faults on a rotor system. Therefore, this study experimentally confirms the validity of the CWT technique for feature extraction in identifying the RK-4 faults near the rotor critical speed.
4. Conclusions
In this paper, the multiple faults detection for rotating shaft utilising a time-frequency method is investigated. An experimental study of coupled lateral-torsional vibrations of a RK-4 system excited by unbalance, rub and a transverse breathing crack force has been presented. FFT and CWT scalograms have been applied to analyse the multiple faults data. By the evolution of orbit patterns, lateral rotor deflection and frequency spectrum, some diagnostics and conclusions were derived. The analysed results show that the significant irregularity in the shaft’s orbits distortion was attributed to the high rub-impact and the stretched circular loops were identified as an indicator of the breathing crack.
The experiment revealed that high rotor speed is the main source of the strong vibration system, which in the presence of the breathing crack and rub, increased the amplitude and the peaks of the frequency resonance. Analysis of the peaks of frequency appearance in 2-D and 3-D wavelet scalogram indicated the severity of the vibration in the vicinity of the critical speed. The fluctuation peaks obtained using CWT first generated multiple aperiodic crests, which can be adopted as a unique indicator of the shocks in the rub-impact and, secondly, huge accumulated energy for flexible shaft’s stiffness during rotor operation. Obtained results show that the unbalanced rotor with rub excites higher frequency components with a quasi-periodic mode, which can be viewed as a complementary, most distinguishable rub indicator.
For coexisting faults such as unbalance, crack and rub in a rotor system, feature extractions were revealed as being complex, using FFT analysis, moreover, the application of CWT was able to distinguish effectively features between the rotor-stator rub and the cracked system. The results indicate that the CWT method offers a vast potential in multiple faults detection. CWT with complete information in the form of time-frequency and accumulated energy revealed the predominance of crack features in multiple faulted rotor system. Experimentation with real vibration signals shows that the vibration signal analysis using the CWT established inherent feature patterns that effectively discriminated the nonstationary nature of mixed unbalance, rotor-stator contact and a crack in a rotor system.
References
-
Li Z., Yan X., Wang X., Peng Z. Detection of gear cracks in a complex gearbox of wind turbines using supervised bounded component analysis of vibration signals collected from multi-channel sensors. Journal of Sound and Vibration, Vol. 371, 2016, p. 406-433.
-
Patel T. H., Darpe A. K. Vibration response of a cracked rotor in presence of rotor-stator rub. Journal of Sound and Vibration, Vol. 317, Issue 3, 2008, p. 841-865.
-
Jiang Q., Suter B. W. Instantaneous frequency estimation based on synchrosqueezing wavelet transform. Signal Processing, Vol. 138, 2017, p. 167-181.
-
Ming L., Fucai L., Beibei J., Huiyu B., Hongguang L., Guang M. Multi-fault diagnosis of rotor system based on differential-based empirical mode decomposition. Journal of Vibration and Control, Vol. 21, Issue 9, 2015, p. 1821-1837.
-
Ma H., Yu T., Han Q., Zhang Y., Wen B., Xuelian C. Time-frequency features of two types of coupled rub-impact faults in rotor systems. Journal of Sound and Vibration, Vol. 321, Issue 3, 2009, p. 1109-1128.
-
Ren Z., Zhou S., Li C., Wen B. Dynamic characteristics of multi-degrees of freedom system rotor-bearing system with coupling faults of rub-impact and crack. Chinese Journal of Mechanical Engineering, Vol. 27, Issue 4, 2014, p. 785-792.
-
Luo Y. G., Ren Z. H., Ma H., Yu T., Wen B. C. Stability of periodic motion on the rotor-bearing system with coupling faults of crack and rub-impact. Journal of Mechanical Science and Technology, Vol. 21, Issue 6, 2007, p. 860-864.
-
Prabhakar S., Sekhar A. S., Mohanty A. R. Detection and monitoring of cracks in a rotor-bearing system using wavelet transforms. Mechanical Systems and Signal Processing, Vol. 15, Issue 2, 2011, p. 447-450.
-
Tchomeni B. X., Alugongo A. A., Masu L. M. In situ modelling of lateral-torsional vibration of a rotor-stator with multiple parametric excitations. World Academy of Science, Engineering and Technology International Journal of Mechanical, Aerospace, Industrial and Mechatronics Engineering, Vol. 8, Issue 11, 2014, p. 1855-1861.
-
Zhou T., Xu J., Sun Z. Dynamic analysis and diagnosis of a cracked rotor. Journal of Vibration and Acoustics, Vol. 123, Issue 4, 2001, p. 539-543.
-
Patel T. H., Darpe A. K. Coupled bending-torsional vibration analysis of rotor with rub and crack. Journal of Sound and Vibration, Vol. 326, Issue 3, 2009, p. 740-752.
-
Wan F., Xu Q., Li S. Vibration analysis of cracked rotor sliding bearing system with rotor-stator rubbing by harmonic wavelet transform. Journal of Sound and Vibration, Vol. 271, Issue 3, 2004, p. 507-518.
-
Jiao W., Qian S., Chang Y., Yang S. Research on vibration response of a multi-faulted rotor system using LMD-based time-frequency representation. EURASIP Journal on Advances in Signal Processing, Vol. 73, 2012, https://doi.org/10.1186/1687-6180-2012-73.
-
Sinou J. J. An experimental investigation of condition monitoring for notched rotors through transient signals and wavelet transform. Experimental Mechanics, Vol. 49, Issue 5, 2009, p. 683-695.
-
Sinou J. J., Loyer A., Chiello O., Mogenier G., Lorang X., Cocheteux F., Bellaj S. A global strategy based on experiments and simulations for squeal prediction on industrial railway brakes. Journal of Sound and Vibration, Vol. 332, Issue 20, 2013, p. 5068-5085.
-
Al Badour F., Sunar M., Cheded L. Vibration analysis of rotating machinery using time–frequency analysis and wavelet techniques. Mechanical Systems and Signal Processing, Vol. 25, Issue 6, 2011, p. 2083-2101.
-
Bachschmid N., Pennacchi P., Vania A. Identification of multiple faults in rotor systems. Journal of Sound and Vibration, Vol. 254, Issue 2, 2002, p. 327-366.
-
Pennacchi P., Vania A. Identification of a generator fault by model-based diagnostic techniques. International Journal of Rotating Machinery, Vol. 10, Issue 4, 2004, p. 293-300.
-
El Mongy H.-H., Younes Y. K. Vibration analysis of a multi-fault transient rotor passing through sub-critical resonances. Journal of Vibration and Control, 2017, https://doi.org/10.1177/1077546317697828.
Cited by
About this article

The authors greatly appreciate the support of the Department of Mechanical Engineering at Vaal University of Technology (South Africa) for providing resources and equipment to make this work possible.
