Abstract
In order to study the relationship between the transformer vibration and the operation state, the wavelet analysis method and the convolutional neural network method were used to analyze the transformer vibration signal. This paper proposes a transformer based on convolution neural network-based surface vibration signal feature extraction method. The result show that the convolution of neural network in different station transformer surface vibration signal classification has a lot of advantage, as the integration of feature extraction and classification recognition process together can effectively classify vibration signal recognition processing. This method is feasible for classification and identification by providing an accuracy value of 92.74 %. The future perspective of this research will focus on a generalized network model and parameters through experimentation for further investigation of accuracy and efficiency of this method.
Highlights
- The convolutional neural network method were used to analyze the transformer vibration signal.
- This paper proposes a transformer based on convolution neural network-based surface vibration signal feature extraction method.
- Proposed method is feasible for classification and identification by providing an accuracy value of 92.74%.
1. Introduction
The traditional diagnostic approaches used for fault tolerance are based on mechanism and handcrafted feature extraction [1]. These schemes have complicated feature extraction and feature selection mechanisms. In recent years, CNN (Convolutional Neural Network) algorithm has attracted extensive research and attention. CNN has widely been used in various domains like computer vision [2, 3], image and signal recognition [4] and medical imaging field [5-7]. It overcomes the defects of traditional neural network algorithm, such as insufficient expression ability and easy over fitting, and shows strong capability in feature extraction and feature classification [8]. CNN has attracted wide variety of researchers’ interest in the recent years due to its powerful self-learning capabilities and removal of feature engineering module. Recent breakthrough has been made in the field of voice processing, fault tolerance [9, 10], handwritten digit recognition, etc. Deep learning provided high accuracy rate through its optimization and back-propagation algorithm. Various deep belief networks (DBN), stacked autoencoder (SAE) and CNN architectures in order to computer network mode parameters.
Electric power is an indispensable and important form of energy in the process of industrialization of a country. As one of the key and expensive equipment in power grid system, the safety and reliability of power grid operation have a crucial relationship with it [11]. Among the transformer faults, the winding faults and the abnormal caused by the iron core account for a large proportion. Scholars at home and abroad have tried to use surface vibration signals to monitor the running state of winding and iron core, and have done a lot of research work. A large number of experimental analysis and field trial results show that the vibration signal detection method is effective and suitable for various types of transformers. The surface vibration of the transformer mainly comes from the internal vibration of the core affected by magnetostriction and the winding vibration caused by electromagnetic force [12]. The cooling system and voltage regulating device will also be affected to some extent. It is very important to analyze the operation state of transformer winding and iron core based on vibration signal to find out the problem in time and prolong the service life of transformer. CNN based approaches have shown a great improvement in the field of image recognition [13, 14], speech signal and health monitoring [15]. Now the domain has widened in the field of fault diagnosis [16] by combining them with the characteristics of Transformer rectifier units (TRUs).
In this paper, a transformer with rated voltage of (230±8x1.25 %) /121/11kV is identified and analyzed for its vibration. An approach combining the wavelet transform and convolutional neural network is proposed to extract the characteristics of the vibration signal on the transformer surface. The main contribution of this work is effective identification of vibration signal while utilizing the combination of both wavelet transform and CNN based technique. The outcomes for the proposed methodology utilizing convolution neural networks in different station transformer surface vibration signal classification is advantageous, as the integration of feature extraction and classification recognition can effectively classify vibration signal. This combination provides a feasible classification and identification solution for providing better efficiency and accuracy.
The rest of this article is arranged as: Section 2 presenting the literature review of existing techniques in this field; principle analysis is discussed in Section 3 providing the details of convolutional neural network, wavelet transform and different vibration tests. Section 4 detailing the experimental results and analysis part followed by Section 5 providing the conclusion and future scope of this work.
2. Literature review
Due to the importance of vibration signal detection, scholars at home and abroad have done a lot of research on vibration monitoring. For example, in optical fiber warning system, it is very important to identify different types of optical fiber vibration signals. The recognition of fiber vibration signal by neural network is one of the common methods in this field. As a well-trained small network, the random configuration network can get good results in the identification of optical fiber vibration signals. However, in the case of limited number of vibration signals, the recognition rate of SCNs is also limited. In order to improve the recognition rate of vibration signals, Qu, H. et al. proposed adaboost-SCN algorithm. It integrates different SCNS as the basic classifier in AdaBoost. The adaboost-SCN experiment shows that the test accuracy of the algorithm is 12.1 % higher than that of the original one. The proposed algorithm not only increases the recognition rate of fiber vibration signals, but also improves the generalization ability of the original SU prachiasmatic nucleus with a limited number of vibration signal samples [17]. Bagheri M. et al. discussed in detail the analytical method of transformer vibration modeling. However, due to the mixing of the higher harmonics and the basic harmonics in the vibration spectrum, it is not practical to interpret the transformer vibration signals accurately with analytical models. Using advanced machine learning and signal processing technology, a predictive model of transformer operation based on vibration signal is developed. The insulation deterioration and short circuit analysis between turns of transformer are simulated and tested. At the same time, the over-excitation and under-excitation of the transformer are also studied and evaluated. The established prediction model can detect the transformer short circuit fault in the early stage by using vibration signal before the transformer sudden failure. Real-time information is transmitted to the cloud system and the results can be accessed from any portable device [18]. Chen G. et al. proposed a calculation method related to wavelet packet transformation. In order to verify the feasibility of the main frequency section and the proposed method for calculating the blasting frequency characteristics, the field blasting vibration signals monitored in a mine are used as an example. The influence of explosive charge amount and distance on the main frequency band distribution is also studied. The results show that the main frequency segment based on this method is a sensitive, accurate and efficient frequency parameter. It can describe the frequency characteristic of explosive signal and overcome the shortcoming of Fourier transform. When the charge amount of explosive is constant, the span of main frequency decreases as the distance increases, and the energy in frequency domain of explosive vibration signal is mainly concentrated in the low frequency range. When the distance is constant, the peak energy of explosive vibration signal increases with the increase of explosive charge, but the main frequency band does not change obviously [19]. In order to avoid the influence of interference on the frequency characteristic, the least square method is used to eliminate the trend component of the signal, and the wavelet threshold method with the function of hard threshold and birge-Massart strategy are used for denoising. The CNN based approaches are best suitable for automatic feature extraction from the raw signal [20-26]. The fault diagnosis approaches using CNN based methods are divided into two dimensions (1D and 2D) depending upon the input signal dimensions. Wen, et al. [20]; Hoang, et al. [21], Wang, et al. [22] and Ding, et al. [23] have utilized the 2D input raw time-series signal into a 2D time frequency image sequence and then built their respective CNN models as per the designated diagnosis task. Liu, et al. [24] and Zhang, et al. [25, 26] dealt with the non-stationary environments of electric machines and bearings by proposing a CNN based approach with the disrupted time-series signal. A semi-supervised multi-scale CNN based fault identification approach was proposed by Pan, et al. [27] utilizing unlabeled samples. They utilized a transfer learning approach which initially trains the network on the base dataset and finally transfers the learned features to the target network. Another transferable deep CNN model was proposed by Yosinski, et al. [28] along with specialized different layers which transfers the features from the distant tasks outperforming the weight randomization. GoogleNet Inception-V3 platform was utilized by Esteva, et al. [29] for the classification of skin lesions. This network was initially pre-trained over ImageNet dataset and then transferred to a clinical image platform using transfer learning. Bhardwaj, et al. [30] used a novel Quadrant based Inception-V3 network architecture for Diabetic retinopathy severity grading to improve the diagnostic capability for mass screening. They improved the grading efficiency by utilizing data augmentation, image enhancement and optical disc removal pipelines.
Various image recognition studies have used transfer learning-based approaches utilizing CNNs trained over ImageNet dataset. These resulted into much better outcomes in terms of efficiency than the models trained only on a small respective target dataset. All these works reveal that CNN provides better performance without utilizing feature engineering and extensive domain knowledge.
3. Principle analysis
3.1. Introduction of convolutional neural network
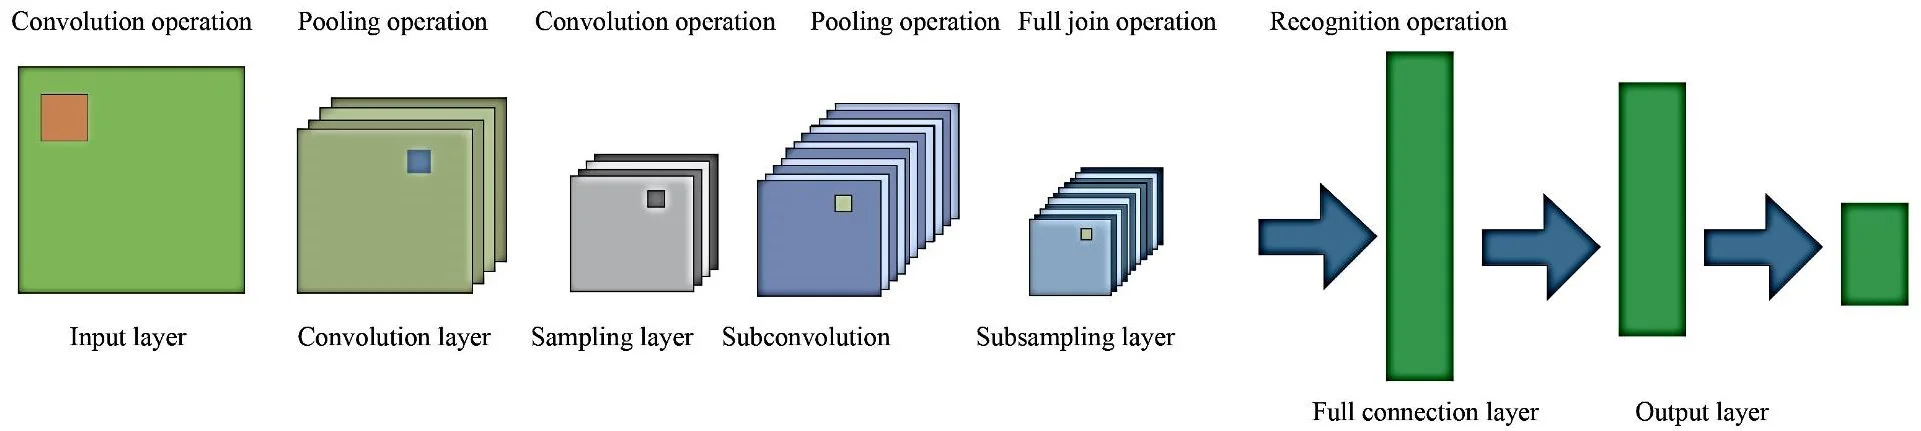
As shown in Fig. 1, the existing convolutional neural network structure includes the input layer, the intermediate hidden layer and the output layer. The intermediate hidden layer is composed of one or more convolutional layers and sampling layers. In the basic structure of a convolutional neural network, the components that are mainly used to extract features are the convolutional layer, sampling layer and fully connected layer.
Fig. 1Structure diagram of convolutional neural network
Convolutional Layer: The convolutional layer is mainly used for feature extraction, which is to extract local features of each neuron and then serve as the output neuron of the layer. It is mainly through the sparse connection of neurons at the input layer and network weights, and then two-dimensional convolution, the local features of neurons can be obtained, and the relationship between other features can be determined based on this feature information.
Sampling Layer: This layer is used in the Convolutional Neural Network for intermediate sampling of output features provided by the convolutional layer. Feature information, which is obtained by convolution layer to feature mapping requires by sampling, the convolution output layer neurons as sampling the input layer, similar to the process of convolution layer, layer of sample has multiple features in the process of mapping, in the sample layer each feature mapping plane all the neurons have the same weight, sampling for the input image in convolution layer in convolution summation, and bias, after a sigmoid function which is to get the output of the sample layer [31]. In feature mapping, the excitation function Sigmoid with small kernel of influence function is used to obtain the mapping feature with constant displacement. In the sampling layer, all neurons in the plane of each feature map have the same weight, thus reducing the computational complexity of the network. The structure with sampling layer is connected behind the convolutional layer, which can make the feature mapping extracted by the convolutional layer more concentrated.
Fully Connected Layer: This acts as a traditional neural network that extracts the feature vector from the adjacent subsampling layers and provide the output probabilities to the final output layer of the network. The output probabilities are obtained using the softmax activation function at the output layer that yields the probability values ranging from 0 to 1 indicating the categorical output classes.
In this work, the input provided to the convolutional neural network contain 3600 images extracted by the time-frequency transform method of wavelet transform. The output of the convolutional network provides the vibration fault analysis into three different fault classes namely; the inner race (IR) fault, the outer race (OR) fault and the rolling bearing (BA) faults. The analysis was done on the vibration signal under different motor loads and fault diameters to yield three-class classification using the CNN network into IR faults, BA faults and OR faults.
3.2. Wavelet transform
Wavelet transform solves the contradiction in time-frequency domain very well. It is not only a local transform in time, but also a local transform in frequency domain. Wavelet transform can be used to make a more detailed analysis of the frequency of function or signal by means of expansion, translation and other operational functions, and solve many difficult problems that cannot be solved by Fourier transform to a great extent. The wavelet transform is formed by scaling and shifting the parent wavelet function. A signal is a signal with limited energy, which satisfies:
Its wavelet transform is defined as the integral transform with the function cluster as the integral kernel, as follows:
Function cluster is the wavelet function cluster generated by basic wavelet function through expansion and translation:
where, is the scale parameter, is the time shift parameter, and is the normalized constant to ensure the energy conservation of the transformation, namely:
It can be seen from the above formula that the wavelet transform is A linear transformation, which USES the oscillation function as the window to scan and shift the signal by changing the frequency, where the expansion parameter used to change the oscillation frequency is a and the translation parameter is . Unlike THE STFT, the wavelet transform can change the resolution in time domain and frequency domain by adjusting the frequency. In high frequency band, wavelet transform can achieve good time domain resolution, but the frequency domain resolution is poor, in low frequency band, the situation is just the opposite.
3.3. Test objects
In order to conduct the research on transformer vibration identification, a transformer model sfSZ10-180,000 /220 is selected as the research object. The specific parameters are shown in Table 1.
Table 1Parameters of SFSZ10-180,000 /220 transformer
Type of transformer | SFSZ10-180000/220 |
Rated capacity / kVA | 180000/180000/60000 |
Rated voltage / kV | (230±8×1.25%)/121/11 |
High voltage rated current / A | 541.8 |
Low voltage side rated current / A | 3149 |
Total weight / t | 206.4 |
Frequency / Hz | 50 |
3.4. Vibration test
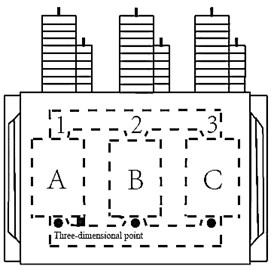
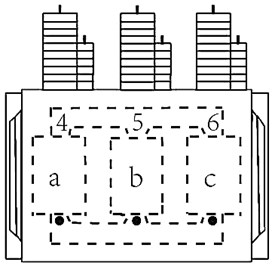
In the process of acquisition, the acceleration sensor of six models for ULT2008 separately adsorbed on the surface of the test transformer tank is utilized. The high side and low voltage side, the location of the points is shown in Fig. 2. Among them, 1, 2, 3 points located on the high side, 4, 5, 6 point located in the low voltage side. At the same time, the model for ULT2061 adsorption three-dimensional vibration acceleration sensor is used in the test transformer. A phase (point 1) level of 10 cm is used to the right direction; where direction is the horizontal direction, direction is the vertical direction and the direction represents the direction perpendicular to the surface of the transformer.
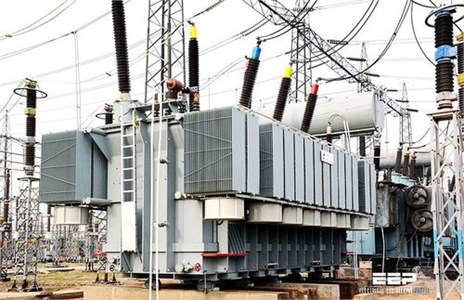
In Fig. 2; A, B, C indicates the three-dimensional points at the high voltage side and a, b, c indicates the three-dimensional points at the low voltage side. The surface vibration signal of transformer contains abundant state information, and whether the measured signal collected is complete and effective has an important influence on the feature extraction of vibration signal and the status evaluation of transformer. The image of a real-life transformer is depicted in Fig. 3.
The real-life transformer is completely different and complex comparative to its schematic diagram. Due to the complex transformer structure and the influence of transmission path and other factors, the unreasonable setting of sampling frequency and sampling length in the signal acquisition process is likely to lead to the large difference in vibration signal characteristics. This condition collected by the same transformer seriously affects the analysis and judgment of transformer operating state [32, 33]. Therefore, in the process of collecting the transformer surface vibration data, the following parameters are mainly set:
Sampling frequency, FS: Setting a reasonable sampling frequency can effectively avoid signal distortion. Relevant studies have shown that the transformer vibration signal is mainly within 1 kHz. According to the sampling theorem, the sampling frequency should be no less than 2 kHz.
Sampling interval, : It refers to a length t (sampling length) sampling of the transformer at a certain time interval. The setting of this parameter should be in the same period of time with the operating condition data of the transformer, such as operating voltage, load current and oil tank, so as to facilitate the analysis of data of different working conditions. It is found through field investigation that the transformer substation records the operating condition data every 5 minutes when monitoring the transformer, so it is recommended to set this parameter to 5 minutes.
Sampling time, : It refers to the time required to complete , sampling, which is related to frequency to some extent. The smaller the sampling length is, the smaller the frequency interval will be, and the higher the frequency resolution will be, namely, . Therefore, this parameter can be set according to the minimum frequency to be studied when analyzing the vibration signal.
To sum up, according to the actual requirements of transformer vibration signal analysis in this paper, relevant parameters of data acquisition are set as follows: sampling frequency 10 kHz, sampling duration 1 s, and sampling interval 5 min.
Fig. 2Schematic diagram of measuring points for the vibration test
a) High voltage side
b) Low voltage side
Fig. 3Real-life transformer
4. Experimental results and analysis
The experimental results and analysis are presented in this section of the article, detailing the sampling data used and verification of transformer vibration signal in terms of various evaluation parameters.
4.1. Sample data
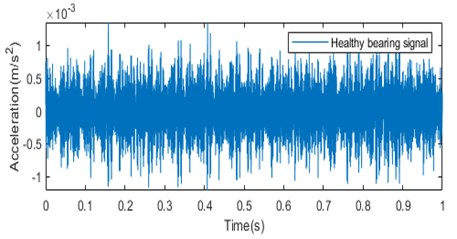
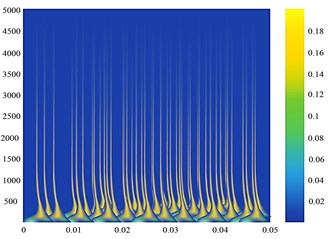
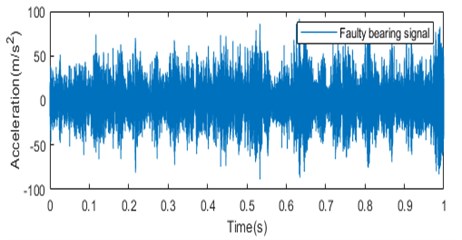
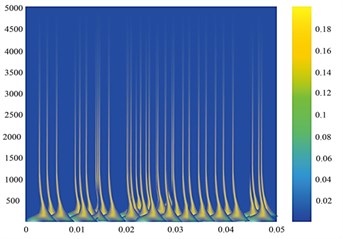
The samples used in this paper were divided into a section every 0.05 s of the data of each measurement point, and 3600 sections were taken for wavelet transform analysis of each section of data to obtain the time-frequency diagram of the vibration signal of this section. The training samples were set as training samples, so the training samples were divided into 9 groups with 3600 samples in each group and a total of 32,400 samples in the training sample set [34, 35]. 400 segments of data are taken after a period of time, and wavelet transform is performed to obtain time-frequency graph, which is set as the test sample. Similarly, the test samples were divided into 9 groups of 400 for a total of 3,600. The time-frequency graphs of different measurement points are shown in Fig. 4 form both normal and faulty condition.
Fig. 4a) Normal bearing signal, c) faulty bearing signal; time-frequency diagram of the measuring point of Phase A on the high-pressure side of the transformer for b) normal bearing signal and d) faulty bearing signal
a)
b)
c)
d)
The time-frequency diagram is fed to the CNN network. The images extracted by the time-frequency transform method of wavelet transform can effectively represent the localization characteristics of the original signal frequency and contain rich state information. The information depicted by the time-frequency diagram shows that the amplitude of the signal is larger in case of faulty condition than in the normal condition. The color variation in the wavelet transform output depicts the magnitude of the time-frequency grid coefficients. The wavelet transforms outputs carry very important information regarding the faulty condition as the high energy peaks indicated in the wavelet transform outputs at the low frequency bands provides the information about the bearing that is heading to the defect or faulty condition. These images are provided to the CNN network for classification of vibration faults into three types; IR faults, BA faults and OR faults.
4.2. Verification of transformer vibration signal results
The deep learning framework Caffe was used to construct the convolutional neural network. Set the batch number of each batch to 64, that is, each batch can handle 64 samples. Since there are 32,400 samples, 507 batches shall be processed after all the samples are processed. The number of iterations was set as 10, and an iteration was a training for the entire training sample set. Therefore, the maximum number of iterations was set as 550, and a total of 5500 training sessions were required for 10 iterations.
The confusion matrix obtained for three class classification of vibration signal into IR faults, OR faults and BA faults is depicted in Table 2.
Table 2Confusion matrix for vibration signal fault analysis
Actual label | Predicted label | ||
IR | OR | BA | |
IR | 0.92 | 0.00 | 0.00 |
OR | 0.00 | 1.00 | 0.00 |
BA | 0.233 | 0.00 | 0.93 |
The confusion matrix depicts the difference in the actual fault labels and the predicted labels in terms of true positives (TP), true negatives (TN), false positives (FP) and false negatives (FN). The training effect of the convolutional network is evaluated in terms of accuracy, sensitivity, specificity, positive prediction rate and the loss function, which are provided by Eq. (5-9):
where – true positive, – true negative, – false positive, – false negative, – class, – true classification, – observation, – prediction probability and – binary indicator for correct class label.
Loss function can also be referred to as the cost function, is the objective function in the process of neural network is optimized, or optimization of neural network training is the ultimate goal is to minimize the Loss function, that is to say, Loss function value is smaller, the corresponding prediction results and the real situation is closer to, this paper uses the Loss function of Softmax-With-Loss, a network model for Caffenet.
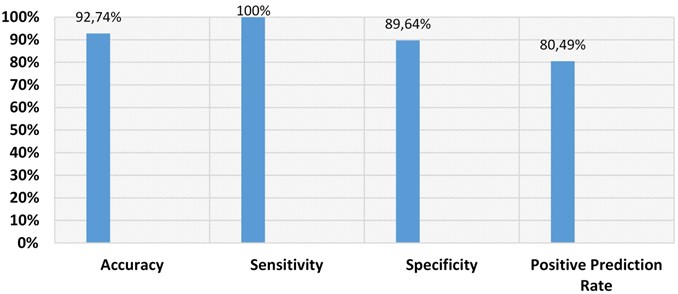
The performance of convolutional neural network is evaluated in terms of different parameters like sensitivity, specificity, accuracy and positive prediction value. The outcomes obtained are tabulated in Table 3 and are graphically represented in Fig. 5.
Table 3Performance evaluation parameters for classification outcomes
Performance evaluation parameters | Values |
Accuracy | 92.74 % |
Sensitivity | 100 % |
Specificity | 89.64 % |
Positive prediction rate | 80.49 % |
Table 3 and Fig. 5 depicts values of the performance evaluation parameters for the convolutional neural network classification outcomes obtained. It provides the accuracy value of 92.74 % while providing sensitivity of 100 %, specificity of 89.64 % and positive prediction rate of 80.49 %.
From Fig. 5, the sensitivity rate of 100 % reveals that the convolutional network is fully capable of identifying the true faulty vibration signal pixels.
Fig. 5Performance evaluation parameters for classification outcomes
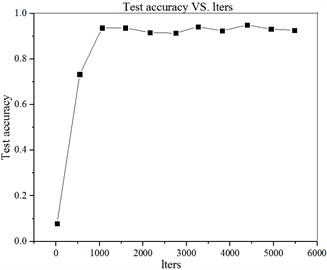
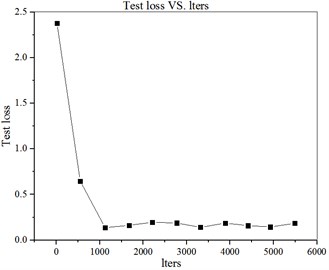
The relationship between the accurate recognition rate and loss function of the test set and the number of iterations is shown in Fig. 6. The specific values are shown in Fig. 6.
Fig. 6Curve of a) accurate recognition rate and iteration times of test set b) loss function and iteration times curve of test set
a)
b)
The accuracy curve computations for convolutional neural network are provided in Fig. 7. This depicts the increase in the accuracy rate for the increasing iterations from 0 to 10 while increasing the samples from 0 to 5500 with the 550 step increment.
It can be seen from Fig. 6 and Fig. 7 that in the first two iterations, the accuracy of the test set increases steadily and rapidly, and the loss function declines rapidly. After two iterations, the accuracy rate and the loss value remain in a relatively stable state, indicating that the sample data can be trained to converge under the model and parameters.
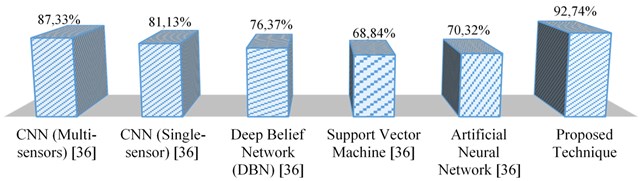
The comparative analysis of the proposed technique with the other state-of-the-art methods are depicted in Fig. 8.
From Fig. 8, it is revealed that the proposed approach outperforms the other state-of-the-art methods in vibration signal recognition, thereby providing the maximum accuracy of 92.74 % comparative to the other existing approaches.
Combined with the analysis results can be seen that the method can accurately identify different measuring point of the signal, the vibration signal has good recognition effect, proved that the method of surface vibration signals of transformer classification is feasible, but the recognition accuracy is associated with the set of convolution network model parameters, still need to through the experiment many times to adjust the network parameters in the model, in order to achieve the best recognition rate.
Fig. 7Iteration times and test set accuracy
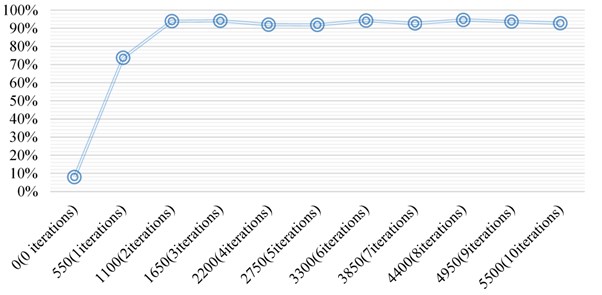
Fig. 8Comparative analysis of the proposed technique with state-of-the-art methods
5. Conclusions
In this paper, the vibration analysis was performed for a transformer with rated voltage of (230±8x1.25%) /121/11kV. A method based on convolutional neural network is proposed which combines the wavelet transform to extract the characteristics of the transformer surface vibration signal. The main conclusions achieved from the study are as follows:
1) The robust combination of wavelet transforms and convolutional neural network has great advantages in the classification and identification of vibration signals at different measuring points on the transformer surface. The integration of feature extraction, classification and identification makes the vibration signal recognition and classification process effective.
2) This method is feasible for classification and identification with its recognition rate related to the model structure and parameters of the network.
3) The proposed method is a reliable vibration identification and classification method that provides an accuracy value of 92.74 %.
4) The future part of this research will focus on more generalized network model and parameters experimentation will be conducted on each parameter to further investigate the accuracy and efficiency of this method.
References
-
Yan J., Zhu H., Yang X., Cao Y., Shao L. Research on fault diagnosis of hydraulic pump using convolutional neural network. Journal of Vibroengineering, Vol. 18, Issue 8, 2016, p. 5141-5152.
-
Liu Y., He B., Liu F., Lu S., Zhao Y. Feature fusion using kernel joint approximate diagonalization of eigen-matrices for rolling bearing fault identification. Journal of Sound and Vibration, Vol. 385, 2016, p. 389-401.
-
Mera C., Orozco-Alzate M., Branch J., Mery D. Automatic visual inspection: An approach with multi-instance learning. Computers in Industry, Vol. 83, 2016, p. 46-54.
-
Salamon J., Bello J. P. Deep convolutional neural networks and data augmentation for environmental sound classification. IEEE Signal Processing Letters, Vol. 24, Issue 3, 2017, p. 279-283.
-
Litjens G., Kooi T., Bejnordi B. E., Setio A. A. A., Ciompi F., Ghafoorian M., Sánchez C. I. A survey on deep learning in medical image analysis. Medical Image Analysis, Vol. 42, 2017, p. 60-88.
-
Liu H., Liu C., Huang Y. Adaptive feature extraction using sparse coding for machinery fault diagnosis. Mechanical Systems and Signal Processing, Vol. 25, Issue 2, 2011, p. 558-574.
-
Bhardwaj C., Jain S., Sood M. Diabetic retinopathy detection from eye fundus images with parameter tuning for convolutional neural networks. 5th International Conference on Signal Processing, Computing and Control, 2019.
-
Qu Z., Hou C., Hou C., Wang W. Radar signal intra-pulse modulation recognition based on convolutional neural network and deep Q-learning network. IEEE Access, Vol. 8, 2020, p. 49125-49136.
-
Sharma A., Singh P. K., Sharma A., Kumar R. An efficient architecture for the accurate detection and monitoring of an event through the sky. Computer Communications, Vol. 148, 2019, p. 115-128.
-
Sharma A., Kumar R., Talib M. W. A., Srivastava S., Iqbal R. Network modelling and computation of quickest path for service-level agreements using bi-objective optimization. International Journal of Distributed Sensor Networks, Vol. 15, Issue 10, 2019, https://doi.org/10.1177/1550147719881116.
-
Liu W., Qin C., Gao K., Li H., Qin Z., Cao Y., Si W. Research on medical data feature extraction and intelligent recognition technology based on convolutional neural network. IEEE Access, Vol. 7, 2019, p. 150157-150167.
-
Hoang D. T., Kang H. J. Rolling element bearing fault diagnosis using convolutional neural network and vibration image. Cognitive Systems Research, Vol. 53, 2019, p. 42-50.
-
Bhardwaj C., Jain S., Sood M. Deep learning based diabetic retinopathy prediction of colored fundus images with parameter tuning. Advances in Computational Intelligence Techniques, Springer, Singapore, 2020, p. 53-62.
-
Bhardwaj C., Jain S., Sood M. Hierarchical severity grade classification of non-proliferative diabetic retinopathy. Journal of Ambient Intelligence and Humanized Computing, 2020, https://doi.org/10.1007/s12652-020-02426-9.
-
Sharma A., Kumar R. A constrained framework for context‐aware remote E‐healthcare (CARE) services. Transactions on Emerging Telecommunications Technologies, 2019, p. e3649.
-
Sharma A., Kumar R. Computation of the reliable and quickest data path for healthcare services by using service-level agreements and energy constraints. Arabian Journal for Science and Engineering, Vol. 44, Issue 11, 2019, p. 9087-9104.
-
Qu H., Feng T., Wang Y., Zhang Y. Adaboost-scn algorithm for optical fiber vibration signal recognition. Applied Optics, Vol. 58, Issue 21, 2019, p. 5612-5623.
-
Bagheri M., Zollanvari A., Nezhivenko S. Transformer fault condition prognosis using vibration signals over cloud environment. IEEE Access, Vol. 6, 2018, p. 9862-9874.
-
Chen G., Li Q. Y., Li D. Q., Wu Z. Y., Liu Y. Main frequency band of blast vibration signal based on wavelet packet transform. Applied Mathematical Modelling, Vol. 74, 2019, p. 569-585.
-
Wen L., Li X., Gao L., Zhang Y. A new convolutional neural network based data-driven fault diagnosis method. IEEE Transactions on Industrial Electronics, Vol. 65, Issue 7, 2018, p. 5990-5998.
-
Liu R., Meng G., Yang B., Sun C., Chen X. Dislocated time series convolutional neural architecture: An intelligent fault diagnosis approach for electric machine. IEEE Transactions on Industrial Informatics, Vol. 13, Issue 3, 2016, p. 1310-1320.
-
Wang P., Yan R., Gao R. X. Virtualization and deep recognition for system fault classification. Journal of Manufacturing Systems, Vol. 44, 2017, p. 310-316.
-
Ding X., He Q. Energy-fluctuated multiscale feature learning with deep convnet for intelligent spindle bearing fault diagnosis. IEEE Transactions on Instrumentation and Measurement, Vol. 66, Issue 8, 2017, p. 1926-1935.
-
Zhang W., Peng G., Li C., Chen Y., Zhang Z. A new deep learning model for fault diagnosis with good anti-noise and domain adaptation ability on raw vibration signals. Sensors, Vol. 17, Issue 2, 2017, p. 425.
-
Zhang W., Li C., Peng G., Chen Y., Zhang Z. A deep convolutional neural network with new training methods for bearing fault diagnosis under noisy environment and different working load. Mechanical Systems and Signal Processing, Vol. 100, 2018, p. 439-453.
-
Pan T., Chen J., Xie J., Chang Y., Zhou Z. Intelligent fault identification for industrial automation system via multi-scale convolutional generative adversarial network with partially labeled samples. ISA Transactions, Vol. 101, 2020, p. 379-389.
-
Yosinski J., Clune J., Bengio Y., Lipson H. How transferable are features in deep neural networks? Advances in Neural Information Processing Systems, 2014, p. 3320-3328.
-
Esteva A., Kuprel B., Novoa R. A., Ko J., Swetter S. M., Blau H. M., Thrun S. Dermatologist-level classification of skin cancer with deep neural networks. Nature, Vol. 542, Issue 7639, 2017, p. 115-118.
-
Bhardwaj C., Jain S., Sood M. Diabetic retinopathy severity grading employing quadrant based inception-v3 convolution neural network architecture. International Journal of Imaging Systems and Technology. 2020, https://doi.org/10.1002/ima.22510.
-
Liu X., Yang Y., Zhang J. Resultant vibration signal model based fault diagnosis of a single stage planetary gear train with an incipient tooth crack on the sun gear. Renewable Energy, Vol. 122, 2018, p. 65-79.
-
Wang H., Jing X. Vibration signal-based fault diagnosis in complex structures: a beam-like structure approach. Structural Health Monitoring, Vol. 17, Issue 3, 2018, p. 472-493.
-
Liu Y., Qiao N., Zhao C., Zhuang J. Vibration signal prediction of gearbox in high-speed train based on monitoring data. IEEE Access, Vol. 6, 2018, p. 50709-50719.
-
Wang K., Liu G., Li Y., Qin M., Wang G. Experimental evaluation of sand particle identification in oil-water-gas multiphase flows based on vibration signal analysis. Chemical Engineering Research and Design, Vol. 151, 2019, p. 79-90.
-
Fei C. W., Choy Y. S., Bai G. C., Tang W. Z. Multi-feature entropy distance approach with vibration and acoustic emission signals for process feature recognition of rolling element bearing faults. Structural Health Monitoring, Vol. 17, Issue 2, 2018, p. 156-168.
-
Wang H., Li S., Song L., Cui L. A novel convolutional neural network based fault recognition method via image fusion of multi-vibration-signals. Computers in Industry, Vol. 105, 2019, p. 182-190.
Cited by
About this article

