Abstract
Rolling bearings are the most important components in the transmission system of coal mining machinery, and their operating condition significantly impacts the entire mechanical and electrical equipment. Therefore, the fault diagnosis of rolling bearing can effectively ensure the operation reliability of equipment. Given the strong noise, coal impact, and other interference, the vibration signal of the rolling bearing cannot be effectively decomposed, and the fault identification efficiency is low. According to the method based on vibration analysis, this article proposes a rolling bearing fault diagnosis method based on ensemble local mean decomposition (ELMD) hybrid feature extraction and wavelet neural network. ELMD is used to solve the problem of modal aliasing in local mean decomposition (LMD), which can improve the efficiency of LMD. Quantitatively extracting the mixed features of each component and introducing a wavelet neural network for fault type recognition. The experimental results demonstrate that the proposed method has a high accuracy in fault recognition and is an effective fault diagnosis method.
Highlights
- ELMD can effectively eliminate the mode aliasing caused by LMD decomposition.
- The hybrid feature parameter extraction method can effectively remove the phenomenon of feature redundancy generated by the traditional feature selection algorithm when extracting signals, effectively distinguish fault types, and increase the accuracy of fault identification.
- WNN can effectively improve the fuzzy of a hidden layer of the BP neural network and enhance the accuracy of fault identification.
1. Introduction
Rolling bearings, as a fundamental component of coal mining machinery transmission systems, directly impact the efficiency and safety of coal mining machinery due to their operating conditions and failure rates. According to statistics, about 30 % of faults of rotating parts are caused by rolling bearings [1]. Therefore, the research on the rolling bearing fault diagnosis method is particularly important. In practice, the working environment of the mechanical transmission system of a coal mine is often harsh, so it is difficult to effectively decompose the vibration signals of rolling bearings and extract fault features and accurately identify faults under the interference of strong noise and falling coal impact. Many scholars have studied some research to carry out the accurate and efficient fault diagnosis of rolling bearings and the intelligent maintenance of equipment. Common fault diagnosis methods include vibration analysis, noise analysis, oil analysis, temperature analysis, and so on [2]. Among them, the vibration analysis method is the most widely used.
The key to vibration analysis is to extract fault characteristics from vibration signals. However, the vibration signals of rolling bearings have characteristics such as nonlinearity, non-stationarity, strong coupling, and background noise, which require in-depth analysis of the vibration signals to achieve fault diagnosis, which poses certain difficulties. The classical spectral analysis reflects the frequency domain characteristics of vibration signals through the Fourier transform, due to its clear physical interpretation and fast computational capabilities, it has been widely utilized. However, its defect is that the classical spectral analysis method is based on the stability of the signal, which can only process the linear vibration signals, and only has global statistical significance [3]. Meanwhile, it cannot reflect the sudden change of the vibration signal and is not suitable for non-stationary vibration signals of mechanical faults.
Short-time Fourier transforms (STFT) is a time-frequency analysis method that considers non-stationary signals as composed of a series of short-time stationary signals. It uses a window function multiplied by the signal to be analyzed [4]. But it is limited by the Heisenberg uncertainty principle, which has the shortcomings of low time-frequency resolution and lack of self-adaptability. In 1998, Huang et al. [5] proposed a fault diagnosis method for rolling bearings based on the Hilbert-Huang transform (HHT), which decomposes the signal into several Intrinsic Mode Functions (IMFs) using Empirical Mode Decomposition (EMD), the instantaneous amplitude and frequency of each IMF component are then calculated using the Hilbert transform. However, Hilbert-Huang Transform (HHT) has its limitations, such as severe endpoint effects during its execution, fitting errors caused by fitting the envelope using cubic spline interpolation, the occurrence of unexplainable negative frequencies during HT demodulation, and energy leakage caused by the endpoint effects [6]. Therefore, some improved methods such as LMD and ELMD are proposed.
After extracting and decomposing the signal, it is necessary to perform fault feature quantization to extract parameters that represent the fault characteristics of mechanical equipment [7]. In terms of common time-domain feature parameters, there are mainly dimensional parameters such as peak, average value, root mean square value, and variance and dimensionless parameters such as kurtosis, margin, and waveform factor [8]. Entropy is originally used to express the disorder degree of molecules and it has also been introduced into the field of signal processing at present. The commonly used entropy features in fault diagnosis include information entropy, energy entropy, power spectrum entropy, and so on.
After extracting the characteristic parameters of sensitive faults, it is necessary to accurately identify the faults. The neural network can continuously adjust the weights through self-learning when new faults occur, realize the complex nonlinear mapping relationship between faults and symptoms, and have the ability of associative memory, pattern matching, and similar induction of faults [9], it is a commonly used means at present.
This article proposes to use the Extreme Learning Machine Decomposition (ELMD) to process the vibration signals of rolling bearings, and then extract mixed features such as time-domain characteristic parameters and entropy features from the decomposed results of ELMD. Finally, the fault diagnosis of rolling bearing can be performed by a wavelet neural network. This method can decompose components containing fault features in the case of large external interference. Compared with traditional feature selection algorithms, the manual selection of hybrid features can better distinguish the differences between different faults at each component, and improve the accuracy of wavelet neural network identification.
2. The proposed method
2.1. ELMD
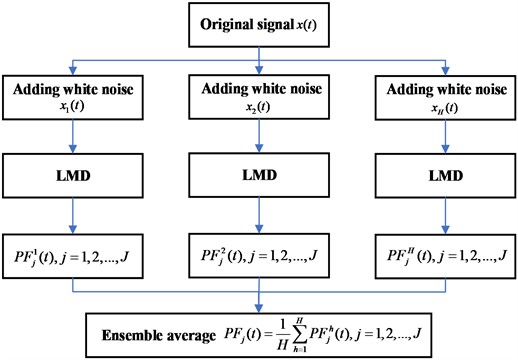
ELMD is an improved method based on LMD, and it can eliminate modal aliasing by adding Gaussian white noise [10]. The processing flow of ELMD is as follows: For a vibration signal , suppose that the vibration signal added the -th white noise is . For the vibration signal , compute the average value and local amplitude between adjacent local extrema points, and apply a moving average to all and values to obtain the local mean function and envelope estimation function [11]. Separate the local mean function from the original signal to obtain:
Divide by envelope estimation function , and the demodulation of can be obtained and shown as follows:
To calculate the envelope estimation function of , the above iterative process needs to be repeated until a pure frequency modulation signal is obtained, when the envelope estimation function of satisfies . The envelope signal can be obtained by multiplying all envelope estimation functions generated in the iterative process, and it is shown as follows:
By multiplying the envelope signal and pure frequency modulation signal , the first Product Function (PF)component of the original vibration signal can be obtained, and it can be separated from the original signal to obtain . Repeat the above steps until is a monotonic function. So far, the original vibration signal adds the -th white noise is decomposed into PF components , and a remainder .
It can be further seen that , a set of PF components will be obtained for a vibration signal after adding white noise once by the above process. Assuming a total of times white noise is added, the groups of PF components can be obtained. The final decomposition results can be obtained by averaging the PF components obtained by adding white noise each time, and the formula is expressed as follows:
where is the final -th PF component obtained by ELMD, the -th PF component obtained by LMD when the -th white noise is added, is the decomposition layer of ELMD, and is the total times of adding white noise. The flowchart of ELMD is shown in Fig. 1.
Fig. 1The flowchart of ELMD
2.2. Hybrid feature parameters
This article proposes a hybrid feature extraction model that mainly includes time-domain feature parameters and entropy feature parameters. The time-domain feature parameters are widely used in the fault diagnosis of rolling bearing, and the time-domain feature parameters include dimensional parameters such as peak, average value, root mean square value, variance, and dimensionless parameters such as kurtosis, margin, and waveform factor [12]. The time-domain feature parameters used in this paper are shown in Table 1.
Table 1Time-domain feature parameters used in this paper
Kurtosis | Peak factor | ||
Root mean square | Margin factor | ||
Waveform factor | |||
Envelope entropy is a method combining envelope spectrum analysis and information entropy [13]. It is a feature extraction method to measure the internal characteristic changes of the vibration signal and is independent of vibration signal strength. It is only related to the frequency distribution of the vibration signal, reflecting the complexity of the vibration signal, specifically expressed as follows:
where is the envelope spectrum of any time-domain vibration signal .
The power spectrum entropy starts from the spatial energy distribution in the frequency domain of the vibration signal, reflecting the overall uncertainty and complexity of the vibration signal, which characterizes the spectral structure of the analyzed vibration signal [14].
can be obtained by the Fourier transform of any time-domain vibration signal containing data points. The power spectrum entropy can be expressed as:
2.3. The wavelet neural network (WNN)
WNN is used in this paper for fault identification after hybrid feature extraction. WNN takes the wavelet function as the activation function of the hidden layer, and the corresponding parameters such as the network connection weights and threshold are replaced by the scaling and translation parameters of the wavelet function, respectively [15], and the structure of WNN is shown in Fig. 2.
Fig. 2Structure of WNN
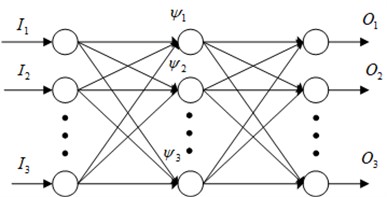
In this paper, the commonly used Morlet wavelet is chosen as the wavelet basis function, assuming is the network input and is the network output respectively, is the weights between the input layer and the hidden layer, and is the weights between the hidden layer and the output layer. When the input layer signal is , the output of the hidden layer is [16]:
The output of the output layer is:
The error energy function is used to optimize the parameters of the wavelet neural network:
Among them, is the expected output and is the actual output.
The learning formula for the weights and coefficients of WNN is as follows:
where is the learning rate and is the momentum factor.
In conclusion, the training process of WNN is as follows:
(1) Initialize the parameters, including weights , , scaling factor , translation factor and set learning rate .
(2) A large number of data samples were divided into training samples and testing samples.
(3) Calculate the output value of the output layer of WNN and the error energy function .
(4) Parameter optimization is carried out using the error energy function .
(5) Evaluate whether the condition is met; if not, return to step (3) and repeat until the condition is satisfied.
3. Experimental platform
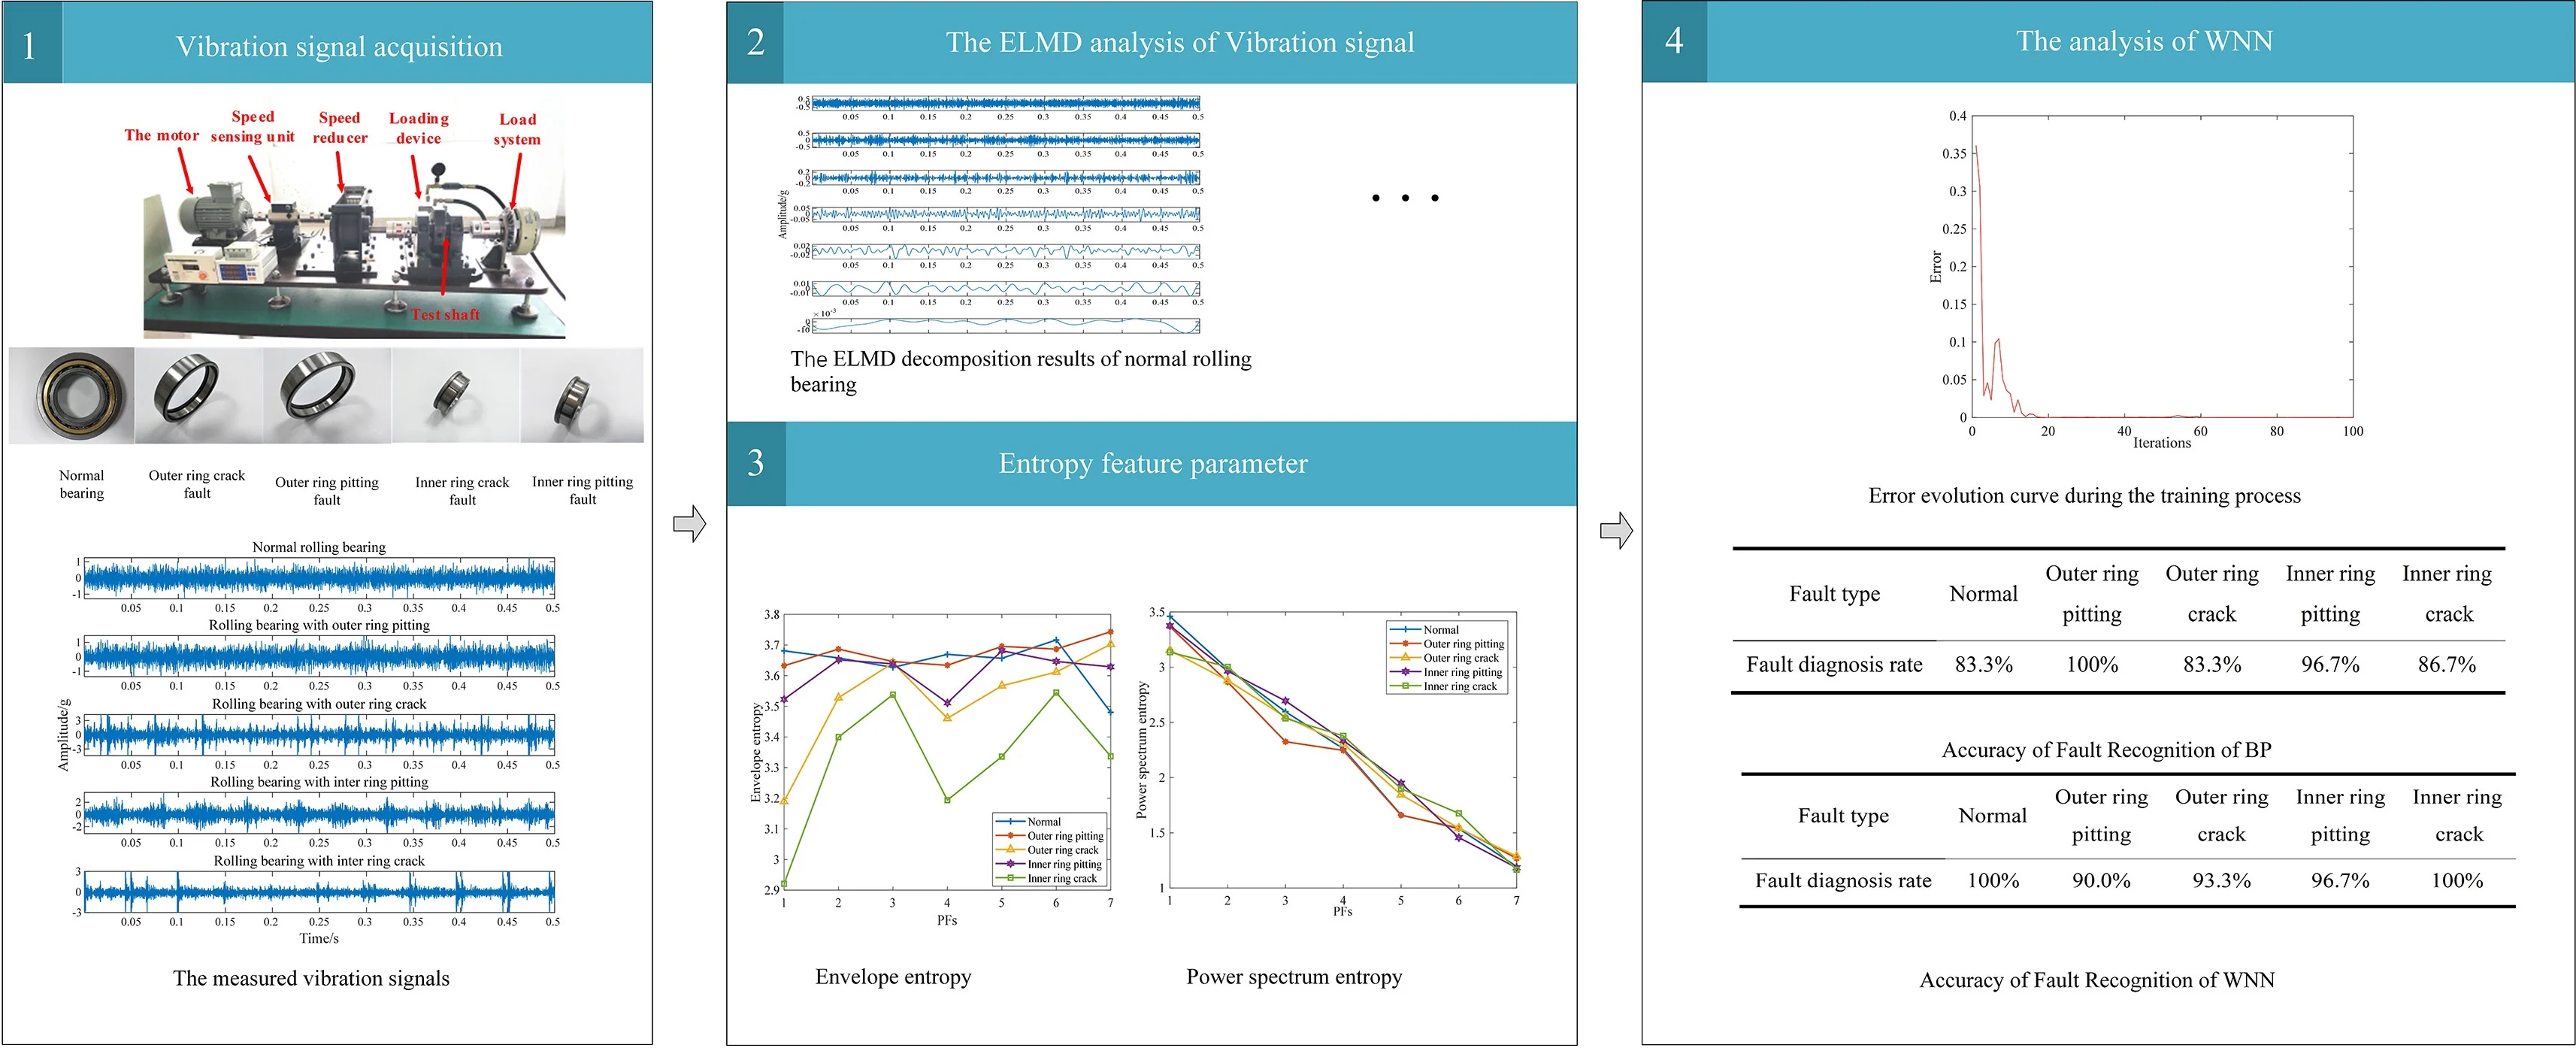
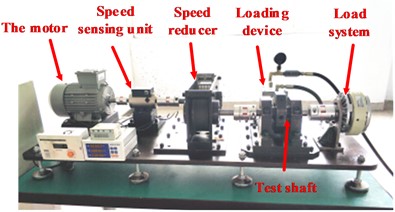
The proposed method is verified by using a rolling bearing fault test bed, and the test bed is composed of a motor, speed sensing unit, speed reducer, test shaft, loading device, and load system. The rolling bearing fault test bed is shown in Fig. 3.
Fig. 3Rolling bearing fault test-bed
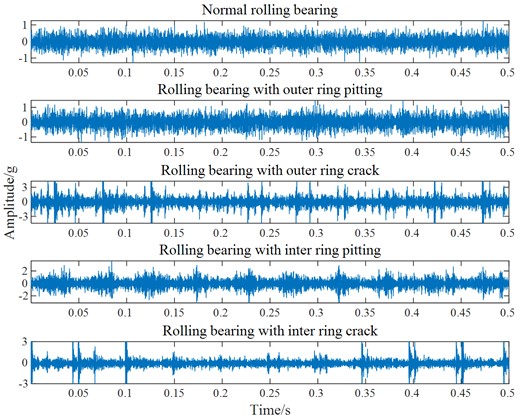
A three-axis distributed vibration sensor is used to collect the vibration signal in this experiment, as shown in Fig. 4. Five rolling bearing states are selected for simulation in the vibration signal experiment, namely normal rolling bearing, rolling bearing with outer ring pitting, rolling bearing with outer ring crack, rolling bearing with inner ring pitting and rolling bearing with inner ring crack, as shown in Fig. 5. The motor speed is set as 50 Hz, and the sampling frequency is set as 20000 Hz. The measured vibration signals are shown in Fig. 6.
Fig. 4The three-axis distributed vibration sensor
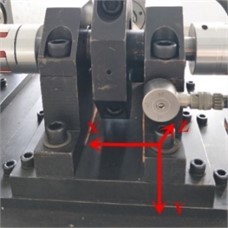
Fig. 5Tested bearings
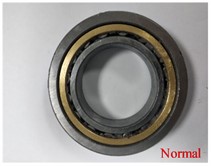
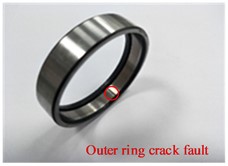
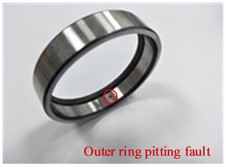
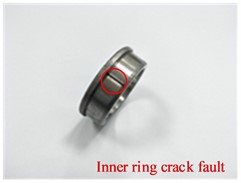
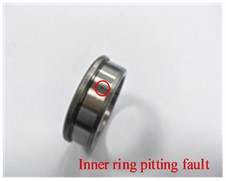
Fig. 6The measured vibration signals
4. Experimental validation
4.1. The ELMD analysis of vibration signal
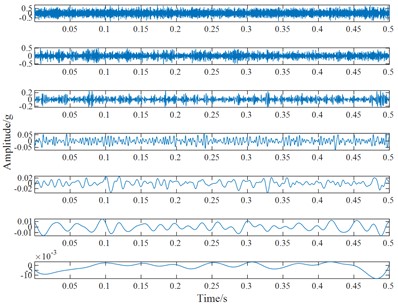
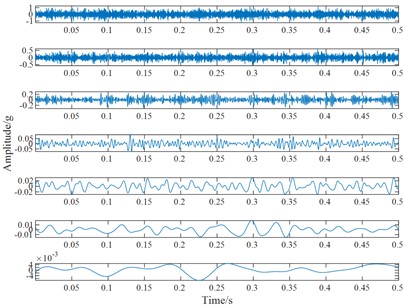
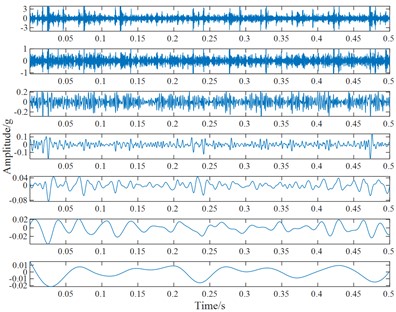
The vibration signal measured in the test bed is analyzed, it can be seen from Fig. 6 that useful information cannot be obtained from the time-domain waveform. The above vibration signals are decomposed by ELMD, and Gaussian white noise with a standard deviation of 0.2 is added 100 times in each decomposition. The original vibration signal is decomposed into 7 PF components by ELMD, and that is arranged from high frequency to low frequency, as shown in Fig. 7(a)-(e).
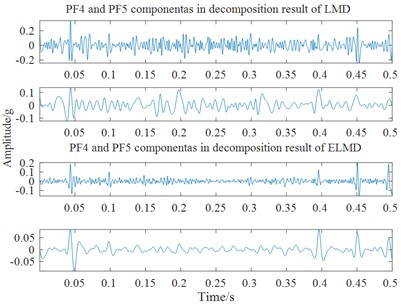
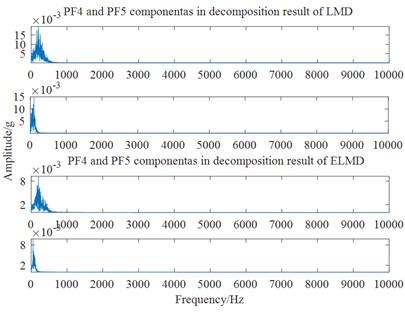
To compare the decomposition results between LMD and ELMD, we use a rolling bearing with an inner ring crack as an example, and the comparison is shown in Fig. 8. The chaotic impact signal in the LMD decomposition result appears, and there is no periodicity, it shows a certain mode aliasing phenomenon. While the decomposition results in ELMD have less impact component, and it is clear and regular, it also inhibits a part of modal aliasing, impact signal in the PF component in the medium and lower frequency band is significantly improved.
Fig. 7The ELMD decomposition results
a) The ELMD decomposition results of normal rolling bearing
b) The ELMD decomposition results of the rolling bearing with outer ring pitting
c) The ELMD decomposition results of the rolling bearing with an outer ring crack
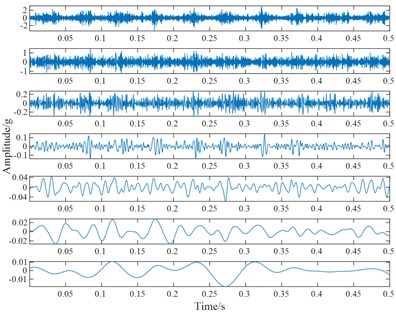
d) The ELMD decomposition results of the rolling bearing with inner ring pitting
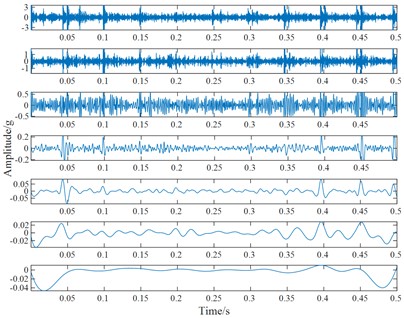
e) The ELMD decomposition results of the rolling bearing with an inner ring crack
Fig. 8The comparison of the decomposition results between LMD and ELMD
4.2. Quanfied extraction of hybrid features
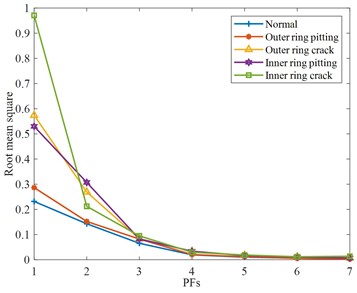
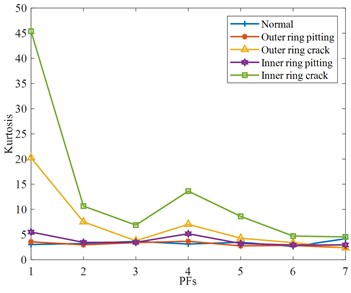
ELMD decomposes the relevant fault feature information into each PF component, with the key step being the quantitative extraction of this feature information. This paper extracts fault hybrid features, including time-domain features such as kurtosis, root mean square, waveform factor, margin factor, peak factor, envelope entropy, and power spectrum entropy. The feature weights calculated by the multi-label feature selection algorithm (ReliefF) are shown in Table 2, the extracted time-domain features in Fig. 9, and the envelope entropy and power spectrum entropy in the various rolling bearing states are shown in Fig. 10.
Table 2Feature weights of the ReliefF algorithm at each PF component
PF1 | PF2 | PF3 | PF4 | PF5 | PF6 | PF7 | |
Root mean square | 0.694 | 0.205 | 0.056 | 0.018 | 0.006 | 0.001 | –0.001 |
Kurtosis | 0.384 | 0.011 | 0.079 | –0.008 | 0.178 | –0.019 | 0.553 |
Waveform factor | –0.316 | –0.103 | –0.042 | 0.216 | 0.138 | –0.143 | 0.484 |
Margin factor | 0.672 | 0.211 | 0.046 | 0.198 | 0.074 | 0.001 | –0.004 |
Peak factor | 0.681 | 0.247 | 0.081 | 0.205 | 0.088 | 0.026 | 0 |
Envelope entropy | 0.448 | –0.015 | –0.016 | 0.176 | -0.021 | 0.018 | 0.375 |
Power spectrum entropy | 0.694 | 0.534 | 0.391 | 0.331 | 0.151 | 0.079 | 0 |
Fig. 9Time-domain feature parameters of various rolling bearing states of various rolling bearing states
a) Root mean square
b) Kurtosis
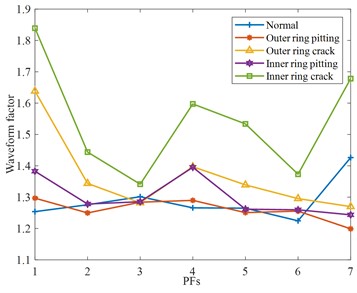
c) Waveform factor
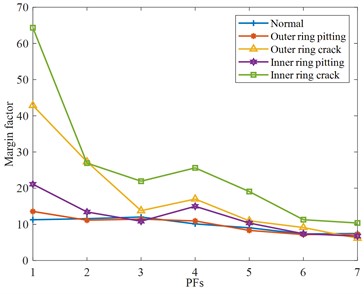
d) Margin factor
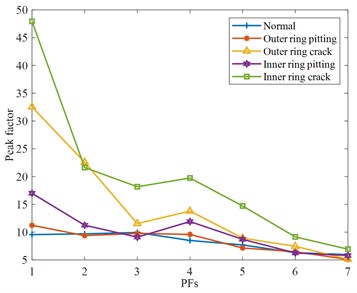
e) Peak factor
The ReliefF algorithm cannot effectively remove redundant features when selecting features, and the weight value is often positively correlated with the absolute value of features. Therefore, the difference between different faults in different frequency domains cannot be well distinguished, resulting in inaccurate feature selection. Therefore, this paper manually selects features in different frequency domains to improve the rationality and accuracy of feature selection.
In Fig. 9(a), the root means square is sensitive to faults in the high-frequency domain. In Fig. 9(b), the kurtosis of the PF component of normal bearing is relatively stable, and the kurtosis of each fault at the PF4 component is different. In Fig. 9(c), the characteristic components of different fault waveform factors have obvious differentiation and a large variation range. In Fig. 9(d)-(e), both the margin factor and peak factor are very stable in describing normal bearings, and both have a higher recognition degree for crack bearings, and there is a certain rule at PF4.
In Fig. 10(a), the envelope entropy of normal bearings is relatively stable, without obvious differentiation, but the signal differentiation of other fault rolling bearings is more serious, especially the rolling bearing with crack fault, which will be significantly increased or reduced. In Fig. 10(b), some PF components are not very different from normal rolling bearings, but some PF components, such as the PF5 components of the rolling bearing with outer ring crack, rolling bearing with inner ring pitting, and rolling bearing with inner ring crack, are greatly different from normal rolling bearing. However, the PF component of the same faults fluctuates less and shows an overall downward trend. To sum up, by analyzing the extraction results of each feature parameter, the PF components of each feature parameter that can best reflect the characteristic state are selected respectively. They include the root mean square of the PF1 component, the waveform factor of the PF7 component, the kurtosis, margin factor, peak factor, and envelope spectrum entropy of the PF4 component, the power spectrum entropy of PF3 components.
Fig. 10Entropy feature parameter of various rolling bearing states
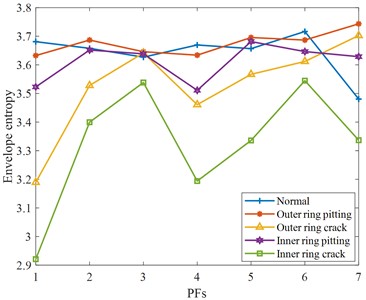
a) Envelope entropy
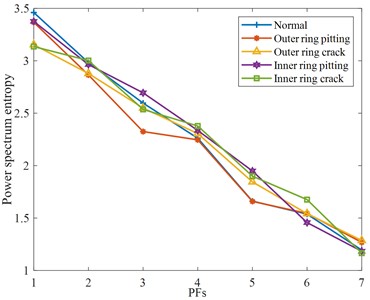
b) Power spectrum entropy
4.3. The analysis of WNN
Firstly, BP neural network is used for data training and learning. Through continuous parameter modification, the model of the BP neural network tends to be complete, and the learning rate is 0.01 at this time. The prediction accuracy rate of the neural network for five kinds of bearing fault models is shown in Table 3.
Table 3Accuracy of fault recognition of BP
Fault type | Normal | Outer ring pitting | Outer ring crack | Inner ring pitting | Inner ring crack |
Fault diagnosis rate | 83.3 % | 100 % | 83.3 % | 96.7 % | 86.7 % |
In Table 3, the overall fault recognition rate of the BP neural network is not high. In addition to the recognition accuracy of the second type of outer ring pitting bearing, the recognition effect of other types of bearings is not particularly good.
Since the BP neural network prediction is not particularly ideal, then the wavelet neural network is used to process the data. Using the wavelet function to replace the hidden layer function of the BP neural network, the fuzzy problem of the hidden layer of the BP neural network can be effectively improved. The designed WNN includes three layers, the input layer, the hidden layer, and the output layer. The neuron number of the input layer is 10, corresponding to the extracted hybrid feature parameters previously, and the hidden layer nodes are composed of wavelet functions. The neuron number of the output layer is 5, corresponding to 5 rolling bearing states. A total of 250 samples composed from the first 50 sets of each rolling bearing state are selected as the training samples, and the remaining 150 sets of samples are used as testing samples to test the diagnostic performance of the proposed method. The normalization processing is conducted before training, the weights are set to 0.01, the learning rate is set to 0.001, and the iterations are set to 100. The error evolution curve during the training process is shown in Fig. 11, and the fault diagnosis rate is shown in Table 4.
Fig. 11Error evolution curve during the training process
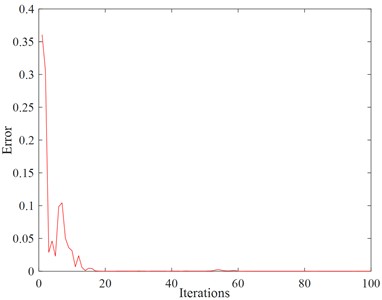
Table 4Accuracy of fault recognition of WNN
Fault type | Normal | Outer ring pitting | Outer ring crack | Inner ring pitting | Inner ring crack |
Fault diagnosis rate | 100 % | 90.0 % | 93.3 % | 96.7 % | 100 % |
It can be seen from the results that the error in the preliminary iteration process is large, and the error becomes smaller and smaller as the number of iterations increases. The testing samples are used to test the proposed method, and the overall diagnosis rate of WNN is high. Among them, the recognition rate of normal and inner ring crack faults is the highest, reaching 100 %, the recognition rate of other fault types is also above 90 %, and the overall recognition rate reached 96 %. That can prove that the proposed method is effective and can solve the problem of fault detection of the rolling bearing in electromechanical equipment.
5. Conclusions
To improve the accuracy of bearing fault diagnosis under the interference of strong noise, a fault diagnosis model based on ELMD hybrid features extraction and wavelet neural network recognition is established in this paper. ELMD was used to decompose the signal, and the distinction between different faults by ReliefF and hybrid feature parameter extraction method was compared and analyzed, as well as the accuracy of the BP neural network and WNN neural network in fault identification. Through the analysis of experimental data, the effectiveness of this method is verified, and the following conclusions can be drawn:
1) ELMD can effectively eliminate the mode aliasing caused by LMD decomposition.
2) The hybrid feature parameter extraction method can effectively remove the phenomenon of feature redundancy generated by the traditional feature selection algorithm when extracting signals, effectively distinguish fault types, and increase the accuracy of fault identification.
3) WNN can effectively improve the fuzzy of a hidden layer of the BP neural network and enhance the accuracy of fault identification.
References
-
K. Gu, Y. Zhang, X. Liu, H. Li, and M. Ren, “DWT-LSTM-based fault diagnosis of rolling bearings with multi-sensors,” Electronics, Vol. 10, No. 17, p. 2076, 2021, https://doi.org/10.3390/electro-nics10172076
-
J. P. Salameh, S. Cauet, E. Etien, A. Sakout, and L. Rambault, “Gearbox condition monitoring in wind turbines: A review,” Mechanical Systems and Signal Processing, Vol. 111, pp. 251–264, Oct. 2018, https://doi.org/10.1016/j.ymssp.2018.03.052
-
J. Zheng, S. Cao, H. Pan, and Q. Ni, “Spectral envelope-based adaptive empirical Fourier decomposition method and its application to rolling bearing fault diagnosis,” ISA Transactions, Vol. 129, pp. 476–492, Oct. 2022, https://doi.org/10.1016/j.isatra.2022.02.049
-
Y. Li, W. Peng, X. Zhu, G. Wei, H. Yu, and G. Qian, “Based on short-time Fourier transform impulse frequency response analysis in the application of the transformer winding deformation,” in 2016 IEEE International Conference on Mechatronics and Automation, pp. 371–375, Aug. 2016, https://doi.org/10.1109/icma.2016.7558591
-
N. E. Huang et al., “The empirical mode decomposition and the Hilbert spectrum for nonlinear and non-stationary time series analysis,” Proceedings of the Royal Society of London. Series A: Mathematical, Physical and Engineering Sciences, Vol. 454, No. 1971, pp. 903–995, Mar. 1998, https://doi.org/10.1098/rspa.1998.0193
-
Jingsong Li, Chi Zhao, and Hang Su, “A mode mixing elimination method of HHT in fault detection,” in 2nd International Conference on Cloud Computing and Internet of Things (CCIOT), pp. 120–123, Oct. 2016, https://doi.org/10.1109/cciot.2016.7868316
-
R. Wang, L. Yu, H. Fang, L. Yu, J. Chen, and C. Shen, “Cyclic correlation density decomposition based on a sparse and low-rank model for weak fault feature extraction of rolling bearings,” Measurement, Vol. 198, p. 111393, Jul. 2022, https://doi.org/10.1016/j.measurement.2022.111393
-
Y. Lei, Z. He, Y. Zi, and X. Chen, “New clustering algorithm-based fault diagnosis using compensation distance evaluation technique,” Mechanical Systems and Signal Processing, Vol. 22, No. 2, pp. 419–435, Feb. 2008, https://doi.org/10.1016/j.ymssp.2007.07.013
-
S. Cho, M. Choi, Z. Gao, and T. Moan, “Fault detection and diagnosis of a blade pitch system in a floating wind turbine based on Kalman filters and artificial neural networks,” Renewable Energy, Vol. 169, pp. 1–13, May 2021, https://doi.org/10.1016/j.renene.2020.12.116
-
B. Yang, J. W. Zhang, G. R. Fan, and J. G. Wang, “Application of OPMCKD and ELMD in bearing compound fault diagnosis,” Journal of Vibration and Shock, Vol. 38, No. 11, p. 59, 2019, https://doi.org/10.13465/j.cnki.jvs.2019.11.010
-
Y. Cheng, D. Zou, W. Zhang, and Z. Wang, “A hybrid time-frequency analysis method for railway rolling-element bearing fault diagnosis,” Journal of Sensors, Vol. 2019, pp. 1–12, Jan. 2019, https://doi.org/10.1155/2019/8498496
-
J. Chen, B. Xu, and X. Zhang, “A vibration feature extraction method based on time-domain dimensional parameters and Mahalanobis distance,” Mathematical Problems in Engineering, Vol. 2021, No. 7, pp. 1–12, Jul. 2021, https://doi.org/10.1155/2021/2498178
-
X. Chen, “Research on gear fault degree recognition method based on multi sensor fusion,” IOP Conference Series: Materials Science and Engineering, Vol. 892, No. 1, p. 012088, Jul. 2020, https://doi.org/10.1088/1757-899x/892/1/012088
-
Z. Chen, C. K. Yeo, B. S. Lee, and C. T. Lau, “Power spectrum entropy based detection and mitigation of low-rate DoS attacks,” Computer Networks, Vol. 136, pp. 80–94, May 2018, https://doi.org/10.1016/j.comnet.2018.02.029
-
Q. Zhang and A. Benveniste, “Wavelet networks,” IEEE Transactions on Neural Networks, Vol. 3, No. 6, pp. 889–898, 1992, https://doi.org/10.1109/72.165591
-
C. Yang, Z. Wu, T. Peng, H. Zhu, and C. Yang, “A fractional steepest ascent Morlet wavelet transform-based transient fault diagnosis method for traction drive control system,” IEEE Transactions on Transportation Electrification, Vol. 7, No. 1, pp. 147–160, Mar. 2021, https://doi.org/10.1109/tte.2020.2994216
Cited by
About this article

This research was funded by the National Natural Science Foundation of China (Grant No. 51905147), and the Natural Science Foundation of Jiangsu Province (Grant No. BK20201163).
The datasets generated during and/or analyzed during the current study are available from the corresponding author on reasonable request.
The authors declare that they have no conflict of interest.
