Abstract
For motor rolling bearing fault diagnosis, vibration signal analysis is a common method to extract sensitive fault characteristics. In this paper, a newly signal processing method, multivariate variational mode decomposition (MVMD), is proposed to extract features from motor rolling bearings. The MVMD was carried out on the motor rolling bearings state signals of different categories, and the prior parameter value which had a great influence on the decomposition effect was analyzed. Each component obtained by decomposition was measured in the form of energy entropy (EE), and the measured feature information was classified and identified by support vector machine (SVM) classifier. Meanwhile, the grey wolf optimization (GWO) was used to optimize the parameters of the classifier network to further improve the recognition accuracy. Through the simulation results, it is found that the scheme can achieve 100 % effect on the diagnosis rate of normal working condition, outer ring fault, inner ring fault and rolling element fault under the condition of different load and speed of the motor rolling bearing.
1. Introduction
Rotating machinery has a wide range of applications in chemical industry, electric power, metallurgy, machinery manufacturing and other fields, rotating machinery equipment failure may cause local damage, huge economic losses and even casualties, a large number of studies show that bearing failure accounts for 30 % of rotating machinery failures [1]. An in-depth study of bearing condition monitoring and fault diagnosis is of great significance for equipment maintenance and cost reduction. The essence of rolling bearing fault diagnosis is fault type identification process and fault feature information extraction are a key step to accurately identify fault types. Because the vibration signal of rolling bearing has the characteristics of nonlinear and non-stationary, it is easy to be interfered by hardware equipment and the surrounding environment in the process of signal acquisition. Therefore, it is the key of fault diagnosis to extract the sensitive feature information from the complex signals of rolling bearings [2].
Empirical mode decomposition (EMD) is a time-frequency analysis method to deal with unstable and nonlinear vibration signals, which is widely used in the field of mechanical fault diagnosis. Reference [3] proposed a rolling bearing model based on permutation entropy and EMD. In order to achieve accurate diagnosis of rolling bearing faults under random noise, reference [4] proposed a new rolling bearing fault diagnosis method based on ensemble empirical mode decomposition (EEMD). First, the EEMD method was used to decompose the original vibration signal into several intrinsic mode functions (IMFs), then the correlation coefficient and kurtosis were used to remove the excess components, and the remaining IMFs were used to reconstruct the signal. Reference [5] proposes a rolling bearing fault diagnosis method that combines the complementary integrated EMD method with related theories. The correlation coefficient between the original signal and each IMFs is calculated to reduce the noise and select the effective IMFs. The experimental results show that the method is effective in the detection of bearing faults and can detect faults in the early stage. It has high computational efficiency and can overcome modal mixing and aliasing.
Reference [6] proposed a rolling bearing fault diagnosis method based on fully integrated EMD with adaptive noise. Firstly, the vibration signal is decomposed by complete ensemble empirical mode decomposition (CEEMDAN), and the eigenmode function containing the main fault information is selected by the frequency-domain correlation coefficient method. Reference [7] proposes an intelligent fault diagnosis method based on local mean decomposition (LMD) and singular value decomposition (SVD) and extreme learning machine (ELM). The experimental results show that the method can accurately diagnose and identify the fault types of rolling bearings under different working conditions in a short time. Reference [8] combined least squares support vector machines (LS-SVM) and EMD, and proposed a new method to improve the performance of traditional EMD. A representative IMFs containing fault information were selected for demodulation analysis and fault characteristics were identified. Reference [9] studies a method of diagnosing distributed bearing faults by vibration analysis. The resulting vibration patterns are modeled by incorporating geometric defects in the bearing components. Local faults and distributed faults can be distinguished by comparing the envelope spectrum of vibration signals. In order to obtain bearing fault characteristics, a fuzzy clustering fault diagnosis method based on variational mode decomposition (VMD) and SVD was proposed in [10]. Vibration signal analysis is a common method to extract sensitive fault features. Vibration signals are usually polluted by noise, so the extracted features cannot provide sufficient bearing fault information. Reference [11] introduces a new vibration signal denoising and bearing fault identification technology based on empirical wavelet transform (EWT). Reference [12] proposed a rolling bearing fault diagnosis method based on convolutional neural network and support vector machine. Firstly, the one-dimensional original vibration signal is transformed into two-dimensional time-frequency image by continuous wavelet transform. Secondly, the obtained time-frequency images are input to train the constructed model. Finally, the fault location and severity are diagnosed. The results show that this method has high diagnostic accuracy and stability.
Reference [13-15] also adopts deep learning feature extraction methods such as convolutional neural network and generative adversarial network to extract fault feature, respectively to extract motor bearing fault state feature from the perspective of deep learning. Reference [16] proposed a signal decomposition algorithm based on iterative variational mode extraction recursive variational mode extraction reference [17] proposes a new method to segment spectrum from the frequency domain and accurately filter fault information -Fast Entrogram (FE). Simulation results show that this method can extract periodic pulses effectively. Experimental results show that this method can be used to diagnose the inner and outer rings of bearings. A set of intelligent motor rolling bearing fault diagnosis method from fault feature information extraction to machine learning is gradually adopted by scholars.
Reference [18] developed a new multivariate variational mode decomposition (MVMD) method, which is the latest signal processing method and data mining technology, and this method was embedded in the rolling bearing fault diagnosis in this paper. The vibration signal of the motor rolling bearing was decomposed into several mode components, and the energy entropy eigenvalue of each mode component was measured. The obtained eigenvalue was classified by support vector machine (SVM), and the intelligent algorithm grey wolf optimization (GWO) was used to optimize the parameters of the classification network, so as to further improve the recognition effect of the network.
The rest of this paper includes: In Section 2, the theoretical introduction to the method; In Section 3, the analysis of the experimental process and results; In Section 4, the conclusion of the article.
2. Methodology
2.1. Multivariate variational mode decomposition
The MVMD method extends VMD algorithm from one-dimensional to multidimensional, which provides great convenience for processing multi-variable or multi-channel data, and ensures component frequency consistency during multi-channel decomposition [13]. MVMD method for component method is based on the input data of all the channel between the common frequency component, in the process of signal decomposition is introduced into the variational model, construct a change model of the optimal solution of the problem, in this process, the channel mode of component and iterative update its center frequency and bandwidth, which can be adaptive to component of narrow band mode [18].
Given input multivariate signal , MVMD can extract pre-defined multivariate modulated oscillation signals containing channel data [19]-[21]:
where ,
To complete the iteration of MVMD algorithm, the following two conditions should be met:
1) The sum of bandwidth of the extracted modes is minimum;
2) The sum of the extracted modes can recover the original signal .
The variational problem solved by MVMD can be expressed by the following equation:
where in the above formula, is the partial derivative of time. is the vector expression of :
where in the above formula, stands for augmented Lagrange function, is the punishment factor. is the set of multivariable modulated oscillating signals in channel , is the central frequency set of , the is the Lagrange multiplier. for inner product. For minimization problems related to pattern update, its equivalent optimization form is:
where in the above formula, is the number of iterations. This function is similar to the mode update of the original VMD in form, and the following mode update relation can be given by using Eq. (4):
where in the above formula, and are the Fourier transform of the corresponding time domain signal. Simplification problem:
Let the first derivative of the above quadratic function Eq. (6) be 0, minimize the sum of quadratic functions, and then carry out algebraic operation, we can get:
where is the updated center frequency.
2.2. Energy entropy
The frequency distribution of motor bearing vibration signals in normal working state is different from that in different faults, that is, the energy distribution of vibration signals is different. Using the percentage of signal energy of each frequency band in the total energy and energy entropy (EE), the feature vector can be used to reflect the running state of the bearing [22].
After MVMD decomposition of bearing vibration signal, can be obtained:
where is energy, is the energy percentage and is the energy entropy of each mode component.
The mode component obtained by decomposition contains different frequency components and has different energy characteristics, which constitutes the energy distribution of motor bearing vibration signal in the frequency domain. The motor bearing fault feature vector is constructed by it:
2.3. Grey wolf optimization
The GWO algorithm is a new meta-heuristic optimization algorithm proposed by Mirjalili S. et al. [23]. The algorithm has good convergence speed and optimization accuracy, and has been widely used in many fields. The grey wolf optimization algorithm simulates the hierarchy leadership mechanism of the social organization of the grey wolf population, including the group hunting behavior from hunting prey, circling prey to hunting, and obtains the position of the optimal solution through continuous iterative optimization. The GWO algorithm can imitate the wolf pack behavior process, which is mainly divided into three steps: encircle, hunt and attack. Inside the pack, there are four types of search individuals in descending order: , , and .
In this process, the species will circle its prey to find the best route to hunt. The location of target and optimal population in the encircling stage can be determined by Eq. (12-13) [23], [24]:
where the is the current number of iterations, , and are the coefficient vectors, is the target optimal solution vector (the location of prey), is the current position vector of a search individual, and is the next moving direction vector. and can be represented as follows [24]:
where the is the maximum number of iterations, a linearly decreases from 2 to 0 as the number of iterations increases, and and are the random vectors between [0, 1]. According to Eq. (15-16), the location of the points around the optimal solution can be searched by adjusting the size of the coefficient vectors of and to ensure the local optimization ability of the algorithm. and are random numbers between [0, 1], so the optimization population can find all the paths of the attacking target, while ensuring the global search ability of the algorithm.
When hunting and attacking prey, moves in the next step according to the signals sent by , and to judge whether it is close to the target or far away. The specific process can be expressed by Eq. (17-19) [23]-[25]:
where , and are the direction vectors between , , and , respectively. The , and are respectively , and to determine the direction vector of next move.
2.4. GWO-SVM
The SVM has good performance for small sample classification learning. However, during network learning, the training network parameters need to be set, among which the penalty factor parameters () and kernel function parameters () in the network have a great influence on the classification results. The GWO algorithm realized the modeling of the whole iterative optimization process according to the hierarchical division of labor system and hunting behavior of wolves. In this paper, the GWO algorithm is applied to the measured energy entropy feature extraction value to optimize the parameters of network classification. Through different training samples of the input network, a group of appropriate and values are selected to better improve the network training performance and further improve the classification results.
3. Experiments and results
3.1. Flow chart of experiment
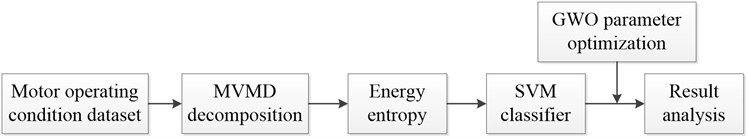
The whole process of the experiment is shown in Fig. 1. Firstly, data sets of different working conditions of the motor rolling bearing are collected. Then MVMD decomposition is performed on the data set to obtain sub-band signals containing different characteristic information. The energy entropy of the decomposed sub-band signals was measured, and the energy features were classified by SVM classifier. The optimization algorithm GWO was used to optimize the parameters of the classification network to further improve the recognition accuracy. Finally, the recognition results were analyzed.
Fig. 1Motor rolling bearing fault diagnosis flow chart
3.2. Experimental data and simulation environment
The data set used in the experiment was obtained from the bearing failure simulation test bench in the laboratory of Case Western Reserve University, Fan end bearing model is SKF6205 deep groove ball bearing. Local damage of rolling bearing is single point damage by electro-discharge machining (EDM). Data of fault driving end of rolling element are selected. The rolling bearing equipment of the experimental motor is shown in Fig. 2, and its structural parameters are shown in Table 1. In the motor 0 HP/1797 r/min, 1 HP/1772 r/min, 2 HP/1750 r/min and 3 HP/1730 r/min four working conditions (data 1~data 4), take different training sample sets and test sample sets. The normal working state, inner ring fault, rolling element fault and outer ring fault are classified and identified. The specific sample set used in the experiment is shown in Table 2. The four groups of data correspond to four different working states of the motor rolling bearing.
Fig. 2Experimental data acquisition equipment for motor rolling bearing
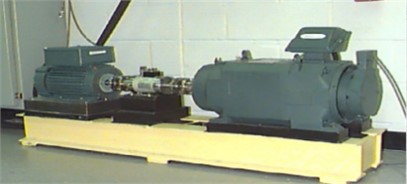
Table 1Structural parameters of motor rolling bearings
Outside diameter | Pitch diameter | Inside diameter | Ball number | Ball diameter | Contact angle |
52 mm | 39 mm | 25 mm | 9 | 7.94 mm | 0° |
Fig. 3 shows the time domain diagram of sensor vibration acceleration of data 1 under normal working state and three fault states. As can be seen from the figure, the amplitude of the collected signal under normal working condition is the smallest, and the amplitude of the inner ring is the largest. The time-domain signal diagram of the rolling element fault is close to that of the outer ring fault. It is easy to misdiagnose the fault category directly from the time domain signal diagram.
Table 2Introduction to experimental datasets
Data | HP/ r/min | Normal | Inner ring | Rolling element | Outer ring |
Data1 | 0 /1797 | X097_DE_time | X169_DE_time | X185_DE_time | X197_DE_time |
Data2 | 1/1772 | X098_DE_time | X170_DE_time | X186_DE_time | X198_DE_time |
Data3 | 2/1750 | X099_DE_time | X171_DE_time | X187_DE_time | X199_DE_time |
Data4 | 3/1730 | X100_DE_time | X172_DE_time | X188_DE_time | X200_DE_time |
Fig. 3Working state of Data 1 motor
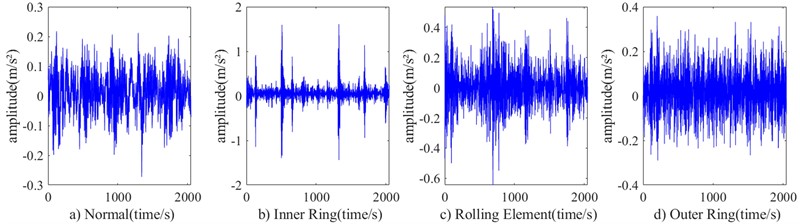
Fig. 4 shows the information features of different scales obtained by MVMD when MVMD decomposes the time-domain vibration signals in four working states of the motor in data 1. Fig. 4(a1)-(a4) is the decomposition time domain diagram under normal working condition, Fig. 4(b1)-(b4) is the decomposition time domain diagram under inner ring fault working condition, Fig. 4(c1)-(c4) is the decomposition time domain diagram under rolling element fault working condition, and Fig. 4(d1)-(d4) is the decomposition time domain diagram under outer ring fault working condition. The variation trend of different working states can be seen from the subgraphs of each time domain.
Fig. 4Data1 when K= 4, the four types of signals are decomposed by MVMD: a1)-a4) normal; b1)-b4) inner ring; c1)-c4) rolling element; d1)-d4) outer ring
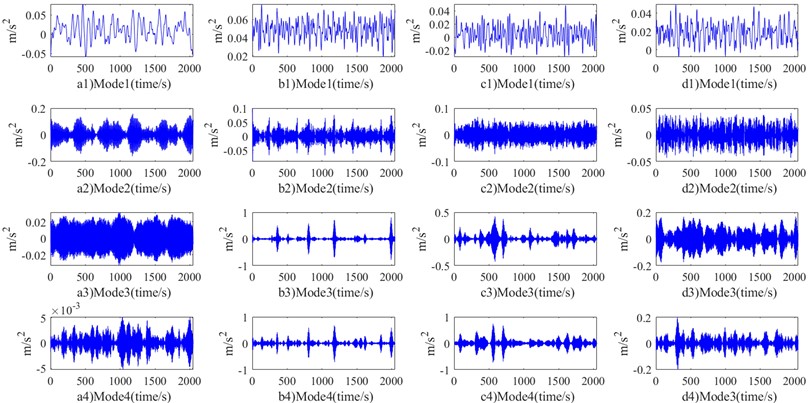
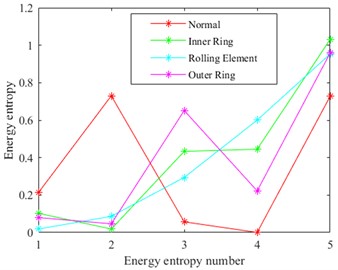
Fig. 5 shows the energy entropy measurement characteristic values of different scale information of MVMD decomposition. It can be seen from the characteristic values that the state modes of different motors rolling bearing work differently in the measurement values of different characteristic scale information. According to this feature, a SVM with good classification and separateness for small samples is used to classify the entropy eigenvalues of different states. Meanwhile, the optimization algorithm GWO is used to optimize the parameters of the identified and classified network, so as to further improve the classification ability of the network.
The simulation environment of this paper is the Inter (R) Core (TM) i5-8300H CPU @2.30GHz, memory 8.00GB 64-bit Windows 10 operating system for preliminary exploration. The simulation tool uses MATLAB R2020b version.
Fig. 5Energy entropy diagram of four working state signals of data1 decomposed by MVMD
3.3. The experimental results
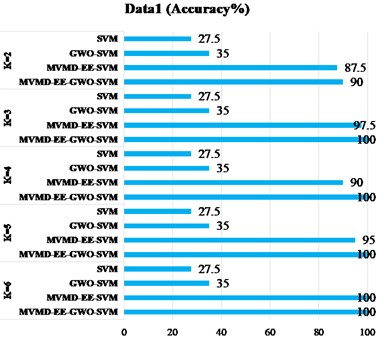
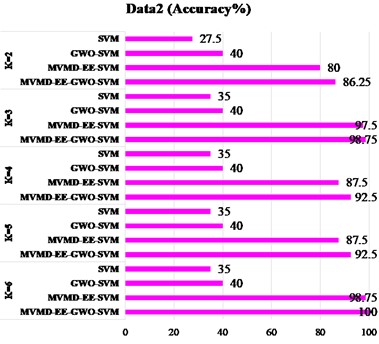
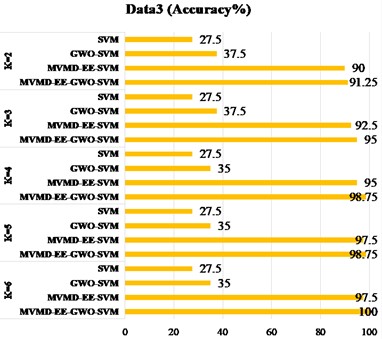
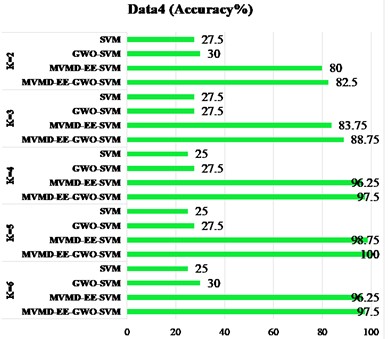
The Fig. 6 shows the result graph of recognition accuracy of four types of data sets under different feature extraction methods. The “Accuracy” in Fig. 6 represents the ratio of all predicted sample labels to actual labels in four working states of the motor rolling bearing. The closer the ratio is to 100 %, it indicates that the proposed prediction model is closer to our expectation. The subgraph (a) in Fig. 6 compares the four schemes respectively. The use “SVM” to classify directly; The “GWO-SVM” means classification of SVM network optimized by GWO; The “MVMD-EE-SVM” is used to indicate that vibration signals are decomposed first, and then classified after energy entropy measurement. The “MVMD-EE-GWO-SVM” is used to mean that vibration signals are first decomposed, then measured by energy entropy, and then GWO is used to optimize SVM classification. In the subgraphs (b) to (d) of Fig. 6, the above four schemes were used for experimental analysis of the other three sets of data. In the experiment, we analyzed the prior parameter value, which has a great influence on MVMD. The following conclusions can be drawn from the identification results: 1) Classify data in different states directly from time-domain signals, and the recognition and classification effect are poor. 2) By measuring the energy entropy characteristics of time-domain signals, the identification accuracy has been significantly improved, indicating that energy entropy can well represent the time-domain signal characteristics of mechanical vibration; 3) The four types of data are analyzed for different parameter values. According to the results, there are a small number of mismarks in the classification results of the eigenvalues measured by energy entropy, and the classification performance of the classifier is also an important index affecting the classification results. By optimizing the SVM network by GWO, the classification accuracy can reach 100 %. It provides higher feasibility for practical application.
In Table 3 to Table 6, we conducted statistical analysis on the feature extraction time and total time of four types of states in different data sets under different prior values. The unit of time given is seconds. The statistical mean and standard deviation are the results after 5 experiments. It can be intuitively seen that in all data sets, the total time of feature extraction increases with the increase of prior parameter . Among the four types of states, the longest time for comprehensive feature extraction is the rolling element fault, and the shortest is the outer ring fault. This indicates that the sensitivity of the outer circle fault diagnosis is faster. From Table 3 to Table 6, we can see that different training samples and test samples are respectively used for analysis of the four data sets. Combined with the recognition results in Fig. 6, we give the optimal prior parameter is 3 in Table 3, in data 1. Feature extraction takes 3.04 s. The optimal prior parameter in Table 4 and Table 5 is 6 in data sets 2 and 3. The total feature extraction time is 17.20 s and 23.15 s, respectively. The optimal prior parameter in Table 6 is 5, which is in data 4. The total feature extraction time takes 17.77 s. Table 7 shows the recognition results under different states when the extracted eigenvalues of energy entropy are directly classified in different data sets with different values. Table 7 lists the comparison results of predicted value labels and actual value labels of different test samples under four working conditions of motor rolling bearing. It can be seen from the results that among the four types of states, the sensitivity of the recognition effect of rolling element is the lowest. In Table 7, we also give the optimal prior parameter values in the 4 groups of data sets. From the classification and recognition results, to the influence of eigenvalues on the classification results, the construction of classifier network is also a key part to be considered in the diagnostic pattern system. In addition, to considering the classification performance of the recognition classification network, we also need to improve the performance of the sensitivity of the diagnostic mode system, that is, we need to consider the action time of the diagnostic system. The less time it takes to diagnose, the less likely there is to be economic loss and other damage caused by the failure of rotating machinery.
Fig. 6Different scheme identification results: a) data 1; b) data 2; c) data 3; d) data 4
a)
b)
c)
d)
Table 3Feature extraction time of four states of the motor rolling bearing for different K values (Data 1)
Unit of time / s | Normal | Inner ring | Rolling element | Outer ring | Total time |
2 | 0.56±0.05 | 0.62±0.20 | 0.52±0.02 | 0.48±0.04 | 2.17±0.27 |
3* | 0.59±0.04 | 0.69±0.05 | 0.68±0.01 | 1.09±0.02 | 3.04±0.07 |
4 | 1.35±0.02 | 1.86±0.06 | 2.20±0.02 | 1.77±0.06 | 7.18±0.07 |
5 | 2.48±0.04 | 2.15±0.02 | 2.53±0.10 | 1.63±0.03 | 8.80±0.13 |
6 | 3.08±0.03 | 2.46±0.02 | 4.66±0.03 | 1.62±0.06 | 11.83±0.04 |
Train/Test | 10/10 | 10/10 | 10/10 | 10/10 | – |
Table 4Feature extraction time of four states of the motor rolling bearing for different K values (Data 2)
Unit of time / s | Normal | Inner ring | Rolling element | Outer ring | Total time |
2 | 0.73±0.04 | 0.91±0.04 | 0.70±0.08 | 0.66±0.05 | 3.01±0.08 |
3 | 0.92±0.07 | 1.03±0.04 | 1.10±0.09 | 1.14±0.04 | 4.19±0.12 |
4 | 1.52±0.04 | 2.02±0.03 | 2.64±0.03 | 1.57±0.02 | 7.76±0.07 |
5 | 2.87±0.03 | 2.92±0.07 | 3.43±0.12 | 1.99±0.07 | 11.21±0.09 |
6* | 3.69±0.06 | 5.36±0.04 | 5.82±0.19 | 2.33±0.07 | 17.20±0.18 |
Train/Test | 10/20 | 10/20 | 10/20 | 10/20 | – |
Table 5Feature extraction time of four states of the motor rolling bearing for different K values (Data 3)
Unit of time / s | Normal | Inner ring | Rolling element | Outer ring | Total time |
2 | 0.83±0.12 | 1.06±0.07 | 0.89±0.07 | 0.99±0.20 | 3.77±0.33 |
3 | 1.24±0.06 | 1.33±0.05 | 1.35±0.05 | 1.53±0.08 | 5.46±0.14 |
4 | 2.89±0.09 | 2.34±0.14 | 3.19±0.08 | 2.06±0.09 | 10.48±0.36 |
5 | 3.49±0.12 | 4.25±0.16 | 5.44±0.10 | 2.31±0.03 | 15.49±0.23 |
6* | 5.58±0.18 | 7.12±0.14 | 7.36±0.05 | 3.08±0.06 | 23.15±0.25 |
Train/Test | 20/20 | 20/20 | 20/20 | 20/20 | – |
Table 6Feature extraction time of four states of the motor rolling bearing for different K values (Data 4)
Unit of time / s | Normal | Inner ring | Rolling element | Outer ring | Total time |
2 | 0.91±0.04 | 1.14±0.03 | 1.06±0.03 | 1.16±0.03 | 4.27±0.06 |
3 | 1.49±0.02 | 1.70±0.04 | 1.69±0.03 | 2.07±0.07 | 6.95±0.15 |
4 | 3.53±0.09 | 4.06±0.03 | 4.16±0.05 | 2.83±0.01 | 14.59±0.10 |
5* | 4.02±0.16 | 5.79±0.05 | 4.96±0.02 | 3.01±0.01 | 17.77±0.18 |
6 | 7.88±0.24 | 8.20±0.20 | 7.47±0.15 | 4.05±0.09 | 27.60±0.33 |
Train/Test | 30/20 | 30/20 | 30/20 | 30/20 | – |
Table 7The identification results of different test sets under the four types of motor rolling bearing states
Working states | Normal | Inner ring | Rolling element | Outer ring |
Best | (Number of actual labels / Predict the number of labels) | |||
Data 1 (3) | 10/10 | 10/10 | 10/9 | 10/10 |
Data 2 ( 6) | 20/19 | 20/20 | 20/20 | 20/20 |
Data 3 ( 6) | 20/20 | 20/20 | 20/18 | 20/20 |
Data 4 ( 5) | 20/20 | 20/20 | 20/19 | 20/20 |
4. Conclusions
According to the time domain signal changes of motor rolling bearings under different working conditions, the method of combining MVMD and energy entropy was proposed to extract the features of vibration signals and measure the transformation. The prior parameter values of MVMD were analyzed, and the measured eigenvalues were introduced into the SVM classifier for classification recognition. At the same time, the optimization algorithm GWO was used to optimize the parameters of the identified network, so as to further improve the recognition results of different working states of bearings.
The results show that in the four working states of motor bearings, the fault diagnosis of rolling element is more challenging and the time sensitivity of diagnostic action is higher. From the results of four types of data identification, the scheme proposed in this paper can achieve the optimal effect in the four types of motor working conditions.
In the future, how to adaptively select the prior parameter value in our use of MVMD decomposition of different motor rolling bearing vibration acceleration signals, is our next research work. In addition, the time cost of the feature is related to the sensitivity of the fault diagnosis system. The time to speed up feature extraction is also an important diagnostic index we will consider in the next step. It can be seen from the research results that the identification effect of rolling element fault diagnosis is the worst. The next step will be to further analyze the vibration acceleration signal of rolling element to further improve the diagnosis effect.
References
-
S. R. Saufi, Z. A. B. Ahmad, M. S. Leong, and M. H. Lim, “An intelligent bearing fault diagnosis system: A review,” MATEC Web of Conferences, Vol. 255, p. 06005, 2019, https://doi.org/10.1051/matecconf/201925506005
-
Wei, Li, Xu, and Huang, “A review of early fault diagnosis approaches and their applications in rotating machinery,” Entropy, Vol. 21, No. 4, p. 409, Apr. 2019, https://doi.org/10.3390/e21040409
-
Q.-Q. Chen, S.-W. Dai, and H.-D. Dai, “A rolling bearing fault diagnosis method based on EMD and quantile permutation entropy,” Mathematical Problems in Engineering, Vol. 2019, pp. 1–8, Sep. 2019, https://doi.org/10.1155/2019/3089417
-
Q. Fu, B. Jing, P. He, S. Si, and Y. Wang, “Fault feature selection and diagnosis of rolling bearings based on EEMD and optimized Elman_AdaBoost algorithm,” IEEE Sensors Journal, Vol. 18, No. 12, pp. 5024–5034, Jun. 2018, https://doi.org/10.1109/jsen.2018.2830109
-
M. Li, H. Wang, G. Tang, H. Yuan, and Y. Yang, “An improved method based on CEEMD for fault diagnosis of rolling bearing,” Advances in Mechanical Engineering, 2014, https://doi.org/10.1155/2014/67620
-
S. Gao, Q. Wang, and Y. Zhang, “Rolling bearing fault diagnosis based on CEEMDAN and refined composite multiscale fuzzy entropy,” IEEE Transactions on Instrumentation and Measurement, Vol. 70, pp. 1–8, 2021, https://doi.org/10.1109/tim.2021.3072138
-
Y. Tian, J. Ma, C. Lu, and Z. Wang, “Rolling bearing fault diagnosis under variable conditions using LMD-SVD and extreme learning machine,” Mechanism and Machine Theory, Vol. 90, pp. 175–186, Aug. 2015, https://doi.org/10.1016/j.mechmachtheory.2015.03.014
-
X. Liu, L. Bo, and H. Luo, “Bearing faults diagnostics based on hybrid LS-SVM and EMD method,” Measurement, Vol. 59, pp. 145–166, Jan. 2015, https://doi.org/10.1016/j.measurement.2014.09.037
-
B. Dolenc, P. Boškoski, and Juričić, “Distributed bearing fault diagnosis based on vibration analysis,” Mechanical Systems and Signal Processing, Vol. 66-67, pp. 521–532, Jan. 2016, https://doi.org/10.1016/j.ymssp.2015.06.007
-
H. Cheng, Y. Zhang, W. Lu, and Z. Yang, “A bearing fault diagnosis method based on VMD-SVD and fuzzy clustering,” International Journal of Pattern Recognition and Artificial Intelligence, Vol. 33, No. 12, p. 19500, Nov. 2019.
-
S. N. Chegini, A. Bagheri, and F. Najafi, “Application of a new EWT-based denoising technique in bearing fault diagnosis,” Measurement, Vol. 144, pp. 275–297, Oct. 2019, https://doi.org/10.1016/j.measurement.2019.05.049
-
L. Yuan, D. Lian, X. Kang, Y. Chen, and K. Zhai, “Rolling bearing fault diagnosis based on convolutional neural network and support vector machine,” IEEE Access, Vol. 8, pp. 137395–137406, 2020, https://doi.org/10.1109/access.2020.3012053
-
K. Zhao, H. Jiang, K. Wang, and Z. Pei, “Joint distribution adaptation network with adversarial learning for rolling bearing fault diagnosis,” Knowledge-Based Systems, Vol. 222, p. 106974, Jun. 2021, https://doi.org/10.1016/j.knosys.2021.106974
-
T. Han, L. Zhang, Z. Yin, and A. C. C. Tan, “Rolling bearing fault diagnosis with combined convolutional neural networks and support vector machine,” Measurement, Vol. 177, p. 109022, Jun. 2021, https://doi.org/10.1016/j.measurement.2021.109022
-
L. Wan, Y. Li, K. Chen, K. Gong, and C. Li, “A novel deep convolution multi-adversarial domain adaptation model for rolling bearing fault diagnosis,” Measurement, Vol. 191, p. 110752, Mar. 2022, https://doi.org/10.1016/j.measurement.2022.110752
-
B. Pang, M. Nazari, and G. Tang, “Recursive variational mode extraction and its application in rolling bearing fault diagnosis,” Mechanical Systems and Signal Processing, Vol. 165, p. 108321, Feb. 2022, https://doi.org/10.1016/j.ymssp.2021.108321
-
K. Zhang, Y. Xu, Z. Liao, L. Song, and P. Chen, “A novel fast entrogram and its applications in rolling bearing fault diagnosis,” Mechanical Systems and Signal Processing, Vol. 154, p. 107582, Jun. 2021, https://doi.org/10.1016/j.ymssp.2020.107582
-
N. U. Rehman and H. Aftab, “Multivariate variational mode decomposition,” IEEE Transactions on Signal Processing, Vol. 67, No. 23, pp. 6039–6052, Dec. 2019, https://doi.org/10.1109/tsp.2019.2951223
-
H. Yang, L. Gao, and G. Li, “Underwater acoustic signal prediction based on MVMD and optimized kernel extreme learning machine,” Complexity, Vol. 2020, pp. 1–17, Apr. 2020, https://doi.org/10.1155/2020/6947059
-
H. Jin, H. Sun, H. Fu, and Z. Han, “Milling process stability detection for curved workpiece based on MVMD and LSTM,” The International Journal of Advanced Manufacturing Technology, Vol. 123, No. 3-4, pp. 1025–1036, Nov. 2022, https://doi.org/10.1007/s00170-022-10030-8
-
K. Wang, D.-H. Zhai, Y. Xiong, L. Hu, and Y. Xia, “An MVMD-CCA recognition algorithm in SSVEP-Based BCI and its application in robot control,” IEEE Transactions on Neural Networks and Learning Systems, Vol. 33, No. 5, pp. 2159–2167, May 2022, https://doi.org/10.1109/tnnls.2021.3135696
-
Z. L. Wang, “Entropy theory of distributed energy for internet of things,” Nano Energy, Vol. 58, pp. 669–672, Apr. 2019, https://doi.org/10.1016/j.nanoen.2019.02.012
-
S. Mirjalili, S. M. Mirjalili, and A. Lewis, “Grey Wolf optimizer,” Advances in Engineering Software, Vol. 69, pp. 46–61, Mar. 2014, https://doi.org/10.1016/j.advengsoft.2013.12.007
-
M. Ghalambaz, R. Jalilzadeh Yengejeh, and A. H. Davami, “Building energy optimization using Grey Wolf Optimizer (GWO),” Case Studies in Thermal Engineering, Vol. 27, p. 101250, Oct. 2021, https://doi.org/10.1016/j.csite.2021.101250
-
P. Niu, S. Niu, N. Liu, and L. Chang, “The defect of the Grey Wolf optimization algorithm and its verification method,” Knowledge-Based Systems, Vol. 171, pp. 37–43, May 2019, https://doi.org/10.1016/j.knosys.2019.01.018
Cited by
About this article

The authors are highly thankful for the financial support of Education Fund of Hunan Province (21C1312) and the Natural Science Foundation of Hunan Province (2022JJ50096).
The datasets generated during and/or analyzed during the current study are available from the corresponding author on reasonable request.
The authors declare that they have no conflict of interest.
