Abstract
The vibration signals caused by rolling bearing defects in different directions may be different, and the fault diagnosis based on single channel vibration signals may be made incorrectly, and the observation results may be understood wrong. To avoid it, a new rolling bearing fault feature extraction method based on multivariate variational mode decomposition (MVMD) and complex Fourier transform (CFT) were proposed. First, the orthogonally sampled vibration signals were combined into a multivariate signal, and the multivariate signal was decomposed into several intrinsic mode functions (IMFs) using the MVMD. As per this method, a unified mathematical model was used to model vibration signals in two directions, ensuring that fault features were decomposed to the same level. Finally, the CFT was applied to fuse the envelope signals in two directions in order to obtain a clearer and comprehensive amplitude-frequency feature. Simulation and test results verify the feasibility and superiority of the proposed method.
Highlights
- There is no mode aliasing and mode splitting phenomena when applying MVMD to decompose the muti-channel vibration signals.
- The fault features in the multi-channel vibration signals are decomposed by MVMD into the multiple modulated oscillation signals of the same layer to facilitate the subsequent feature information fusion.
- The fault features of the vibration signals of the two channels can be effectively fused from the feature layer by CFT.
- Selection of the fault characteristic frequency or the conjugate fault characteristic frequency from the complex Fourier spectrum according to the phase difference can highlight the fault feature.
1. Introduction
Rolling bearing is an important component of rotating machinery. However, because of complex working environments, wear, fatigue, corrosion, overloading and many other factors, local defects can occur in rolling bearing. If left unchecked, these defects may damage the whole system. Therefore, it is very important to monitor and diagnose the condition of the rolling bearing [1-3].
Since the vibration signals collected by sensors installed in rolling bearing housings contain a wealth of information about the machine functionality, the vibration analysis is the preferred method for diagnosing local defects in rolling bearings. When a local defect occurs in a rolling bearing, the periodic impact caused by the defect will excite the resonance frequency of the bearing and adjacent components [4]. However, there are various types of rolling bearing defects, such as rolling element defects, outer race defects, inner race defects and their composite defects. Therefore, the frequency distribution of the vibration signals caused by rolling defects is more complicated. Some are in high-frequency bands, some are in mid-frequency bands, and some are even in low-frequency bands, or in the combinations of two or even three bands. However, there is a problem of correct determination of the frequency band to locate the fault signal. In addition, the energy of the vibration signals caused by a weak defect is low, and the signals collected by sensors inevitably contain noise components, which makes the analysis of the vibration signals more difficult [5].
The usage of the wavelet transform (WT) to analyze vibration signals is one of the main ways to monitor rolling bearings in an early stage [6]. Because the detection effect based on WT is not only restricted by the Heisenberg uncertainty principle but also depends on the selection of the basis function and the decomposition scale, this technique cannot guarantee an optimal detection result. With the development of digital signal analysis and processing technology, some data-driven signal analysis methods with good adaptability have been proposed, such as empirical mode decomposition (EMD) [7], local mean decomposition (LMD) [8], and local characteristic-scale decomposition (LCD) [9], etc.
When a defect occurs in a rolling bearing, periodic shock signals are excited, and the interval frequency of the shock is related to the type of the defect. The interval frequency can be easily obtained by demodulating the impulse signals using the Hilbert transform (HT). Yu used EMD and HT to diagnose rolling bearing defects [10]. Cheng proposed fault diagnosis methods for rolling bearings based on the LMD [11], LCD and HT [12]. Although data-driven algorithms have good adaptability, these methods lack a mathematical foundation, and the analysis results are greatly affected by noise. Based on the variational theory, Zosso proposed the variational mode decomposition (VMD) [13]. Compared with the recursive shifting mode of EMD and LMD, VMD converts the signal decomposition into non-recursive operation with a solid theoretical foundation. The essence of this technique consists in multiple adaptive Wiener filtering groups, which show better noise robustness and can also separate signals with similar frequencies [14].
Due to factors such as load, friction, stiffness, abundant defect types, and complex force transmission paths, the intensity and spectral structure of vibration signals in different directions are different. Monitoring the defect status based on vibration signal characteristics in a single direction may cause misjudgement or omission [15]. Cheng reported a case where the outer race fault feature could not be extracted based on only a single channel signal [12]. Subsequent experiments also found significant differences in the characteristics of the vibration signals in two directions. With the development of sensor technology, it became very common to use one sensor to collect vibration signals in multiple directions, however, the corresponding multi-channel signal analysis technology was relatively insufficient to explain the whole process. However, it is simple to process multiple signals using the traditional univariate signal analysis method. The unary signal analysis method can be used to analyze signals from multiple channels separately. However, this method cannot guarantee that the signal of each channel has the same decomposition scale, which causes the information fusion to become increasingly challenging [16].
In recent years, the interest in researching the multi-channel non-stationary signal processing technology gradually increased. Such as, Rilling extended the EMD to the binary field and proposed a bivariate EMD (BEMD) method to deal with ocean float signals [17]. Danilo proposed a complex LMD (CLMD) method based on LMD to process multi-channel electroencephalography [18]. In addition to multivariate data-driven methods, the multivariate multi-scale entropy [19] and multivariable time-frequency analysis methods [20] were proposed to deal with multi-channel signals often encountered in modern engineering.
In the field of rotating machinery fault diagnosis, the fault features contained in the multi-channel signals are more comprehensive [21]. In order to improve the accuracy of fault diagnosis, fault diagnosis methods for rotating machinery based on multivariate signal analysis were proposed. Zheng used multivariate multi-scale fuzzy entropy [22] to diagnoze gear faults for more accurate diagnosis. Huang proposed a new method for time-frequency analysis of rotating machinery faults based on multivariable synchrosqueezing to fuse the time-frequency information of multi-channel signals [23]. Wang applied the BEMD to detect mechanical and electrical defects of wind turbines [24]. Zuo used the multivariate EMD (MEMD) and a full spectrum to monitor the condition of rotating machinery [25]. Lu proposed a new method for the fault feature extraction of rolling bearings based on MEMD and correlation analysis to calculate fault correlation factors to select effective intrinsic mode functions (IMFs) [26]. Huang applied the BEMD, CLMD and HT to extract rotor fault features [27-28]. BEMD or CLMD ensures that the signals of two channels have the same decomposition scale. However, BEMD and CLMD are developed from EMD and LMD, they also exhibit some problems such as modal aliasing and modal splitting [29].
In rotor monitoring, the motion track of rotor is an ellipse. The vibration signals are collected orthogonally by displacement sensors, and the ellipse information is extracted by the holographic spectrum or the full vector spectrum (FVS) [28] to improve the accuracy of fault diagnosis. However, the rotating speed of rolling bearings is high, and the fault features are hidden in the high-frequency signal. Acceleration sensors are commonly used to collect vibration signals. Different from displacement signals, the track formed by acceleration signals does not have rotation characteristics. The analysis of acceleration signals with FVS lost its physical significance. The integration method of the signal characteristics in the orthogonal direction of rolling bearings needs further discussion.
Based on the definition of multivariate modulation oscillation signals, Rehan proposed a multivariate VMD (MVMD) method to extract the set of bandwidth modes that contain inherent multivariate modulation oscillations in multivariate input signals, and the sum of the bandwidths of all signal modes residing in input data channels is the smallest [30]. In the MVMD, the same mathematical model is used to model multi-channel signals to ensure that fault features are decomposed to the same layer. The MVMD was originally used to analyse the EEG signals. Unlike the Fourier transform, the CFT no longer satisfies the conjugate symmetry. From the characteristic frequency and conjugate characteristic frequency, the one with the larger amplitude is selected to characterize fault features, so that the obtained fault features are clearer. A new method for the fault feature extraction of rolling bearings based on MVMD and CFT is proposed.
The main contributions of this paper can be summarized as follows:
1) There is no mode aliasing and mode splitting phenomena when applying MVMD to decompose the muti-channel vibration signals.
2) The fault features in the multi-channel vibration signals are decomposed by MVMD into the multiple modulated oscillation signals of the same layer to facilitate the subsequent feature information fusion.
3) The fault features of the vibration signals of the two channels can be effectively fused from the feature layer by CFT.
4) Selection of the fault characteristic frequency or the conjugate fault characteristic frequency from the complex Fourier spectrum according to the phase difference can highlight the fault feature.
The remainder of this paper is organized as follows: Section 2 introduces the theoretical background of the method, including MVMD and CFT. Section 3 describes the wholediagnostic process of the proposed method for roll bearing. Section 4 consists of two parts: experimental setup and experimental data analysis. The method feasibility is verified by two real cases and compared with other methods. Section 5 contains discussion, which mainly involves the influence on the decomposition results when the parameters of MVMD take different values. Section 6 contains the conclusions and prospects for future works.
2. Introduction to MVMD and complex Fourier transform (CFT)
2.1. Multivariate modulated oscillations
To express conveniently a multi-oscillation signal, the amplitude modulation and frequency modulation signal is defined in the form of vector in the real number field:
where and are the amplitude function and the phase function, respectively, and is the number of channels. Hilbert operator is applied to Eq. (1), and the corresponding analytic vector of is obtained. The analytic vector is as follows [30]:
The amplitude function and the phase function can be obtained by the following modulo and phase operations:
The original real-value signal vector can be obtained from the real part of
For vibration signals of rolling bearing defects collected by 2D or 3D sensors, so one or more components with the same frequency may be present. Therefore, a simple multivariate analytic signal model for that assumes a single common component among all data channels is proposed:
2.2. Multivariate VMD
MVMD is an extension of the VMD method. For more details regarding the VMD, see [11]. As a generalization of the VMD algorithm in multidimensional space, the main goal of MVMD is to extract the predefined multivariate modulation oscillation signals containing C channel data from the input data . MVMD is used to decompose a multivariate signal into the sum of multiple modulated oscillation signals :
where . is the number of multivariable modulated oscillation signals.
The purpose of MVMD is to extract a set of multivariable modulation oscillations from the input data. Additionally, the sum of bandwidths of the extracted sets is the smallest, and the original signals can be reconstructed accurately. To this end, Eq. (2) is used to represent an analytical vector, and the bandwidth of can be estimated by the L2 norm of the gradient function of . Therefore, the multivariable function that needs to be optimized in MVMD is expressed by the following formula [30]:
The symbol represents the partial derivative operation on time.
Another characteristic of Eq. (8) is that a single frequency component is used for harmonic mixing of the entire vector . Therefore, the design provides the possibility to find the multivariate oscillation with a single common frequency component in all channels in , and this causes a multivariate modulation oscillation model defined in Eq. (6). The bandwidth of the modulation multivariable oscillation is estimated by shifting the single-side spectrum of all channels of to and taking the Frobenius norm of the matrix. It is convenient to express as follows:
where represents an analytical modulation signal corresponding to channel number and mode number . In contrast to the vector signal in Eq. (8), is a single component complex value signal. The constrained optimization problem of MVMD is as follows:
where , and represent the set of all modes and their central frequencies, respectively.
The corresponding augmented Lagrangian function becomes:
where is the penalty factor.
In the MVMD, the alternating direction multiplier (ADMM) is used to solve the above unconstrained optimization problem. The ADMM method transforms the complex optimization problem in Eq. (11) into several simpler sub-optimization problems through Eq. (12-14):
where is the time step.
Eq. (12) can be equivalent to the following formula:
One of these sub-problems is depicted in the updated diagram of the original VMD. In the MVMD, the relationship is updated using the following pattern [12] in the Fourier domain:
For the renewal of the central frequency of Eq. (13), considering that the last two terms of the Lagrangian function Eq. (11) do not depend on , the related problems are simplified as follows:
By using Plancherel’s theorem of the inner product of the function in the time domain and frequency domain, the optimization process can be carried out more easily in the frequency domain. In the Fourier domain, the equivalence problem of Eq. (17) becomes:
By setting the first derivative of the quadratic function to zero and then performing some simple algebraic operations, the above sum of the quadratic function is minimized, and the following relations are obtained:
It can be seen from Eq. (19) that when updating of each mode during MVMD, the power spectrum contribution of all channels is considered.
2.3. Complex Fourier transform
Fourier transform is performed on the basis of a complex sequence signal ( is an integer and , is the sequence length,) to obtain :
where FFT stands for fast Fourier transform.
Using the Fourier transform in the finite-length sequence of real and even functions on the /2 symmetry and the Fourier transform of the pure imaginary odd-function finite-length sequence on the /2 anti-symmetric and the linear properties of the Fourier transform, it is possible to get:
where and are the Fourier transforms of the cosine signals and respectively, 1, 2,…, /2.
Because the amplitude of the Fourier transform of the complex sequence is related to , if it is represented by a trigonometric function, it can be found that is related to the initial phases of and .
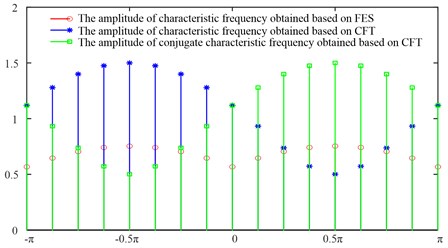
In order to study the relationship between CFT and FVS when the initial phase changes, let:
where 50 Hz, , ( –8, –7,…, 0,…, 7, 8).
The sampling frequency is equal to 800 Hz. The characteristic frequency amplitude obtained by analyzing with the phase difference of its imaginary and real parts based on the CFT and FVS methods, respectively, is shown in Fig. 1. In Fig. 1, when , the amplitude of the characteristic frequency based on CFT is larger. When , the amplitude of the conjugate characteristic frequency () based on CFT is larger. Therefore, the characteristic frequency of the complex signal can be selected according to the phase difference to characterize the fault.
Fig. 1Characteristic frequency amplitude obtained by analyzing zt with phase difference of its imaginary and real parts based on CFT and FVS methods
2.4. Proposed feature extraction method for determining rolling bearing defects
1) First, a 3D accelerometer mounted at rolling bearing housing is used to collect vibration signals from two channels. The collected horizontal signal is used as the signal of the first channel, and the collected vertical signal is used as the signal of the second channel. Then, a binary modulated vibration signal is formed, where .
2) MVMD is applied to decompose into the sum of binary oscillation signals , . where .
3) Hilbert operations are respectively performed on and , and the envelope function of and the envelope function of are obtained respectively.
4) Let , . Then, Eq. (21) is applied to to obtain a complex Fourier spectrum, and to select the fault feature frequency according to the phase difference between the imaginary part and the real part of .
The key point of the whole procedure is selection. Generally, the vibration signals caused by rolling bearing defects have four components: fundamental frequencies, defect frequencies, natural vibration frequencies and ultrasonic frequency. Therefore, when the MVMD method is used to analyze vibration signals caused by rolling bearing defects, is set to 4.
3. Test case analysis
3.1. Experimental Setup
In this paper, the test bench shown in [31] is used. As described in [31], the experiment rig consists of a rotor-bearings system driven by a 1 HP triple-phase asynchronous motor, as shown in Fig. 2(a). Multiple rotating speeds, which fluctuation range is almost 60 rpm, can be monitored by a motor speed controller. The vibration data were obtained from 3D-accelerometer mounted on a rotor-bearing system. Different kinds of bearing faults are simulated by replacing bearing 1 with a rolling element defective bearing or compound defective bearing having roller defect and outer race defect. The defect on the outer race and ball of bearings is shown in Fig. 2(c) and (d). All channels of vibration data from the 3D-accelerometer were acquired simultaneously using a LMS SCADAS Mobile data acquisition system in Fig. 2(b) at a sampling rate of 25.6 KHz. The bearing model is MB ER-16K, which has 9 rollers, 38.5 mm pitch diameter, 7.9 mm rolling body diameter, and 0 deg. contact angle. Ball pass frequency outer (BPFO) is 3.572. Ball Spin Frequency (BSF) is 2.322. The motor speed is 2700 rpm, and the rotation frequency 45 Hz. So, the ball fault frequency is 104 Hz, and the outer race fault frequency is 161 Hz. Ball defect of 1.2 mm wide and 0.5 mm deep was made by wire cutting method. Outer race defect of 1.2 mm wide and 1.75 mm deep was made by wire cutting method.
Fig. 2View of experimental setup of rotor-bearing system: 1 – variable speed controller; 2 – motor; 3 – coupling; 4 – 3D-accelerometer; 5 – bearing 1; 6 – rotor disk; 7 – shaft; 8 – healthy bearing; 9 – ball defect; 10 – outer race defect; 11 – LMS SCADAS mobile
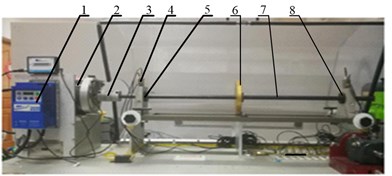
a) Machine fault simulator (MFS)
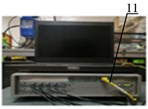
b) Data acquisition system
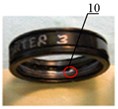
c) Oter race defect
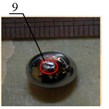
d) Ball defect
3.2. Rolling element defect
In Fig. 2, rolling bearings are mainly under the action of the radial force excited by the movement of rotor disk and the motor, so this paper only analyzes the radial vibration signals. If the collected vibration signal in the horizontal direction is x and the vibration signal in the vertical direction is , then a binary modulation signal is equal to . Let 4, 2000 and 0, the MVMD method is used to decompose into the sum of a series of IMFs ( 1, 2, 3, 4), where . represents the horizontal component of the vibration signal , and represents the vertical component of the vibration signal . The time-domain waveforms of , and are shown in Fig. 3. The evolution of IMFs center-frequencies is shown in Fig. 4.
Fig. 3Time-domain waveforms of rolling element defect signals x, y and uk obtained by MVMD
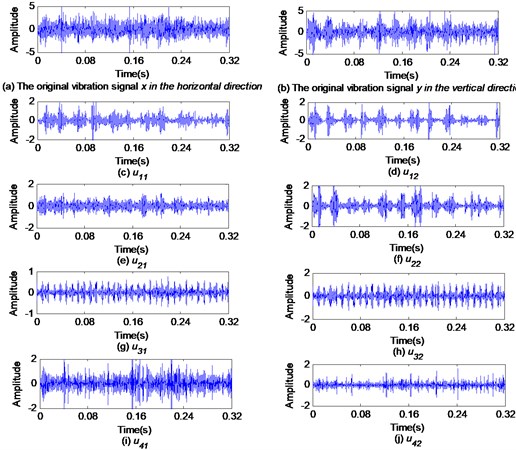
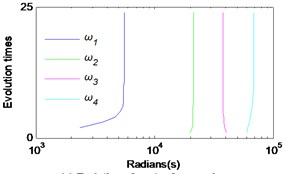
In Fig. 3(a) and (b), the original vibration signals and have no obvious amplitude modulation characteristics, and the fault feature information is submerged by noise. In Fig. 3(g) and Fig. 3(h), the and contain very obvious modulation characteristics, but the amplitude of is larger than that of . In Fig. 4, the central frequency of IMFs fluctuated greatly at the early stage of evolution, but it entered a stable state after 24 evolutions.
Fig. 4Evolution of IMFk center-frequencies ωk
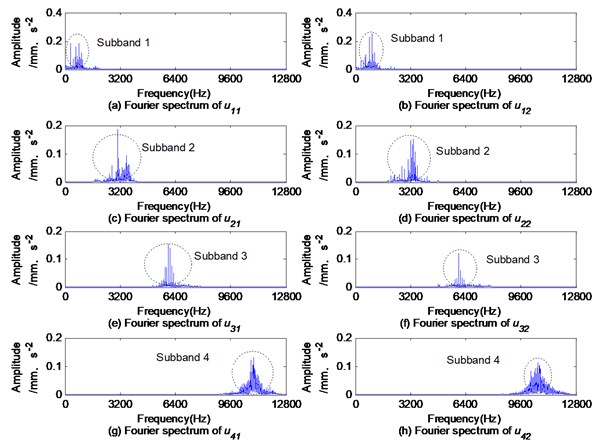
To illustrate the frequency band structure of a vibration signal excited due to the bearing defect, the reason for taking 4, and the advantage of using the MVMD to analyze multi-channel signals, the Fourier spectrums of the original signals and the Fourier spectrums of their decomposition results based on MVMD are shown in Fig. 5. As generally accepted, the Fourier spectrums of the rolling bearing fault vibration signals contain four subbands. Therefore, it is appropriate to set to 4 when using MVMD to decompose the rolling bearing fault vibration signals. In addition, and have similar spectral structures and are arranged in order of frequency from low to high, and there are no modal aliasing and modal splitting between the subbands of and the subbands of . The fault features obtained by using the MVMD method are decomposed into the same layer, which is beneficial to the subsequent fault feature fusion. Hilbert operations are respectively performed on and , and the envelope functions and are obtained. The Fourier spectrums of and are shown in Fig. 6.
Fig. 5Fourier spectrums of rolling element defect signals x, y and uk obtained by MVMD
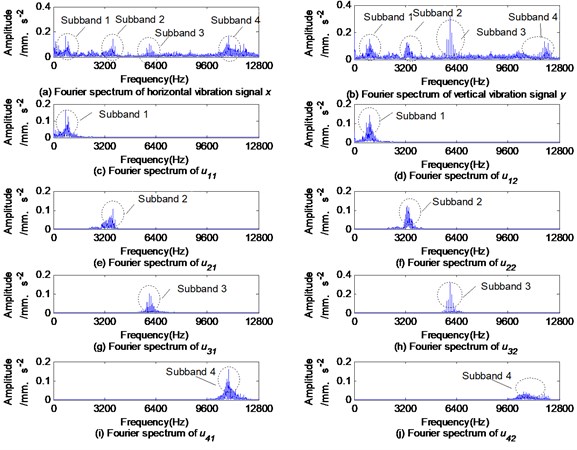
In Fig. 6, the rolling element fault feature frequency 101 Hz is in the mid-frequency subband 3. In addition, the amplitude of is much larger than that of .
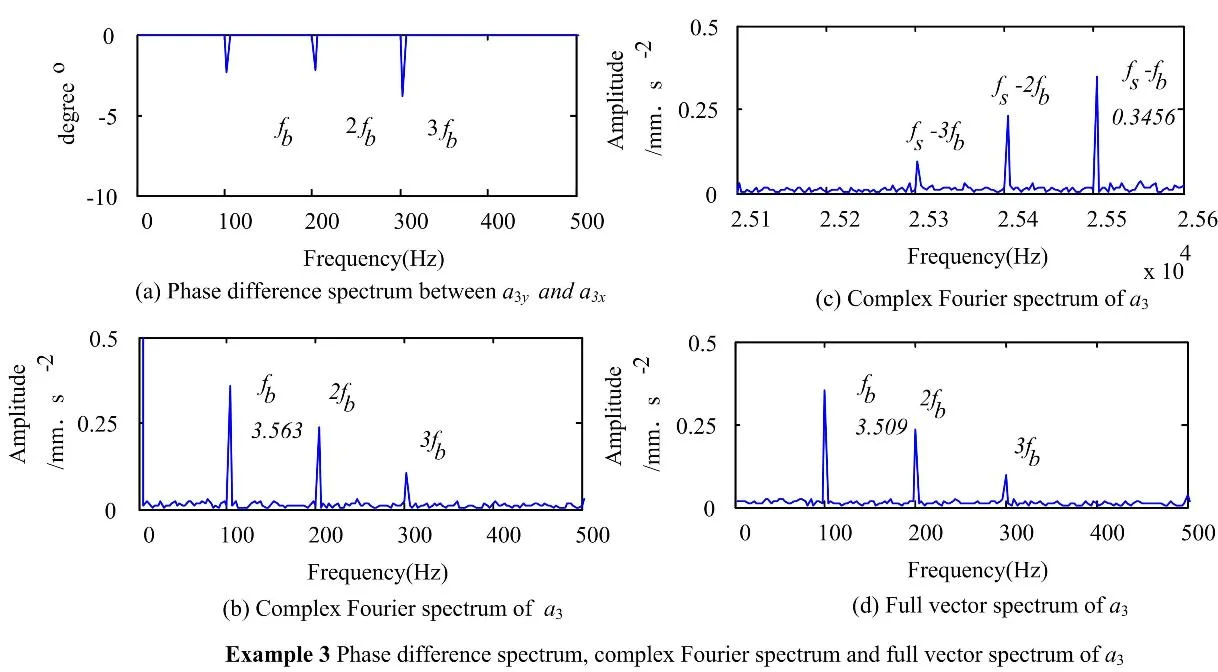
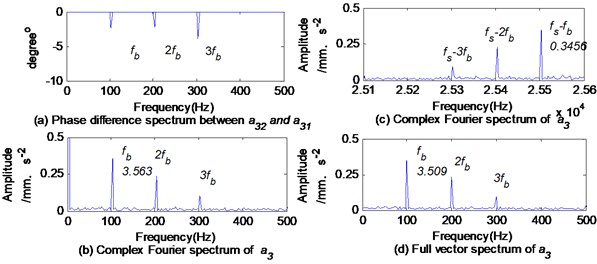
Let , then the phase difference spectrum will be between and . So it is possible to depict the complex Fourier spectrum of and full vector spectrum of as shown in Fig. 7. Because the phase difference between and is between – and 0, the amplitude of the feature frequency , which is 3.563, in the complex Fourier spectrum of is larger than that of the conjugate frequency (-), which is 3.456. According to Fig. 6 and Fig. 7, it can be seen that the amplitude of is the largest in the complex Fourier spectrums, i.e. 0.3563, followed by 0.3506 in the full vector spectrum, and it is the smallest in the Fourier spectrum of , i.e. 0.3223.
Fig. 6Fourier spectrums of ak1 and ak2
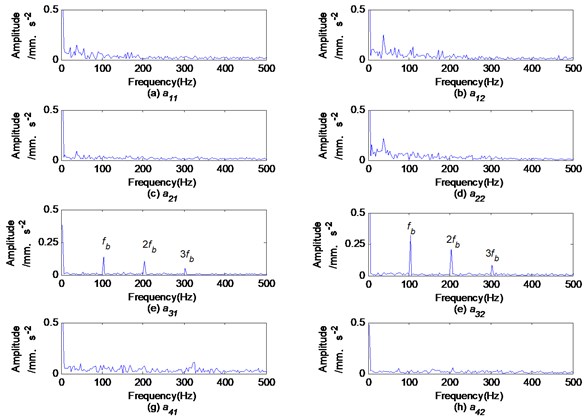
Fig. 7Phase difference spectrum, complex Fourier spectrum and full vector spectrum of a3
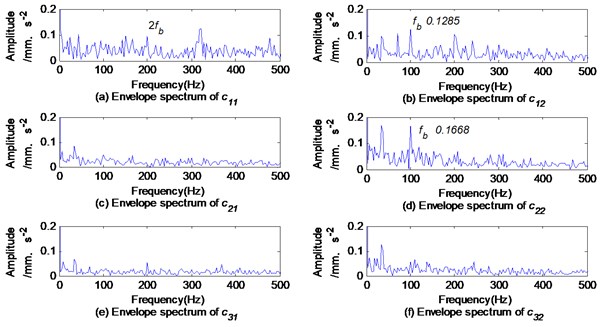
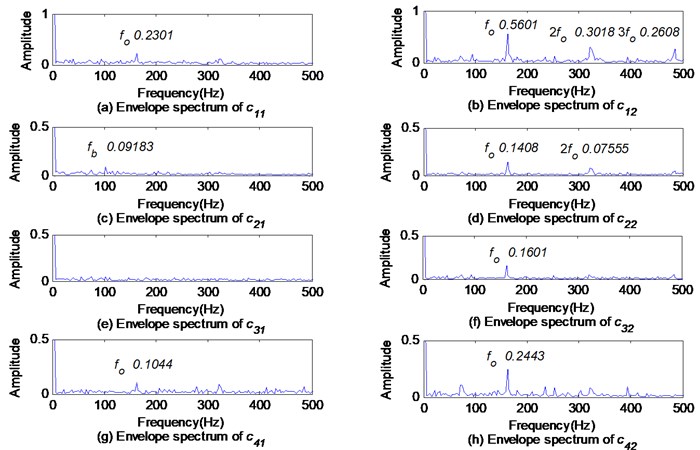
The Fourier spectrums of the first three-order IMFs and obtained by the BEMD method are shown in Fig. 8. The Fourier spectrums of first three-order product functions (PFs) and obtained by the CLMD method are shown in Fig. 9. The envelope spectrums of the IMFs and PFs are shown in Fig. 10 and Fig. 11, respectively.
Obviously, the IMFs obtained by the BEMD method or the PFs obtained by the CLMD method induce modal aliasing and mode splitting, which will cause the extracted fault features to be indistinct. For example, Fig. 8(a) shows that the mid-frequency subband is almost submerged by the dominant high-frequency subband, and mode splitting occurs in the mid-frequency subband. As a result, the amplitude of the rolling element fault feature frequency in Fig. 10(a) is very small and almost submerged. Fig. 8(b) demonstrates mode aliasing in , and the mid-frequency subbands containing fault features are decomposed into and , obviously the mode splitting occurs. As a result, the amplitude of the fault feature frequency in Fig. 10(b) and Fig. 10(d) is reduced. when applying the CLMD method to analyze rolling element defects, the similar situation as described above occurs, as shown in Fig. 11.
Fig. 8Fourier spectrum of first three-order IMFs ck1 and ck2 obtained by BEMD method
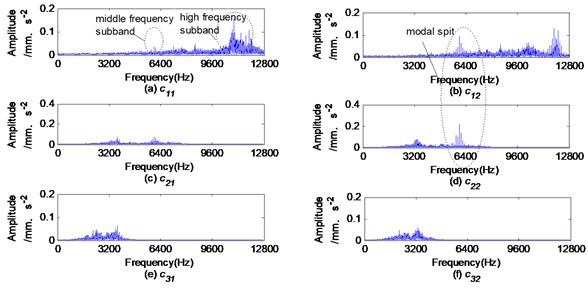
Fig. 9Fourier spectrum of first three-order PFs pfk1 and pfk2 obtained by CLMD method
In Fig. 10 and Fig. 11, the fault features on the same layer are inconsistent. This means the information fusion becomes increasingly challenging. Comparing the envelope spectrums of IMFs and PFs, the amplitude of the fault characteristic frequency of the vibration signal in the vertical direction is obviously larger than that in the horizontal direction. It is very likely to make a wrong diagnosis based on only the signal feature in the horizontal direction.
Fig. 10Envelope spectrums of ck1 and ck2 based on BEMD
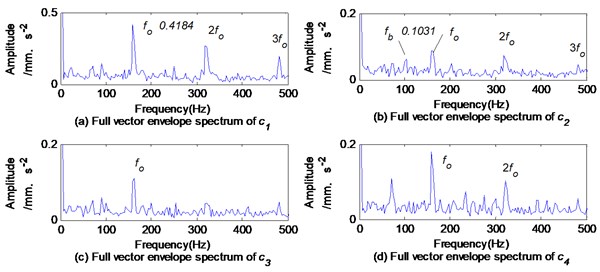
The full vector envelope spectrums of and are obtained by applying the FVS to fuse the envelope signals of and (1, 2) as shown in Fig. 12. The complex envelope spectrums of are obtained by applying the CFT to fuse the envelope signals of and as shown in Fig. 13. The maximum amplitudes of the rolling element fault feature frequency obtained by the above methods are shown in Table 1. The amplitude of obtained by the MVMD method is much larger than that obtained by the BEMD or CLMD methods. The amplitude obtained by the proposed MVMD+CFT method is larger than that obtained by the MVMD+FVS method.
Fig. 11Envelope spectrums of pfk1 and pfk2 based on CLMD
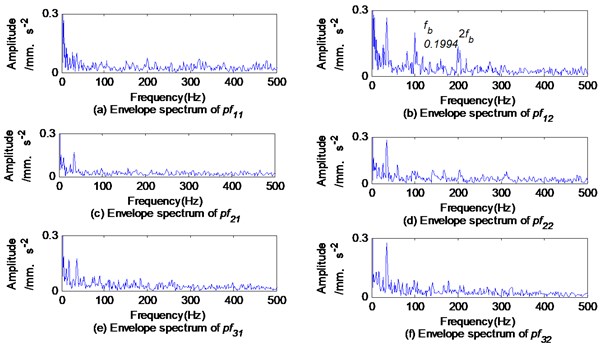
Table 1Maximum amplitudes of rolling element fault feature frequency fb
Methods | MVMD+CFT | MVMD+FVS | BEMD+FVS | CLMD+CFT |
Amplitude / mm.s-2 | 0.3565 | 0.3509 | 0.1735 | 0.2122 |
Fig. 12Full vector envelope spectrums of c1 and c2 based on BEMD
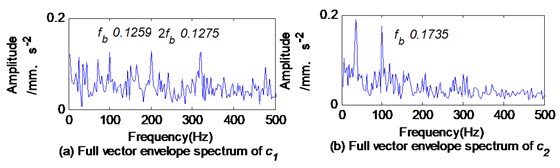
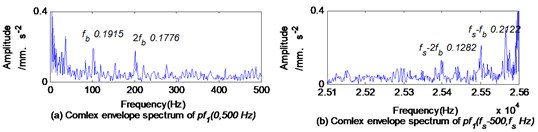
Fig. 13Complex Fourier spectrum of envelope signal of pf1 based on CLMD
3.3. Composite defects
The time-domain waveform and Fourier spectrum of the composite fault vibration signals with rolling element defects and outer race defects are shown in Fig. 14. Similar to rolling element defects, the spectrums of composite fault vibration signals mainly contain 4 subbands.
Let 4, 2000 and 0. Then the MVMD is applied to decompose the composite fault signals into a series of and (1, 2, 3, 4). Their Fourier spectrums are shown in Fig. 15.
It is clearly seen from Fig. 14 and Fig. 15 that - and - come from subband 1, subband 2, subband 3 and subband 4 in the spectrum of signals and , respectively, bearing no modal aliasing or modal splitting in the spectrums of and . This property of MVMD provides the possibility to determine where the fault signature is located. In Fig. 15, the frequency centers of the subbands in the spectrums of and are approximately the same that is very beneficial to the subsequent fault feature information fusion.
Fig. 14Time-domain waveform and Fourier spectrum of composite fault vibration signal
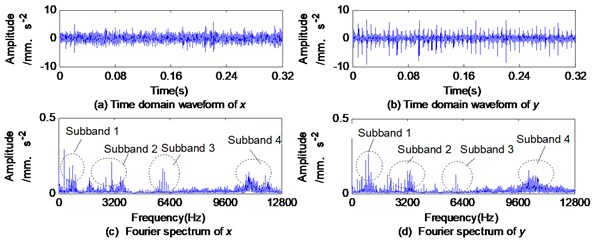
Fig. 15Fourier spectrums of uk1 and uk2 obtained by MVMD
The HT is applied to and respectively, and the envelope spectrums of and are shown in Fig. 16. The rolling element defect feature frequency 101 Hz is still in the mid-frequency subband 3. The outer race defect feature frequency 160 Hz is in low-frequency subband 1, subband 2 and in high-frequency subband 4. Compared with Fig. 6, it can be seen that when only the rolling element defect occurs, the fault feature amplitude in the vertical direction is larger than that in the horizontal direction. But when a composite defect occurs, the situation changes cardinally to the reverse.
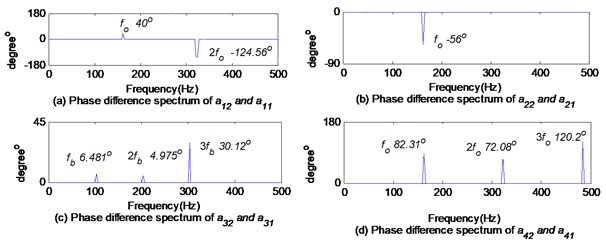
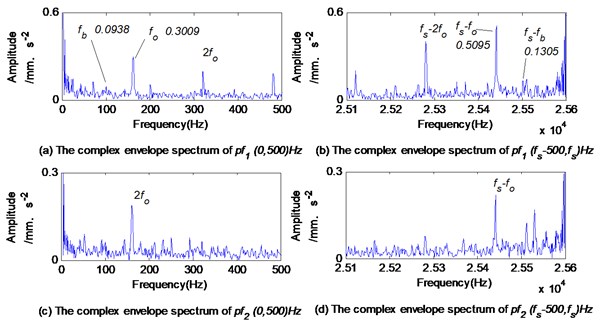
Let , where and are the envelope signals of and respectively. Then the phase difference spectrums of and shown in Fig. 17, and the complex Fourier spectrums and the full vector spectrums of shown in Fig. 18 and in Fig. 19 are actual.
In Fig. 18, the larger amplitude is selected from the characteristic frequency and conjugate characteristic frequency to reveal the characteristics of composite defects according to the phase difference between and . Taking and as two examples, In Fig. 17(c) and (d), the phase difference between and at the ball defect characteristic frequency is 6.481° and the phase difference between and at the outer race defect characteristic frequency is 82.31°, which belongs to (0, ). According to 2.3, when the phase difference is between (0, ), the magnitude of the conjugate characteristic frequency is larger than that of the characteristic frequency. In Fig. 18, the magnitude of the ball defect characteristic frequency is 0.2053, while the magnitude of the conjugate characteristic frequency is 0.2228. The magnitude of the outer race fault characteristic frequency is 0.238, while the magnitude of the conjugate characteristic frequency (-) is 0.5825. In Fig. 19, the amplitude of in the full vector spectrum of is only 0.4102. In Fig. 16, the amplitude of in the envelope spectrum of is larger than that of , i.e. 0.4094, but much smaller than that in the full vector spectrums or in the complex Fourier spectrums.
Fig. 16Envelope spectrums of uk1 and uk2
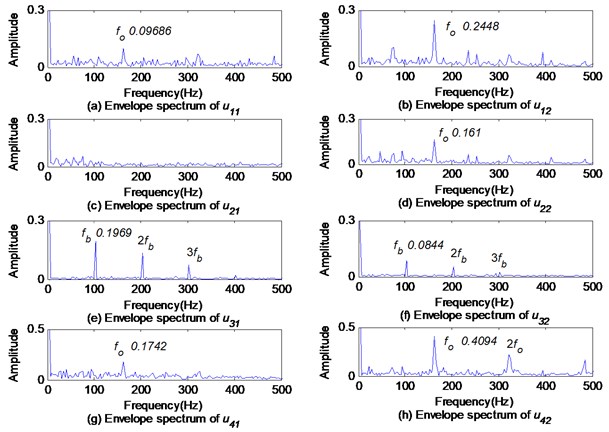
Fig. 17Phase difference spectrums of ak1 and ak2
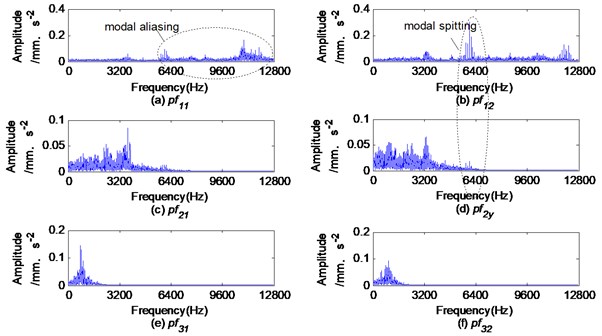
The BEMD is used to decompose the composite defect signals into a series of IMFs and , where 1, 2, 3, 4. The Fourier specturms of the first four and are shown in Fig. 20. Their envelope specturms are shown in Fig. 21. Obviously, there are modal aliasing and modal splitting in the spectrum of IMFs shown in Fig. 20. The envelope spectrums of and have significant differences as shown in Fig. 21. The outer race fault feature frequency is in the envelope spectrums of and , and the rolling element fault feature frequency is in . In the envelope spectrum of , each of them has an outer race fault feature frequency , but without rolling element fault feature frequency . Obviously, the diagnosis based only on the envelope spectrum of is easy to induce errors and inaccuracies.
Fig. 18Complex Fourier spectrums of ak based on MVMD
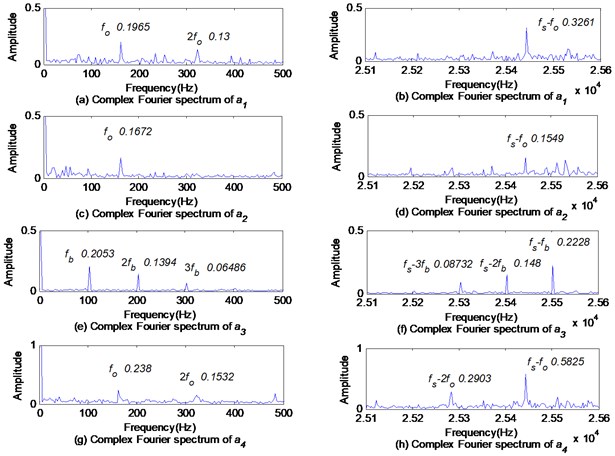
Fig. 19Full vector spectrums of ak based on MVMD
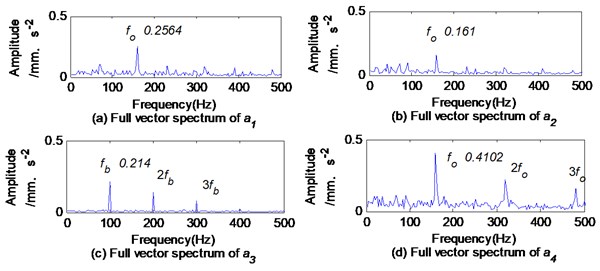
Fig. 20Fourier spectrums of first four ck1 and ck2 obtained by BEMD
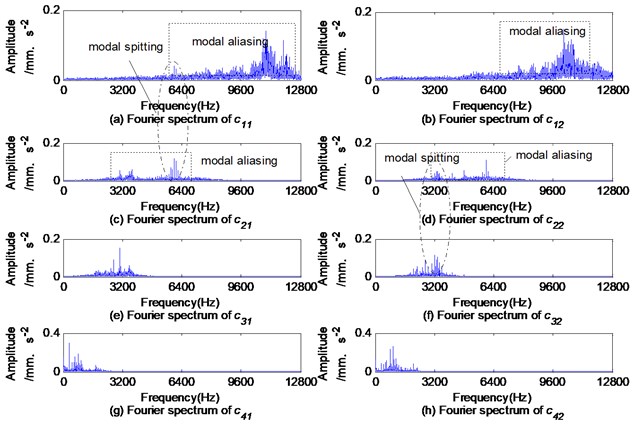
Fig. 21Envelope spectrums of first four ck1 and ck2 obtained by BEMD
The full vector envelope spectrums of the IMFs obtained by BEMD are shown in Fig. 22. The complex envelope spectrums of obtained by CLMD are shown in Fig. 23. In Fig. 22 and Fig. 23, the rolling element fault features are small and difficult to be identified.
The maximum amplitudes of the compound defect feature frequencies and obtained by the above methods are shown in Table 2. It can be seen from Table 2 that even if compound defects are analyzed, the amplitude of defect features extracted by the proposed method is clearer.
Table 2Maximum amplitudes of compound defect feature frequencies fb and fo
Methods | MVMD+CFT | MVMD+FVS | BEMD+FVS | CLMD+CFT |
Amplitude of / mm.s-2 | 0.2228 | 0.214 | 0.1031 | 0.1305 |
Amplitude of / mm.s-2 | 0.5825 | 0.4102 | 0.4184 | 0.5095 |
Fig. 22Full vector envelope spectrums of IMFs ck obtained by BEMD
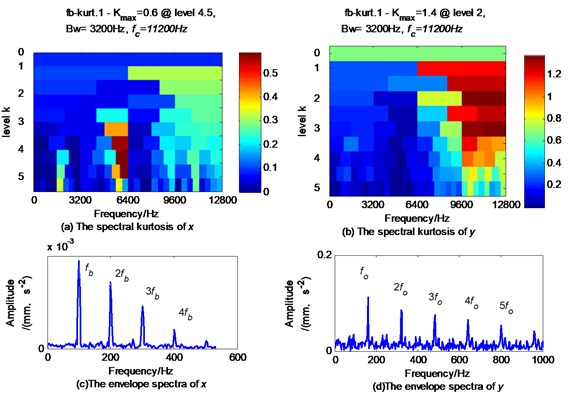
Using fast spectral kurtosis based on 4th order statistics, it is possible demodulate the rolling element defect feature frequency and its frequency multiplication from the signal , and the outer race defect feature frequency and its frequency multiplication from the signal . The demodulation result is shown in Fig. 24. Obviously, only the rolling element defect is diagnosed according to the envelope spectrum of , and the only outer race defect is diagnosed according to the envelope spectrum of .
Fig. 23Complex envelope spectrums of first two pf obtained by CLMD
4. Discussion
Similar to BEMD and CLMD, the MVMD separates multi-channel signals into a series of IMFs in the order of frequency. However, the IMFs obtained by the BEMD or CLMD methods are arranged in order of frequency from the highest to the lowest, while the IMFs obtained by the MVMD method are the opposite. In the envelope spectrum of high-order IMFs, the amplitude of the fault feature frequencies is created as per the selected signal decomposition method with the distribution of the original fault signals in the frequency band. When the fault signals exist only in one frequency band, as shown in section 4.2, the rolling element defect signals are located only in the mid-frequency band. The amplitude of the fault feature frequency obtained by the MVMD method is much higher than that of the BEMD method or the CLMD method. The reason is that the mode splitting occurs when the fault signals are decomposed by the BEMD method or the CLMD method, which causes the fault signals to be decomposed into different layers, resulting in a reduction in amplitude. When the fault signals are distributed in different frequency bands, such as composite defect signals mentioned in section 4.3, the MVMD can decompose this type of signals into the corresponding frequency bands, while the BEMD has modal aliasing, and the separated high-order IMF contains fault signals in almost all frequency bands, so the amplitude of fault feature frequency obtained by the BEMD is relatively higher.
Fig. 24Fast kurtosis based on 4th order statistics and its corresponding envelope spectrum of composite defect signal
The MVMD has a solid mathematical foundation. Because a unified mathematical model is used for multi-channel signals. In the MVMD, it ensures that the same fault features residing in multi-channel signals are decomposed to the same layer to lay a good foundation for subsequent multi-channel information fusion. The test proves that the vibration signals excited by rolling bearing defects are more complicated. Vibration signals from different directions may inform about different defects. The diagnosis based on the information of vibration signals which come from a single direction can induce wrong conclusions and misunderstanding. The distribution of fault vibration signals is also quite different. For example, the rolling element fault feature frequencies are distributed in the mid-frequency band, and the outer race fault feature frequencies are widely distributed, and almost all frequency bands exist.
There are three benefits of analyzing multi-channel rolling bearing fault signals with the MVMD and CFT. Firstly, the signals in the same central frequencies band are decomposed into the same layer, which is conducive to information fusion. Secondly, compared with the BEMD or CLMD method, there is no mode splitting or mode aliasing in the decomposition results based on the MVMD. Thirdly, the amplitude of fault feature frequency obtained by the CFT is larger than that obtained by the FVS. The fault characteristics obtained by using the proposed method are more obvious, especially when analyzing composite faults.
As a newly emerging algorithm, the MVMD also has some shortcomings. For example, the decomposition levels and end conditions of MVMD need to be determined in advance, thus reducing the adaptability of the MVMD. Additionally, as demonstrated by this paper, is determined based on the Fourier spectrum of original signals. The affects the decomposition effect of the MVMD. is lager, so the tightness of the decomposition result is better, but the fault information is easy to lose. With a smaller , the tightness of the decomposition result is worse, and the modal aliasing is prone to occur, although the fault information will not be lost. Experiments have revealed that when is between 200 and 2000, the decomposition results are roughly the same.
5. Conclusions
The MVMD is introduced into the field of rolling bearing fault diagnosis. The multi-channel data analysis method based on the MVMD and the multi-channel data fusion method based on the CFT are investigated. The main conclusions are as follows:
1) The same fault features are decomposed into the same layer, which facilitates the information fusion of multi-channel signals.
2) There are no mode aliasing and mode splitting which is easy to occur when using the BEMD or CLMD to analyze vibration signals.
3) By using the CFT to fuse the envelope characteristics of multi-channel vibration signals, the obtained spectrum characteristics are clearer and more comprehensive.
4) When , the amplitude of the characteristic frequency based on CFT is larger. When , the amplitude of the conjugate characteristic frequency (-) based on CFT is larger.
In a future work, the following situations should be well addressed: (1) Research on the distribution law of rolling bearing defect features; (2) Explaining the reasons for the signal difference from different rolling channels in terms of rolling bearing defects; (3) Adaptive determination of the number of MVMD layers and end conditions.
References
-
I. Attoui, N. Fergani, N. Boutasseta, B. Oudjani, and A. Deliou, “A new time-frequency method for identification and classification of ball bearing faults,” Journal of Sound and Vibration, Vol. 397, pp. 241–265, Jun. 2017, https://doi.org/10.1016/j.jsv.2017.02.041
-
Y. Xin, S. Li, and J. Wang, “A new fault feature extraction method for non-stationary signal based on advanced synchrosqueezing transform,” Journal of Vibration Engineering and Technologies, Vol. 7, No. 3, pp. 291–299, Jun. 2019, https://doi.org/10.1007/s42417-019-00111-6
-
C. Malla and I. Panigrahi, “Review of condition monitoring of rolling element bearing using vibration analysis and other techniques,” Journal of Vibration Engineering and Technologies, Vol. 7, No. 4, pp. 407–414, Aug. 2019, https://doi.org/10.1007/s42417-019-00119-y
-
Y. Lei, Z. Qiao, X. Xu, J. Lin, and S. Niu, “An underdamped stochastic resonance method with stable-state matching for incipient fault diagnosis of rolling element bearings,” Mechanical Systems and Signal Processing, Vol. 94, pp. 148–164, Sep. 2017, https://doi.org/10.1016/j.ymssp.2017.02.041
-
J. Zheng, H. Pan, and J. Cheng, “Rolling bearing fault detection and diagnosis based on composite multiscale fuzzy entropy and ensemble support vector machines,” Mechanical Systems and Signal Processing, Vol. 85, pp. 746–759, Feb. 2017, https://doi.org/10.1016/j.ymssp.2016.09.010
-
H. Qiu, J. Lee, J. Lin, and G. Yu, “Wavelet filter-based weak signature detection method and its application on rolling element bearing prognostics,” Journal of Sound and Vibration, Vol. 289, No. 4-5, pp. 1066–1090, Feb. 2006, https://doi.org/10.1016/j.jsv.2005.03.007
-
N. E. Huang et al., “The empirical mode decomposition and the Hilbert spectrum for nonlinear and non-stationary time series analysis,” Proceedings of the Royal Society of London. Series A: Mathematical, Physical and Engineering Sciences, Vol. 454, No. 1971, pp. 903–995, Mar. 1998, https://doi.org/10.1098/rspa.1998.0193
-
J. S. Smith, “The local mean decomposition and its application to EEG perception data,” Journal of The Royal Society Interface, Vol. 2, No. 5, pp. 443–454, Dec. 2005, https://doi.org/10.1098/rsif.2005.0058
-
J. Cheng, J. Zheng, and Y. Yang, “Nonstationary signal analysis approach: Local characteristic-scale decomposition method,” Journal of Vibration Engineering, Vol. 25, pp. 215–220, Apr. 2012, https://doi.org/10.16385/j.cnki.issn.1004-4523.2012.02.002
-
D. Yu, J. Cheng, and Y. Yang, “Application of EMD method and Hilbert spectrum to the fault diagnosis of roller bearings,” Mechanical Systems and Signal Processing, Vol. 19, No. 2, pp. 259–270, Mar. 2005, https://doi.org/10.1016/s0888-3270(03)00099-2
-
J. Cheng, K. Zhang, and Y. Yang, “Local mean decomposition method and its application to roller bearing fault diagnosis,” China Mechanical Engineering, Vol. 20, pp. 2711–2717, Nov. 2009.
-
J. Cheng, “Empirical envelope demodulation approach based on local characteristic-scale decomposition and its applications to mechanical fault diagnosis,” Journal of Mechanical Engineering, Vol. 48, No. 19, p. 87, 2012, https://doi.org/10.3901/jme.2012.19.087
-
K. Dragomiretskiy and D. Zosso, “Variational mode decomposition,” IEEE Transactions on Signal Processing, Vol. 62, No. 3, pp. 531–544, Feb. 2014, https://doi.org/10.1109/tsp.2013.2288675
-
C. Huang and T. Zhou, “A new detection method of power quality disturbance based on VMD,” Electric Power Automation Equipment, Vol. 38, pp. 116–123, Mar. 2018.
-
Z. Chen and W. Li, “Multisensor feature fusion for bearing fault diagnosis using sparse autoencoder and deep belief network,” IEEE Transactions on Instrumentation and Measurement, Vol. 66, No. 7, pp. 1693–1702, Jul. 2017, https://doi.org/10.1109/tim.2017.2669947
-
C. Huang, “Full vector envelope technique based on complex local mean decomposition and its application in fault feature extraction for rotor system,” Journal of Mechanical Engineering, Vol. 52, No. 7, p. 69, 2016, https://doi.org/10.3901/jme.2016.07.069
-
G. Rilling, P. Flandrin, P. Goncalves, and J. M. Lilly, “Bivariate empirical mode decomposition,” IEEE Signal Processing Letters, Vol. 14, No. 12, pp. 936–939, Dec. 2007, https://doi.org/10.1109/lsp.2007.904710
-
C. Park, D. Looney, M. M. van Hulle, and D. P. Mandic, “The complex local mean decomposition,” Neurocomputing, Vol. 74, No. 6, pp. 867–875, Feb. 2011, https://doi.org/10.1016/j.neucom.2010.07.030
-
M. U. Ahmed and D. P. Mandic, “Multivariate multiscale entropy: A tool for complexity analysis of multichannel data,” Physical Review E, Vol. 84, No. 6, p. 061918, Dec. 2011, https://doi.org/10.1103/physreve.84.061918
-
A. Ahrabian, D. Looney, L. Stanković, and D. P. Mandic, “Synchrosqueezing-based time-frequency analysis of multivariate data,” Signal Processing, Vol. 106, pp. 331–341, Jan. 2015, https://doi.org/10.1016/j.sigpro.2014.08.010
-
L. Qu, X. Liu, G. Peyronne, and Y. Chen, “The holospectrum: A new method for rotor surveillance and diagnosis,” Mechanical Systems and Signal Processing, Vol. 3, No. 3, pp. 255–267, Jul. 1989, https://doi.org/10.1016/0888-3270(89)90052-6
-
J. Zheng, H. Pan, J. Zhang, T. Liu, and Q. Liu, “Multivariate multiscale fuzzy entropy based planetary gearbox fault diagnosis,” Journal of Vibration and Shock, Vol. 38, pp. 187–193, Mar. 2019, https://doi.org/10.13465/j.cnki.jvs.2019.06.028
-
C. Huang, H. Chen, W. Lei, L. Li, and Y. Meng, “Research on fault diagnosis of rotating machinery based on MSST,” Journal of Vibration and Shock, Vol. 38, pp. 1–8, Apr. 2019, https://doi.org/10.13465/j.cnki.jvs.2019.08.001
-
W. Yang, R. Court, P. J. Tavner, and C. J. Crabtree, “Bivariate empirical mode decomposition and its contribution to wind turbine condition monitoring,” Journal of Sound and Vibration, Vol. 330, No. 15, pp. 3766–3782, Jul. 2011, https://doi.org/10.1016/j.jsv.2011.02.027
-
X. Zhao, T. H. Patel, and M. J. Zuo, “Multivariate EMD and full spectrum based condition monitoring for rotating machinery,” Mechanical Systems and Signal Processing, Vol. 27, pp. 712–728, Feb. 2012, https://doi.org/10.1016/j.ymssp.2011.08.001
-
Y. Lv, R. Yuan, and G. Song, “Multivariate empirical mode decomposition and its application to fault diagnosis of rolling bearing,” Mechanical Systems and Signal Processing, Vol. 81, pp. 219–234, Dec. 2016, https://doi.org/10.1016/j.ymssp.2016.03.010
-
C. Huang, H. Song, W. Lei, Z. Niu, and Y. Meng, “Instantaneous amplitude-frequency feature extraction for rotor fault based on BEMD and Hilbert transform,” Shock and Vibration, Vol. 2019, pp. 1–19, Mar. 2019, https://doi.org/10.1155/2019/1639139
-
C. Huang, H. Song, and N. Qin, “Full envelope spectrum based on BEMD and its applications in TRT fault diagnosis,” Electric Power Automation Equipment, Vol. 38, pp. 184–192, Jan. 2018, https://doi.org/10.16081/j.issn.1006-6047.2018.01.028
-
C. Huang, W. Lei, L. Li, Y. Meng, and J. Zhao, “Full vector BEMD method for fault feature extraction of rotating machinery,” Journal of Vibration and Shock, Vol. 38, pp. 94–99, May 2019, https://doi.org/10.13465/j.cnki.jvs.2019.09.013
-
N. U. Rehman and H. Aftab, “Multivariate variational mode decomposition,” IEEE Transactions on Signal Processing, Vol. 67, No. 23, pp. 6039–6052, Dec. 2019, https://doi.org/10.1109/tsp.2019.2951223
-
Y. Chi, S. Yang, W. Jiao, J. He, X. Gu, and E. Papatheou, “Spectral DCS-based feature extraction method for rolling element bearing pseudo-fault in rotor-bearing system,” Measurement, Vol. 132, pp. 22–34, Jan. 2019, https://doi.org/10.1016/j.measurement.2018.09.006
Cited by
About this article

This research was funded by the Henan Provincial Higher Education Key Research Project (Grant No. 19A460029), Henan High-level Innovative Scientific and Technological Talent Team Construction Project (Grant No. C20150034), and Henan Science and Technology Research Project (Grant No. 202102210077).
The datasets generated during and/or analyzed during the current study are available from the corresponding author on reasonable request.
The authors declare that they have no conflict of interest.
