Abstract
With the rapid development of underground space technology in China, the construction of tunnel caverns is increasing. Good air quality in the tunnel is not only necessary for labor safety, but also to create a good construction environment conditions, improve work efficiency, speed up the construction of an important guarantee. The complex construction in the caverns, resulting in a large number of dust will flow to other caves, not only affect the cavern, but also on the other cave caused secondary pollution, affecting its normal construction operations. However, the cavern group construction work, just rely on the traditional single tunnel construction ventilation technology is obviously unable to meet the dust group requirements. Therefore, the study on the distribution of dust in the construction of the caverns is of great significance to improve the dust control work.
1. Project summary
Line 10 Yuelai to Wang Jiazhuang interval design mileage for YK43+143.9689~YK44 +755.200, including the left and right lines. The design mileage of Wang Jiazhuang garage is RCK0+000.000~RCK1+057.836, which is divided into left and right lines. Running tunnel and access tunnel is divided into single-hole single-track, single-hole two-lane, single-hole three-three three types. Section is divided into A~E a total of 5 sections, which are all straight wall arch section and take mining method of tunnel construction to composite lining. The tunnel section features are shown in Table 1.
2. Measurement of dust concentration
According to JTG F60-2009 “highway tunnel construction technical specifications” in the tunnel dust concentration requirements: more than 10 % of free silica dust, per cubic meter of air shall not be greater than 2 mg/s.
The data of dust distribution along the tunnel axis and the distribution curve of dust concentration can be obtained under different working procedures, as shown in Table 2.
According to Table 2, it can be analyzed:
1) In three different construction processes, the distribution of dust concentration in the tunnel shows a similar rule, that is: in each construction process, the dust concentration gradually increases with the tunnel deepening, near the lower step and tunnel face to reach the highest. With the farther away from the tunnel face, the concentration gradually reduced.
2) Most of the dust in the construction process is exceeded, especially when the guniting, up to 6.8 mg/m3, which is three times the allowable value.
3) When drilling operation, the dust concentration is the lowest, its highest concentration is 1.9 mg/m3. According to the regulations of tunnel dust concentration standards: when the dust concentration in the tunnel is lower than the allowable value of 2 mg/m3, the health of the staff is less harmful.
Table 1Tunnel section characteristics listed
Engineering parts | Mileage pile number | Length (m) | The section type (span×height) | Track number | Note |
The right line | YK43+143.968~YK44+053.352 | 909.384 | Type A (6.98×6.86) | 1 | |
YK44+053.352~YK44+180.432 | 127.08 | Type B (18.12×11.53) | 2 | Contain left line | |
YK44+180.432~YK44+730.841 | 550.409 | Type C (12.16×8.58) | 2 | Contain left line | |
YK44+730.841~YK44+755.200 | 24.359 | Type B (18.12×11.53) | 2 | Contain left line | |
The left line as well as in and out of line | RCK0+000.000~RCK0+105.380 ZK43+143.968~ZK43+235.68 | 105.380 | Type C (12.16×8.58) | 3 | In and out line, left and right line |
RCK0+105.380~RCK0+155.266 ZK43+235.68~ZK43+287.200 | 49.886 | Type D (20.84×13.67) | 3 | In and out line, left and right line | |
In and out of line | RCK0+115.266~RCK1+057.836 | 902.670 | Type E (11.66×8.1) | 2 | In and out line, left and right line |
The left line | ZK43+287.200~ZK44+053.352 | 766.126 | Type A (6.98×6.86) | 1 |
Table 27# hole monitoring data of dust concentration distribution in different construction processes
Area | Measuring point | Pile no. (zk43+) | Concentration (mg/m3) | ||
Drill | Gunite | Slag | |||
Tunnel face | 1 | 770 | 1.3 | 6.8 | 5.1 |
Low step zone | 2 | 680 | 1.9 | 6.2 | 4.7 |
3 | 610 | 1.7 | 5.6 | 4.7 | |
Second lining zone | 4 | 570 | 1.6 | 4.3 | 4.2 |
5 | 510 | 1.3 | 3.2 | 3.6 | |
Tunnel portal one | 6 | 470 | 1.1 | 2.8 | 2.7 |
7 | 450 | 0.6 | 2.4 | 1.9 | |
3. Build model
3.1. Single cavity model is established
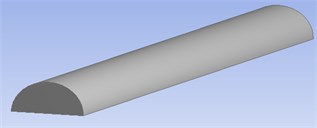
According to the actual situation of the 7 cavity of the light rail line ten, after a reasonable simplification of its internal structure, a geometric model is built. The vertical length of the three-dimensional model is 200 m, the bottom width is 10 m, the height of the bottom to the vault is 7 m, geometric model as shown in Fig. 1.
Fig. 17# hole single hole geometry model of Chongqing metro line ten
After the software of fluent is used to solve, dust concentration distribution simulation respectively as shown in Figs. 2-4.
According to the Figs. 2-4, it can be analyzed:
1) during the construction, the maximum concentration of dust near the tunnel face, which is reaching 5.8 mg/m3, far beyond the allowable value of 2 mg/m3. So, should take the necessary dust reduction measures, the operators should in time to wear gas masks and so on.
2) With the farther away from the tunnel face, the dust concentration gradually decreased, especially the two lining and the hole area. This is due to the flow of dust and gravity, the dust gradually spread and sedimentation, the concentration gradually reduced.
Fig. 2Dust concentration distribution
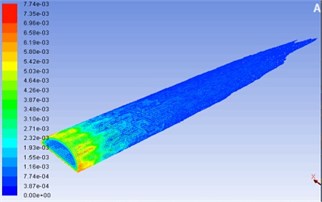
Fig. 3Dust concentration distribution simulation – cloud map
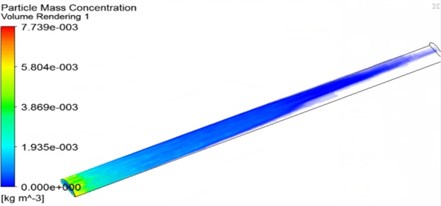
Fig. 4Distribution of the pressure in the tunnel simulation
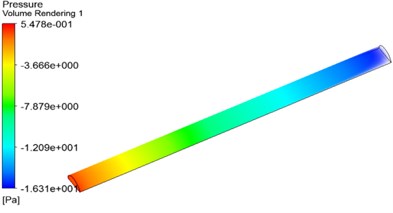
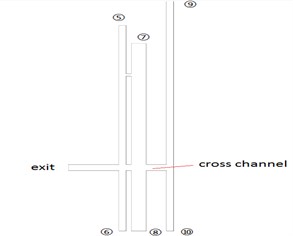
Fig. 5The cavities geometric model
3.2. Establish a model of the cavities
According to the actual situation of the construction of the light rail line ten cavern group, we can make a reasonable simplification of its internal structure, and establish the geometric model as shown in Fig. 5.
3.2.1. The dust distribution simulation analysis when only one hole working in cavities
When working in only one cavity, through numerical simulation and analysis, it can obtain the distribution of the dust in different time, which is shown in Figs. 6-8.
Fig. 6Dust concentration distribution simulation of 7# hole when working for 5 mins
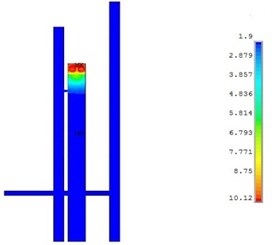
Fig. 7Dust concentration distribution simulation of 7# hole when working for 30 mins
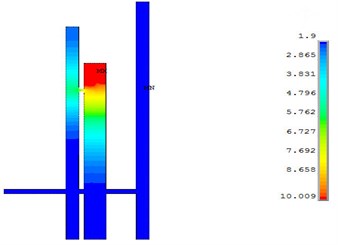
Fig. 8Dust concentration distribution simulation of 7# hole when working for 1 hour
As is shown in the Figs. 6-8:
1) When the construction of 7# hole has carried out for 5 minutes, the dust is mainly concentrated in the tunnel face and low step area where concentration is higher, the constructors should take dust control measures.
2) When the construction of 7# hole has carried out for 30 minutes, with the continuous ventilation, dust gradually spread out, and through the auxiliary channel to the adjacent tunnel and continued to spread.
3) When the construction and ventilation continue, the dust constantly channeling to other caverns, and gradually the entire group will be subject to varying degrees of pollution, the construction of other caverns will have a certain impact.
3.2.2. The dust distribution simulation analysis when two holes work at the same time
When two holes work at the same time, through numerical simulation and analysis, it can obtain the distribution of the dust in different time, which is shown in Figs 9-11.
Fig. 9Dust concentration distribution simulation of 5# and 7# hole when working for 5 mins
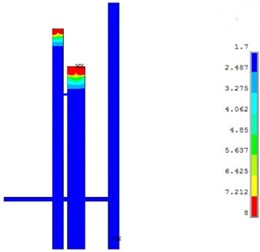
Fig. 10Dust concentration distribution simulation of 5# and 7# hole when working for 30 mins
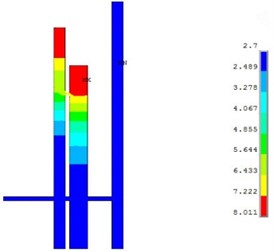
Fig. 11Dust concentration distribution simulation of 5# and 7# hole when working for 1 hour
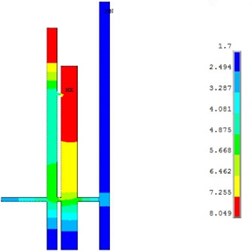
As is shown in the Figs. 9-11:
1) When construction has carried out both on the 5th hole and the 7th hole for 5 minutes, the dust mainly concentrates in the tunnel face area, the dust concentration is higher, the constructors should take timely protective measures.
2) When the construction has carried out for 30 minutes, can be seen from the Fig. 13, the dust continues to spread outside, due to the excavation dept is great, dust has not yet spread to the cross channel.
3) When the construction is carried out for 60 minutes, the simulation shows that the dust has spread to the transverse channel and channeled to the opposite 6#, 8#, 9# and 10# holes, causing secondary pollution to the caverns, affecting the normal construction work.
3.2.3. The dust distribution simulation analysis when 5#, 7# and 9# holes construct at the same time
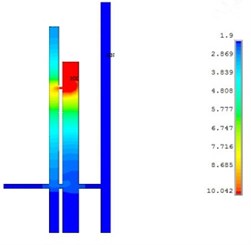
When 5#, 7# and 9# holes construct at the same time, through numerical simulation and analysis, it can obtain the distribution of the dust in different time, which is shown in Fig. 12-14.
Fig. 12Dust concentration distribution simulation of 5#, 7# and 9# hole when working for 5 mins
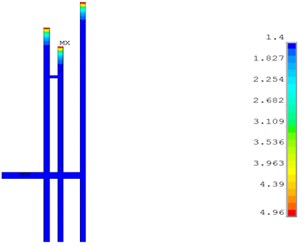
Fig. 13Dust concentration distribution simulation of 5#, 7# and 9# hole when working for 30 mins
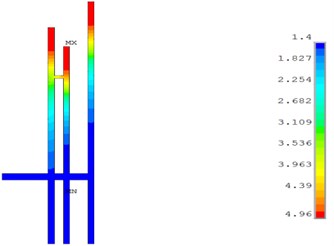
Fig. 14Dust concentration distribution simulation of 5#, 7# and 9# hole when working for 1 hour
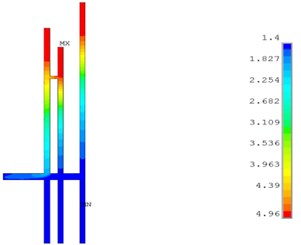
As is shown in Figs. 12-14:
1) When the construction is carried of three tunnel at the same time for 5 minutes, the dust mainly concentrated around the tunnel face, and the concentration has exceeded the allowable values, and constructors should take timely protection measures;
2) When the construction has continued for 30 minutes, the dust all spread to tunnel portal area, and across the opposite tunnel. At this time, the concentration of the whole cavities has exceeded the allowable values;
3) When the construction has carried out for more than one hour, the dust has spread to the cross-channel. The dust concentration of 5#, 7# and 9# hole in the various sections of the tunnel are more than the allowable value; and 6#, 8# and 10# hole also spread a large number of dust, which seriously affect normal construction operations.
4. Conclusions
1) During the operation of the cavern group, especially when guniting, slaging and other operations, the cavity will produce a lot of dust, the dust concentration far exceeds the allowable value, seriously affect the normal construction of the cavern, should take the necessary dust removal measures, wear gas masks and so on.
2) When there are multiple cages in the caverns at the same time, the pollution caused by the dust in the caverns is becoming more and more serious, and more effective dust removal measures should be taken in time.
3) When working in the Cavities, the dust will gradually flow to adjacent tunnel by the auxiliary channel and channel, and cause secondary pollution to other cavities, so that affects other cavities construction working normally.
4) The construction of the cavern group, the traditional single tunnel construction ventilation technology, only rely on tunnel ventilation for dust control, dust in the process of discharging the tunnel outside the pollution of the entire tunnel, endangering all the construction work of the hole, must take ventilation with other methods of comprehensive dust reduction measures, so as to achieve the purpose of ventilation within the chamber group dust.
References
-
Du Jianhua, Bao Wei, Liu Zhina, et al. Numerical simulation study on effect of excavation of hole about the ten subway line of Beijing Huaguang station. Journal of Beijing University of Science and Technology, Vol. 29, Issue 2, 2007, p. 36-41.
-
Wang Guangqi, Wang Zhiyong The monitor of Jingjiu railway of 23 construction tunnel dust concentration and harmful gas. Railway Labor Safety and Health and Environmental Protection, Vol. 24, Issue 3, 1997, p. 172-174.
-
Technical Specification for Construction of Highway Tunnel. China Communications Press, 2009.
-
Wang Hui, Jiang Zhongan, Du Cuifeng, et al. Field study and numerical research on dust concentration distribution in the excavation tunnel. Journal of Liaoning Technical University, Vol. 30, Issue 3, 2011, p. 345-348.
-
Tan Xinrong, Chen Shougen, Zhang Heng Optimization of ventilation during the construction of a large tunnel, based on air quality testing in the tunnel. Modern Tunnel Technology, Vol. 49, Issue 6, 2012, p. 152-156.
-
Zhang Ganju Simulation Study on Multiphase Flow Grow Up Along with the Harmful Gas. Lanzhou Jiaotong University, 2012.
-
Wang Min Numerical Simulation Research on Large Underground Cavern Excavation Construction of Ventilation and Smoke Exhaust Dust Exhausting Process. Central South University, 2014.
-
Deng Xin Research on Ventilation Technology of Super Long Underwater Tunnel. Chongqing Jiaotong University, 2012.
-
Zhang Hao, Zhao Zicheng, Liu Jianming, et al. The field test research of the toxic and harmful gas based on press-in ventilation of highway tunnel. Highway, Vol. 10, 2014, p. 274-279.
-
Niu Mingguo Tunnel construction ventilation technology and the dust control method. Sichuan Hydroelectric Power, Vol. 29, Issue 5, 2010, p. 36-38.
-
Deng Guoxiang, Jiao Hong Yuan, Zhao Xue Wu Tunnel construction dust mass concentration conversion coefficient K value change rule. Railway Occupational Safety Health and Environmental Protection, Vol. 21, Issue 3, 1994, p. 171-173.
