Abstract
The non-linear tube is widely used in military and civil fields and the general performance of the machine depends on the internal channel surface quality of it. The effective ways to improving the surface quality is solid-liquid two-phase abrasive flow polishing technology. So, the numerical analysis about the internal channel of non-linear tube polished by abrasive flow is implemented to analyze the effect of viscosity-temperature characteristics of abrasive flow polishing on the internal channel surface quality. Turbulent kinetic energy, intensity and viscosity, nephogram of the dynamic pressure distribution, and corresponding relation of temperature and turbulent kinetic energy, near the wall of non-linear tube, are received from the simulation in different initial turbulent kinetic energy and temperature which provides a theoretical basis for controlling the surface quality.
1. Introduction
Abrasive flow machining is polishing method by which the pressure applied by the back-and-forth flow of a soft abrasive viscoelastic medium is used to polish the surface of the machined part. The hard and sharp edges of the grain in the abrasive flow are used as cutting tools for achieving certain degree of polish [1]. The superiority of abrasive flow machining is its applicability to channels that cannot be easily accessed by general tools. Any part the abrasive flow goes through will be finished. When the abrasive grain work on the channels surface and corners of the worked parts, the deburring, polishing, and chamfering has been accomplished [2].
The contribution based on the point-cut that explores the internal relations of temperature, turbulent viscosity, turbulence kinetic energy, turbulence intensity and dynamic pressure, develops the relationship of temperature and turbulent viscosity, and search the internal relation of the surface quality on non-linear tube component and the viscosity-temperature characteristics of solid-liquid two-phase of abrasive flow.
2. The development of non-linear tube model
2.1. The development of physical non-linear tube model
The non-linear tube is widely used in military and civil fields. This article selects the fuel spray nozzle, a kind of non-linear tube components, as studied object to carry on numerical thermodynamic analysis during polishing. Fuel spray nozzle is one of the important components in fuel supply system of engine. The polishing and deburring of tiny holes inside the nozzle are always a problem that is solved and improved. Nozzle of tiny holes machining quality directly affect the properties of the spray nozzle, oil line penetration and flow coefficient, and they will ultimately have an effect on the economy, power performance and emission of the engine. Its geometric model is shown in Fig. 1.
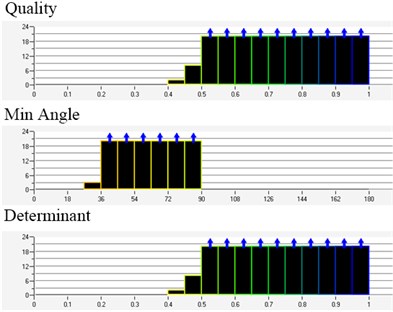
Because of the fact that abrasive flow is a viscous fluid, it is necessary to analyze the flow field parameter of the part near the wall of work-piece machined like dynamic pressure, turbulence kinetic energy and so on. The structure of inner channel on non-linear tube is very simply, and it is meshed by unstructured hexahedron [3, 4]. The expression after meshing is shown in Fig. 2. To obtain high quality grid, it is necessary to inspect some common indices of the grid quality on non-linear tube. The model meshing and inspection of grid quality is shown in Fig. 3.
Fig. 1The geometric model of nozzle parts

Fig. 2The U-tube grid map

Fig. 3The quality inspection of U-type pipe
2.2. The boundary conditions and initial conditions
The abrasive flow polishing process is the complicated turbulent flow. There is strong interaction between the average flow and turbulence pulsation, and turbulent numerical simulation results are more easily affected by grid than laminar flow [5-7]. In order to ensure the accuracy of the calculation results, the choice for turbulent flow in the region near the wall is the region that average flow change quickly and average stress is larger [8-10]. On computing grid approach, the method of adding boundary layer applies to the region of the flow near the wall part, and a particular area is defined between the internal grid and the surface grid of flow area, to ensure the accuracy of turbulence calculation.
According to the characteristics of abrasive flow polishing, using the module of preamplifier ICEM in the FLUENT software carry out construction of geometry, boundary conditions and mesh generation in flow area of non-linear tube job. Selecting uncoupled implicit double precision solver and carrying on numeric analysis based on RNG - solid liquid two phase turbulence model and MIXTURE turbulence model; taking abrasive flow medium carrier as the primary phase and silicon carbide grain as the second phase, and the volume fraction is 0.3; selecting velocity inlet and velocity outlet as boundary conditions and defining other wall as the solid wall boundary condition; considering gravity.
2.3. Result and discussion
The paper chooses a tank engine nozzle as the research object for numerical analysis. The diameter of entrance trunk road in nozzle is 4 mm and the branch’s is 0.3 mm. Based on different initial turbulent kinetic energy at the same speed and initial temperature conditions, it carry on numerical analysis to explore effects of turbulence kinetic energy, turbulence intensity, turbulence viscosity and dynamic pressure near the wall of none-linear tube trunk roads and branch when we set different initial turbulent kinetic energy, and with it we can analyze the effect of turbulence intensity in processing quality of abrasive flow polishing the non-linear tube. To get a clear simulation cloud image, we choose surface for numerical analysis. When the initial velocity is 80 m/s and the initial temperature is 300 K, we can obtain the nephogram of the turbulent kinetic energy, turbulence intensity and turbulence viscosity and dynamic pressure as shown from Fig. 4 to Fig. 7. The initial turbulent kinetic energy of the Fig. 4(a) is 3.375 m2/s2. Fig. 4(b) is 9.375 m2/s2. Fig. 4(c) is 13.5 m2/s2.
Fig. 4The non-linear tube turbulent kinetic energy nephogram in different initial turbulent kinetic energy
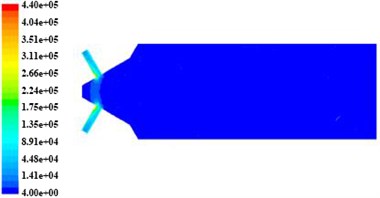
a) The inlet turbulence kinetic energy is 3.375 m2/s2
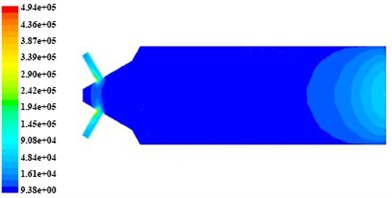
b) The inlet turbulence kinetic energy is 9.375 m2/s2
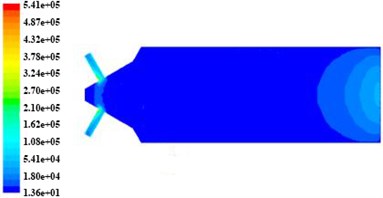
c) The inlet turbulence kinetic energy is 9.375 m2/s2
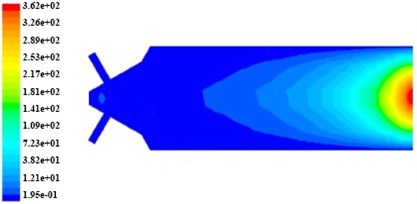
In Fig. 4 and Fig. 5, the turbulent kinetic energy and intensity in tube branch are more than that in trunk road, when the tube channel is machined, and both of them show a trend of decrease along the branch outlet direction. In Fig. 6, the turbulent viscosity change significantly in the tube and turbulent viscosity in trunk road is more than that in branch.
In Fig. 7, dynamic pressure in non-linear tube branch is bigger than that in trunk road and the dynamic pressure in cross hole is the bigger one. The nephogramt of turbulence intensity, viscosity and turbulent dynamic pressure express that it is in regional distribution, from the non-linear tube branch channel cross hole to export, and it can be divided into three regions: Region 1, Region 2, Region 3. It can get the nephogramt of turbulent kinetic energy, turbulent pressure and turbulent dynamic pressure in non-linear tube branch when the initial velocity is 80 m/s and the initial temperature is 300 K. The distribution of turbulent kinetic energy and turbulent pressure is shown in Table 1.
Table 1When the initial velocity is 80 m/s and the initial temperature is 300 K, the distribution of turbulent kinetic energy and turbulent pressure
The initial turbulent kinetic energy (m2/s2) | Turbulent kinetic energy (×104 m2/s2) | Turbulence intensity (104) | ||||
Region 1 | Region 2 | Region 3 | Region 1 | Region 2 | Region 3 | |
3.375 | 13.5 | 8.91 | 4.48 | 4.21 | 3.03 | 2.44 |
9.375 | 14.5 | 9.08 | 4.84 | 3.97 | 2.84 | 2.28 |
13.5 | 16.2 | 10.8 | 5.41 | 3.81 | 2.72 | 2.18 |
Fig. 5The non-linear tube turbulence intensity nephogram in different initial turbulent kinetic energy
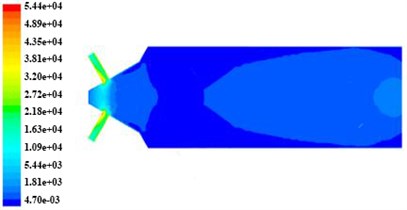
a) The inlet turbulence kinetic energy is 3.375 m2/s2
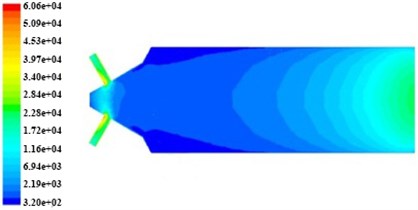
b) The inlet turbulence kinetic energy is 9.375 m2/s2
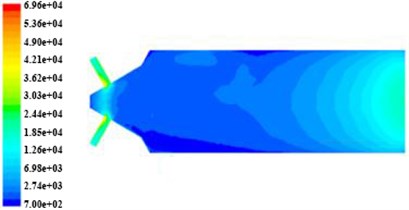
c) The inlet turbulence kinetic energy is 9.375 m2/s2
Fig. 6The non-linear tube turbulent viscosity nephogram in different initial turbulent kinetic energy
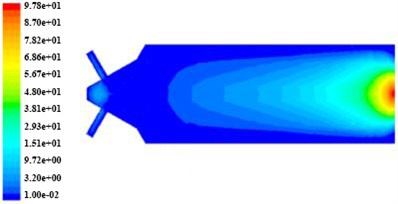
a) The inlet turbulence kinetic energy is 3.375 m2/s2
b) The inlet turbulence kinetic energy is 9.375 m2/s2
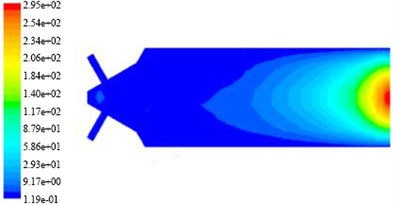
c) The inlet turbulence kinetic energy is 9.375 m2/s2
The data of Table 1 describes that during the initial turbulent kinetic energy increasing, the turbulent kinetic energy and turbulence intensity of the non-linear tube branch near the wall increases gradually, the values of the turbulent kinetic energy and turbulent intensity in the Region 1, 2, 3 of the non-linear tube branch decrease and then increase. Comparing with those data when the initial turbulent kinetic energy is 9.375 m2/s2, the distribution of turbulent kinetic energy and turbulence intensity in non-linear tube branch near the wall is better. When the initial velocity is 80 m/s, and the initial temperature is 300 K, the distribution of the turbulent viscosity and dynamic pressure in non-linear tube is shown in Table 2.
In Table 2, the turbulent viscosity increases and then reduce along with the increase of the initial turbulent kinetic energy, and the turbulent viscosity difference between values among area 1, 2, 3 of the non-linear tube branch decrease and then increase; With the increase of initial turbulent kinetic energy, the dynamic pressure increases gradually, while the dynamic pressure difference among area 1, 2, 3 of non-linear tube branch central increase and then decrease. Through analysis and comparison, when the initial turbulent kinetic energy is 9.375 m2/s2, the turbulent viscosity and dynamic pressure distributes well.
Table 2When the initial velocity is 80 m/s and the initial temperature is 300 K, the distribution of the turbulent viscosity and dynamic pressure in non-linear tube
The initial turbulent kinetic energy (m2/s2) | Turbulent viscosity (kg/m·s) | Dynamic pressure (×103 MPa) | ||||
Region 1 | Region 2 | Region 3 | Region 1 | Region 2 | Region 3 | |
3.375 | 15.1 | 9.27 | 2.20 | 5.41 | 5.39 | 5.37 |
9.375 | 72.3 | 38.2 | 12.1 | 5.45 | 5.44 | 5.43 |
13.5 | 58.6 | 29.3 | 9.17 | 5.52 | 5.50 | 5.48 |
Fig. 7The non-linear tube turbulent dynamic pressure nephogram in different initial turbulent kinetic energy
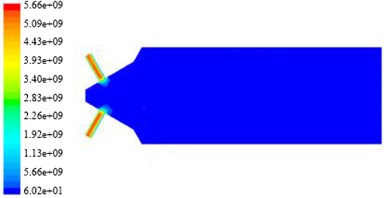
a) The inlet turbulence kinetic energy is 3.375 m2/s2
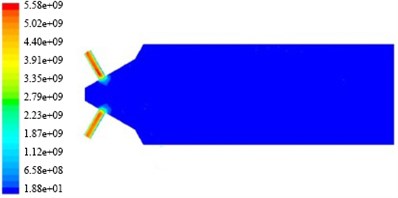
b) The inlet turbulence kinetic energy is 9.375 m2/s2
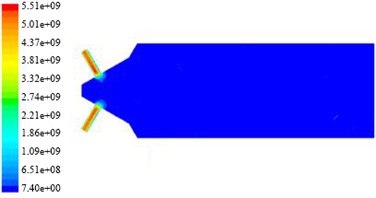
c) The inlet turbulence kinetic energy is 9.375 m2/s2
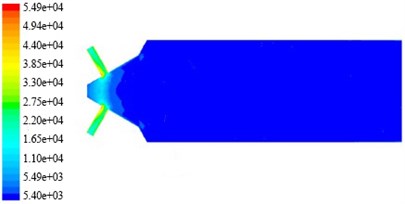
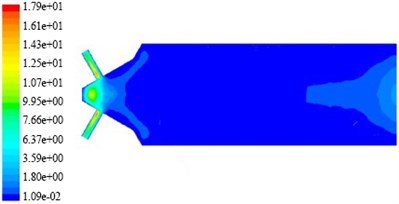
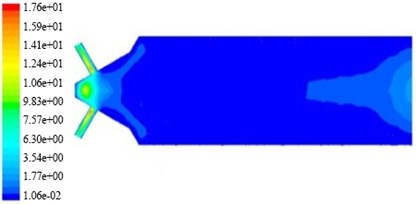
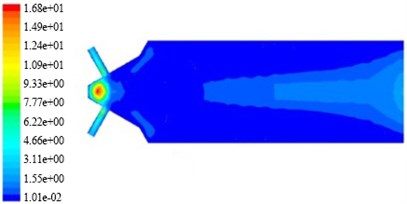
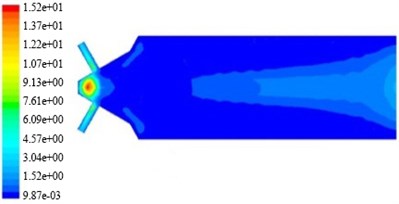
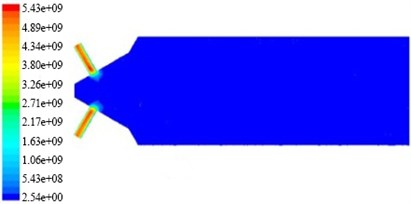
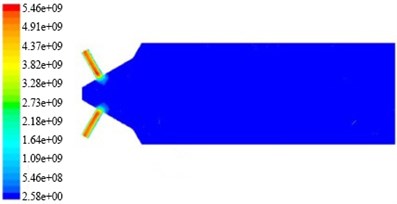
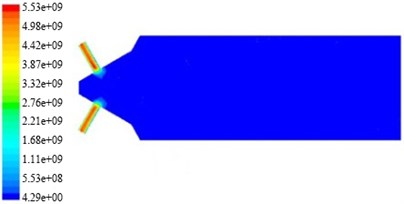
To discuss the effects of temperature characteristics on abrasive flow polishing, when the initial turbulent kinetic energy is 9.375 m2/s2 and initial velocity is 80 m/s, we perform numerical simulation for abrasive flow polishing at different temperature. It can obtain the nephogram of the turbulent kinetic energy, turbulence intensity, turbulence viscosity and dynamic pressure near the wall of the non-linear tube branch and trunk road. At the same way, we analyze the relationship of temperature characteristic and quality of the non-linear tube channel surface polished by abrasive flow in surface. The nephogram of the turbulent kinetic energy, turbulence intensity, turbulence viscosity and dynamic pressure in the condition is shown from Fig. 8 to Fig. 11 and in Fig. 8(a), Fig. 8(b), Fig. 8(c), Fig. 8(d) the initial temperature is 290 K, 300 K, 310 K, 320 K.
To discuss the effects of temperature characteristics on abrasive flow polishing, when the initial turbulent kinetic energy is 9.375 m2/s2 and initial velocity is 80 m/s, we perform numerical simulation for abrasive flow polishing at different temperature. It can obtain the nephogram of the turbulent kinetic energy, turbulence intensity, turbulence viscosity and dynamic pressure near the wall of the non-linear tube branch and trunk road. At the same way, we analyze the relationship of temperature characteristic and quality of the non-linear tube channel surface polished by abrasive flow in surface. The nephogram of the turbulent kinetic energy, turbulence intensity, turbulence viscosity and dynamic pressure in the condition is shown from Fig. 8 to Fig. 11 and in Fig. 8(a), Fig. 8(b), Fig. 8(c), Fig. 8(d) the initial temperature is 290 K, 300 K, 310 K, 320 K.
Fig. 8Turbulent kinetic energy nephogram on non-linear tube channel in different initial temperature
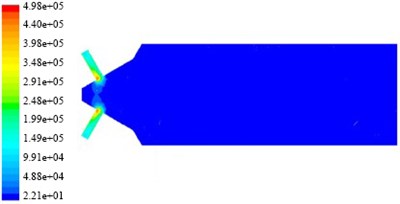
a) The temperature is 290 K
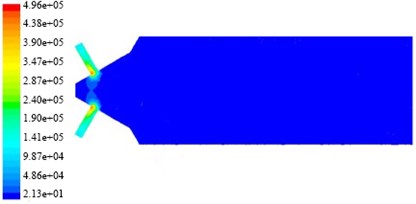
b) The temperature is 300 K
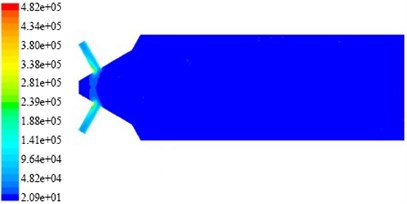
c) The temperature is 310 K
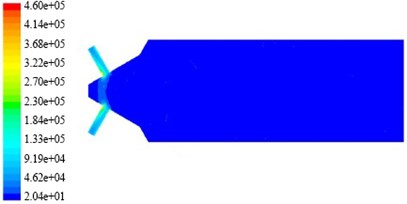
d) The temperature is 320 K
Fig. 9Turbulence intensity nephogram on non-linear tube channel in different initial temperature
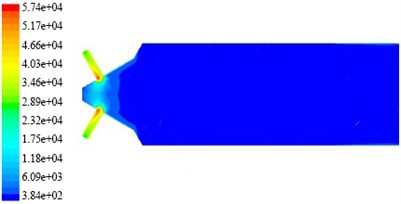
a) The temperature is 290 K
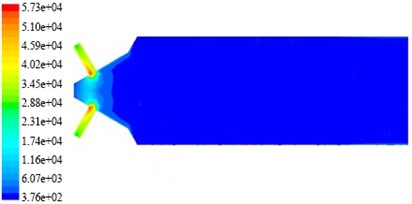
b) The temperature is 300 K
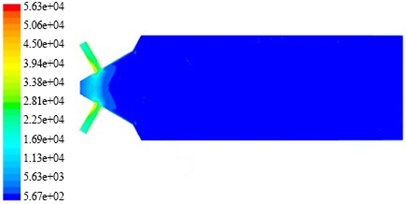
c) The temperature is 310 K
d) The temperature is 320 K
In the Fig. 8 and Fig. 9, the distribution of turbulence kinetic energy and turbulence intensity in tube branch is symmetrical. The turbulent kinetic energy and turbulence intensity in branch is greater than that in trunk road and the value of them in the interchange of trunk road and branch have reached the maximum one. This suggests that the main effect of abrasive flow polishing process has been put on branch channel of the non-linear tube. The random motion of the abrasive in non-linear tube is more intense, and the most active place is in cross hole, which contributes to the polishing process in the branch channel and branch cross hole deburring, fillet process. It is beneficial to improve the injection performance of nozzle microporous. Turbulent viscosity refers to strong eddy diffusion caused by random pulse when the fluid is in a state of turbulence.
In Fig. 10, in a non-linear tube branch outlet, due to the decreasing of cross-sectional area of abrasive flow fluid decreases, the diffusion of abrasive flow vortex enhanced, which makes the turbulent viscosity value increases gradually, and the turbulent viscosity value of the non-linear tube branch is greater than turbulent viscosity.
Fig. 10Turbulence viscosity nephogram on non-linear tube channel in different initial temperature
a) The temperature is 290 K
b) The temperature is 300 K
c) The temperature is 310 K
d) The temperature is 320 K
Fig. 11Dynamic pressure nephogram on non-linear tube channel in different initial temperature
a) The temperature is 290 K
b) The temperature is 300 K
c) The temperature is 310 K
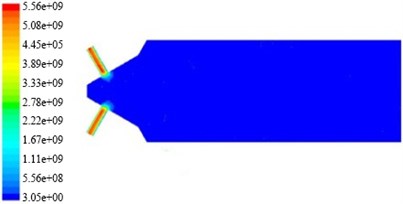
d) The temperature is 320 K
In Fig. 11, the non-linear tube branch channel dynamic pressure is greater than one of the dynamic pressure, and symmetrical distributed in a branch from the wall to the center of state, and more to the center. Temperature change have little effect on the non-linear tube branch channel dynamic pressure, the dynamic pressure is slightly increased with the increase of temperature. We can see from the nephogram of turbulent kinetic energy, turbulence intensity, turbulence viscosity and dynamic pressure that from cross hole to export in the non-linear tube branch channel, they distribute periodically, and the channel can be divided into three regions, the same as: Region 1 and Region 2, Region 3. When the initial rate is 80 m/s, and the initial turbulent kinetic energy is 9.375 m2/s2, the non-linear tube branch of the turbulent kinetic energy, turbulence intensity, turbulence viscosity and dynamic pressure simulation nephogram, and turbulence kinetic energy and turbulence intensity distribution are shown in Table 3.
Table 3when the initial velocity is 80 m/s and the initial turbulent kinetic energy is 9.375 m2/s2, the distribution the turbulent viscosity and dynamic pressure in the non-linear tube branch
The initial temperature (K) | Turbulence kinetic energy (×105 m2/s2) | Turbulence intensity (104) | ||||
Region 1 | Region 2 | Region 3 | Region 1 | Region 2 | Region 3 | |
290 | 3.48 | 2.91 | 2.48 | 4.66 | 4.03 | 3.46 |
300 | 3.47 | 2.87 | 2.40 | 4.59 | 4.02 | 3.45 |
310 | 3.38 | 2.81 | 2.39 | 4.50 | 3.94 | 3.38 |
320 | 3.22 | 2.70 | 2.30 | 4.40 | 3.85 | 3.30 |
Table 4when the initial velocity is 80 m/s and the initial turbulent kinetic energy is 9.375 m2/s2, the distribution of turbulence kinetic energy and turbulence intensity on the non-linear tube branch
The initial temperature (K) | Turbulent viscosity (Kg/m·s) | Dynamic pressure (×103MPa) | ||||
Region 1 | Region 2 | Region 3 | Region 1 | Region 2 | Region 3 | |
290 | 12.5 | 10.7 | 9.95 | 5.43 | 4.89 | 4.34 |
300 | 12.4 | 10.6 | 9.83 | 5.46 | 4.91 | 4.37 |
310 | 10.9 | 9.33 | 7.77 | 5.53 | 4.98 | 4.42 |
320 | 10.7 | 9.13 | 7.61 | 5.56 | 5.08 | 4.45 |
Fig. 12The corresponding relations between the turbulent kinetic energy and the temperature in the non-linear tube branch channel
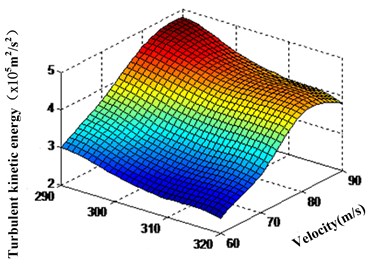
a) The corresponding relations between the turbulent kinetic energy and the temperature among area 1
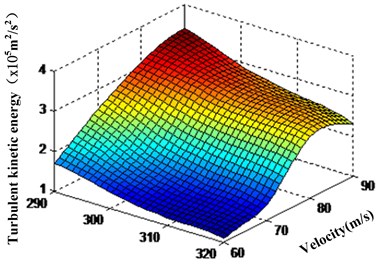
b) The corresponding relations between the turbulent kinetic energy and the temperature among area 2
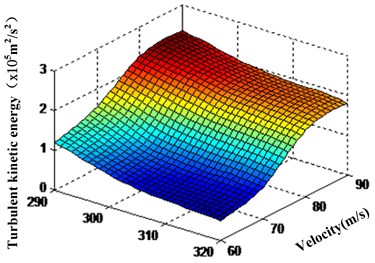
c) The corresponding relations between the turbulent kinetic energy and the temperature among area 3
In Table 3, the turbulent kinetic energy and turbulence intensity among area 1 and area 2, area 3 of the non-linear tube branch decrease with the increase of initial temperature, which is associated with the viscosity of abrasive flow. Solid particles volume fraction used in non-linear tube channel simulated machining with abrasive flow is only 0.1. When the temperature is high, abrasive has almost no effect on grinding, which makes the turbulent kinetic energy and turbulence intensity near the wall of the branch decreasing. When the initial velocity is 80 m/s and the initial turbulent kinetic energy is 9.375 m2/s2, the distribution the turbulent viscosity and dynamic pressure in the non-linear tube branch is shown in Table 4.
In Table 4, the turbulent viscosity decreases gradually with the temperature of abrasive increasing, and reduction of it is decreased firstly and increased subsequently. Contrast analysis of the data in Table 4, it is found that when the initial temperature is 310 K, turbulent viscosity difference near the wall and among area 1 and area 2, area 3 of the non-linear tube branch is small, and the value distribution of dynamic pressure of the wall closed to branch is Region 1 > Region 2 > Region 3. From Table 1 to Table 4, we can see that the corresponding relations between the turbulent kinetic energy and the temperature in every region of the branch channel can be obtained, and the corresponding relations between the turbulent kinetic energy and the temperature among area 1 and area 2, area 3 in branch channel is as shown in Fig. 12(a), Fig. 12(b) and Fig. 12(c).
It can be seen from Fig. 12 that turbulent kinetic energy in every region of the non-linear tube branch decreases with the processing temperature increasing. Turbulent kinetic energy reach maximum in the junction of the trunk road and branch of the region 1. Abrasive flow in the non-linear tube is the most intense exercise on cross hole, and grinding grain also is the most active in this place, which is good at the non-linear tube cross hole deburring and fillet processing and promoting the quality of the non-linear tube polished by abrasive flow. It can effectively improve the nozzle jet performance and save fuel.
3. Conclusions
With numerical simulation, we can imply that the turbulent kinetic energy and intensity in channel are increased gradually with the increase of the initial turbulent kinetic energy, and turbulent viscosity in channel decreased firstly and then increased with the increase of the initial turbulent kinetic energy. The dynamic pressure near the wall of channel became progressively smaller. Through analysis and comparison, we infer that the distribution uniformity of turbulent kinetic energy, intensity, viscosity and dynamic pressure near the wall of channel is good, with 9.375 m2/s2 of initial turbulent kinetic energy.
The turbulent kinetic energy and intensity near the wall of channel decreases with the rise of temperature, and with higher temperature, the reduction of turbulence kinetic energy and intensity is not obvious, which is connected with viscosity of the abrasive flow; When the temperature is higher, the viscosity of abrasive flow will fell to a critical point, and at this time abrasive flow almost have no cutting effect on the wall closed to channel. Then the turbulent flow pulsation intensity of abrasive flow is smaller, which contribute to the decrease of turbulence kinetic energy and turbulence intensity in channel. As the abrasive flow temperature rise, turbulent viscosity in channel decreases. The temperature has small effect on dynamic pressure in channel, but the change of temperature will affect the distribution of dynamic pressure, and with the increase of temperature, the distribution of dynamic pressure will become homogenization.
References
-
Junye Li, Lifeng Yang, Weina Liu, et al. Experimental research of non-linear tube runner of abrasive flow machining process. Advances in Mechanical Engineering, 2014, https://doi.org/10.1155/2014/752353.
-
Li Junye, Liu Weina, Yang Lifeng Study of abrasive flow machining parameter optimization based on taguchi method. Journal of Computational and Theoretical Nanoscience, Vol. 10, Issue 12, 2013, p. 2949-2954.
-
Tan Yuanqiang, Li Yi, Shen Yong On the model and pressure simulation of solid-fluid two phase flow for abrasive flow machining. China Mechanical Engineering, Vol. 19, Issue 4, 2008, p. 439-441.
-
Li Di, Wang Yuesheng, Zhang Yurong Numerical simulation on rupture of aneurysm based on liquid-solid two-phase flow. Journal of Engineering Thermophysics, Vol. 34, Issue 7, 2013, p. 1291-1294.
-
Ji Shiming, Fu Youzhi, Tan Dapeng Numerical analysis and processing experiment of double-inlet restraint flow field in the soft abrasive flow machining. Journal of Mechanical Engineering, Vol. 19, 2012, p. 177-185.
-
Wu Xiaomin, Xiong Yong, Wang Weichneg, et al. Numerical simulation of two phase flow distribution in narrow rectangular maniflods. Journal of Engineering Thermophysics, Vol. 29, Issue 5, 2008, p. 837-839.
-
Ji Shiming, Ma Baoli, Tan Dapeng Numerical analysis of soft abrasive flow in structured restraint flow passage. Optics and Precision Engineering, Vol. 19, Issue 9, 2011, p. 2092-2099.
-
Jain V. K., Jayswal S. C., Dixit P. M. Modeling and simulation of surface roughness in magnetic abrasive finishing using non-uniform surface profiles. Materials and Manufacturing Processes, Vol. 22, Issue 2, 2007, p. 256-270.
-
Bremerstein T., Potthoff A., Michaelis A., et al. Wear of abrasive media and its effect on abrasive flow machining results. Wear, 2015, Vol. 342, Issue 343, 15, p. 44-51.
-
Droubi M. G., Reuben R. L. Monitoring acoustic emission (AE) energy of abrasive particle impacts in a slurry flow loop using a statistical distribution model. Applied Acoustics, Vol. 113, 2016, p. 202-209.
About this article
The authors would like to thank the National Natural Science Foundation of China No. NSFC 51206011, Jilin Province Science and Technology Development Program of Jilin Province No. 20160101270JC and No. 20170204064GX, Project of Education Department of Jilin Province No. 2016386.
