Abstract
Wind turbines are operating in varying conditions. Therefore, the recorded signal is highly nonstationary. The typical approach for damage detection in long term data is based on the energy and spectral analysis. This method, suffer for several drawbacks, especially for the signals with high contamination. Thus, the alternative approach is the application of statistical parameters that may indicate the damage. In order to indicate the frequency band corresponding to the damage the proper statistics are used. In this paper, the well know spectral kurtosis and another statistic are applied to the long-term vibration data from wind turbine. Their performance is compared with the standard energy based methods. It is showed that selectors are able to track the damage development and distinguish between healthy and unhealthy case.
1. Introduction
The vibration based condition monitoring plays a key role in maintenance of the machines. Therefore, it is expected to design the robust methods for damage detection at early stage and monitoring of change of condition until replacement/repair economically efficient. It was proven that analysis of the vibration signal can inform the user about the damage in rotating machines. However, there are just a few reports or studies for long term data monitoring (mostly for wind turbines). In this paper, the long term signal from the wind turbine is investigated. Wind turbines are recognised as time-varying systems [1, 2]. Indeed, vibrations from these are highly nonstationary and condition monitoring is extremely difficult [3]. Non-stationarity of operating condition is typical for many mechanical systems (helicopters, automotive industry, mining machines, etc.). It was proved that for such machines the load of the operation has to be taken into account [4]. In this paper, data presented and used for long term monitoring are pre-selected. We use segments of signals with approximately similar loading conditions. The typical approach is based on tracking the signal energy (e.g. RMS, p2p, energy of signal or energy in specific bands, etc.). More advanced approaches based on spectral analysis (spectrum, envelope spectrum). The resonance demodulation was successfully applied to inspection of rolling elements bearings [5] and gear tooth cracks [6]. However, such methods suffer for several drawbacks. Indeed, it is highly difficult to set threshold which properly determines the most suitable time for the repair. Such threshold should be defined for each type of machine, for each component, separately. Usually it is selected experimentally, without any deep theoretical studies. Alternative approach might be based on statistical parameters, which properties are well defined. The most prominent example of such parameter might be kurtosis. Certainly, kurtosis applied to raw, or filtered signal is often used as indicator of localised damage. More advanced application is related to estimation of so called spectral kurtosis (SK), i.e. distribution of kurtosis along frequency. At this point, SK was used to identify frequency band with impulsive behaviour [7, 8]. Furthermore, in [9] the performance of SK for detection of tooth crack in the planetary gear of wind turbine was tested. The filtering procedure based on SK for denosing the signal was proposed in [10]. However, in case of many real complex data the SK is not a sufficient. Therefore, many novel methods were introduced in the literature. The extension of SK was described in [11]. Furthermore, in [12] many different selectors were proposed. It was proved that they can outperform the SK in local damage detection. It is worth mentioning that, the probability distribution (i.e. stable and tempered stable) can be applied for the indication of the fault in the rotating machines [13, 14].
In this paper, the statistical parameters are applied to detect and monitor frequency band, which contain information about the fault. It is going to be proved that information about optimal frequency band (OFB) might be diagnostic feature. Furthermore, it is showed that informative frequency band is wider and “more clear” in sense of amplitude of proposed indicators for growing fault. The kurtosis is applied and its benefit and drawback are highlighted, next recently proposed OFB indicator (novel selector to select OFB) is used and compared to energy and kurtosis based approaches. It is believed that the analysis performed for the wind turbine can be expanded for the roadheader, kind of mining machine used for underground tunnelling. The signals recorded on such machine contain many different components, which extraction is challenging [15]. Moreover, due to the operating in harsh condition the level of the noise is extremely high and signal is contaminated. Therefore, it could be beneficial to apply the statistical approach.
2. Methodology
The proposed methodology is based on the vibration signal analysis. This approach is powerful in detection of local damages in rotating machinery. It is expected that signal recorded on the healthy machine would be similar to the Gaussian noise. Therefore, for constant load it should be stationary. On the other hand, in case of faulty machine the recorded signal is going to be nonstationary. Indeed, the cyclic impulses should be detected in the signal. Furthermore, it is expected that the damage can influence the energy of the signal. Therefore, the typical approach for analysis of long term data is based on the envelope spectrum. It is a perfect tool for tracking the changes in the energy. However, the main drawback is that signal energy depends on the type of the machine and the working condition. Indeed, for the machine operating in harsh condition the amplitude of the noise can be high, which influences high energy. Therefore, it is difficult to set threshold which properly determines the most suitable time for the repair. In this case the threshold has to be designed for each operating load, machine and type of the load separately.
In order to overcome this problem, the signal statistics can be applied in order to indicate the impulsive behavior related to damage. There is enormous variety of methods, which can be used. One of the most common approach for damage detection in rotating machines is the optimal frequency band selection. In the first step, the signal is transformed to the time frequency domain. In order to this the Short Time Fourier Transform (STFT) is calculated:
for , and is the window of length . The spectrogram is the absolute value of STFT. OFB selection is based on the indication of the carrier frequency bands in which the information about the fault is contained. Then such statistic can be applied to design the filter characteristic. Finally, the filtered signal contains component with the fault. The most typical way to determine OFB is spectral kurtosis (SK), which is the basic selector. According to the algorithm for each frequency band in STFT the kurtosis is calculated. The , for given frequency bin , has following formula:
where is number of windows in STFT. Therefore, for the Gaussian stationary noise the value of the SK should be equal to 0. In case of nonstationary signal with impulses, SK should be significantly higher than 0. In many signals SK is satisfactory in damage detection. However, it is showed that in some cases SK can be sensitive to artefacts, which occur for various types of mining machines [10] and also can be found in wind turbine. Therefore, another selector of OFB are proposed. In this paper, the performance of one of them is tested. It is proposed to use the selector based on the quantile-quantile plot (QQplot). It measures the distance between the empirical quantiles from the STFT subsignals and the quantiles of standard Gaussian distribution. In this case it is reasonable to measure the distance between empirical and Gaussian distribution. The time series from spectrogram related to OFB exhibits impulsive behavior, that causes its distribution is obvious not Gaussian. The measured distance from Gaussian distribution is higher than for time series not related to OFB. The QQplot selector is defined as:
where is the inverse of cumulative distribution function of standard normal distribution, is the -th value of ascending sorted subsignal from for all , , and is -th order quantile from subsignal . Therefore, the statistic is sum of the distance between quantiles. In case of the Gaussian noise the QQplot selector should be close to 0. Once the signal is significantly different than noise (i.e. it contains some impulses) it is going to be higher.
3. Application to real data
In this paper, the vibration signal recorded on the wind turbine is analysed. The sampling frequency is equal to 25 kHz and each signal has length of 3 seconds. In the analysis 18 different measurements were taken into consideration. The time horizon is five months. During this period the damage of the bearing revealed and this part was replaced. The main goal of the paper is to test the performance of statistical approach for damage detection in case of long term vibration data. Thus, the selectors (SK and QQplot) are going to be calculated for each measurement. Finally, they are going to be presented in the heat map. It is expected that statistic should increase with respect to damage development. Therefore, the data for healthy and unhealthy machine is analysed. Signals are presented in Fig. 1.
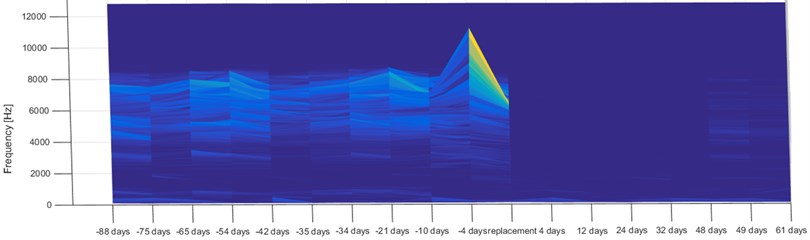
One can observe that the replacement was done for day 0. The amplitude before the repair was significantly higher. In the first step, the signal is transformed to the time frequency domain. In Fig. 2 the spectrograms for each measurement are presented.
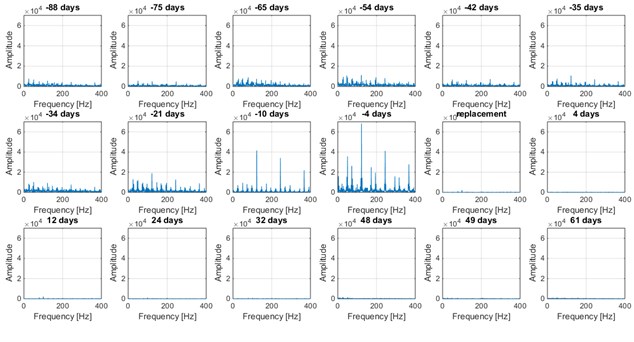
One can observe that the spectrograms are significantly different for each signal. In case of the spectrogram from 4 days before replacement cyclic excitation for carrier frequency reveals around 5 kHz. After the replacement of the bearing the energy for frequency band close to 5 kHz is significantly lower than before. The standard energy approach is based on the analysis of the signal envelope spectrum. It is expected that for the damaged bearing vibration data it should have higher energy. In Fig. 3 the envelope spectrums for each measurement are presented. Indeed, the highest values are observed for the signal before the replacement. Immediately, after the new bearing was used the values of envelope spectrum decreased.
Fig. 1The raw vibration signals recorded on the wind turbine
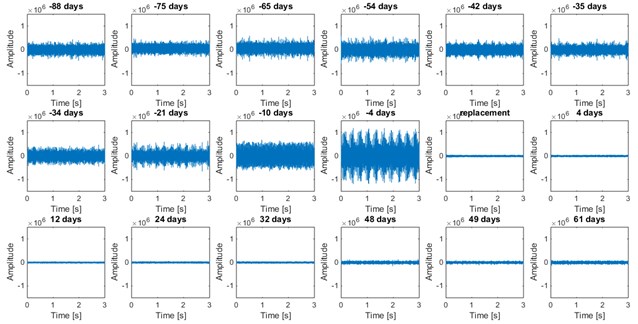
Fig. 2Spectrograms for the vibration signal. The window size is equal to 1024, overlap is 0.9 and Fourier transform is calculated in 2048 points
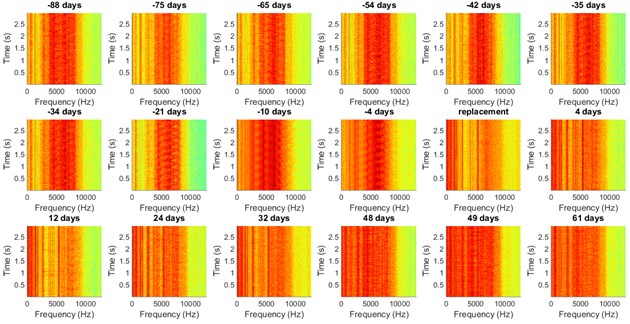
Fig. 3Envelope spectrum for the vibration signal
In the next step, the spectral kurtosis for each signal is computed (Fig. 4). Clearly, the highest value is obtained for 12 days after replacement, when the bearing had already been replaced. Therefore, the indication of SK is not correct. The values for all measurements are quite comparable and it is difficult to distinguish the healthy and unhealthy case.
Furthermore, it cannot be observed the development of the damage using SK. According to SK map (Fig. 5) the kurtosis is not increasing with respect to time.
Once the typical selector failed it is reasonable to test the more robust one. Therefore, the QQplot selector was applied to the data. The results are illustrated in Fig. 6. It can be observed that the selectors properly indicate the OFB (around 5 kHz). Moreover, the value of the statistic is increasing with respect to time and after the replacement it is almost flat.
In Fig. 7 the QQplot heat map is presented.
Fig. 4Spectral kurtosis for the vibration signal
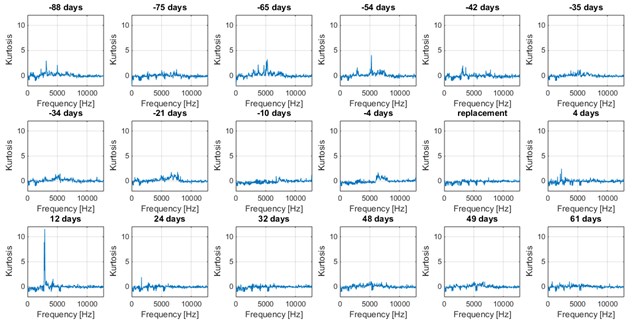
Fig. 5Kurtosis map for the vibration signal
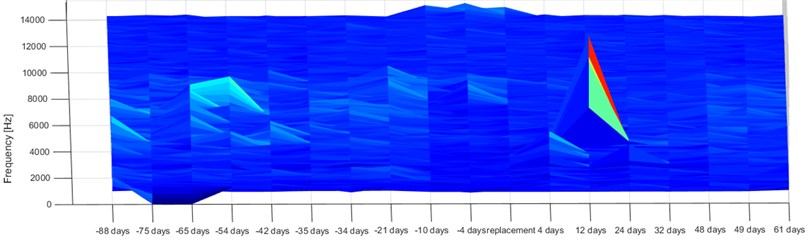
Fig. 6QQplot for the vibration signal
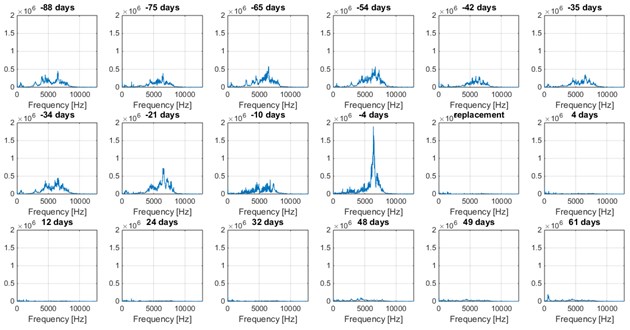
Fig. 7QQplot map for the vibration signal
4. Conclusions
The paper is focused on the analysis of the long-term vibration data from the wind turbine. The investigated machine had the damaged bearing which was replaced in the analysed period. It is showed that the statistical approach can inform the user about the damage development. One can observe that, both energy and statistical method indicate the unhealthy machine. However, the usage of statistics has some advantages. Indeed, in case of the envelope spectrum it is challenging to properly set the threshold in order to indicate the damage. The energy of the signal depends on the machine and the operating load. On the other hand, statistics do not suffer for such drawback. Once the values are significantly higher than 0, the signal is not-stationary. Therefore, the recorded data contain some information about the fault. This preliminary study shows that statistical approach can be applied in long term analysis. In the future, it is planned to test the performance of another selectors. Finally, it is planned to design the procedure for decision when is the most suitable time for the repair. Furthermore, the applicability of similar procedures for the vibration signal from road header is going to be tested. Similarly, to wind turbine, the road header is operating in time varying conditions. It is expected that the statistical approach is more reasonable for condition monitoring of such machines.
References
-
Hameed Z., Hong Y., Cho Y., Ahn S., Song C. Condition monitoring and fault detection of wind turbines and related algorithms: a review. Renewable and Sustainable energy reviews, Vol. 13, 2009, p. 1-39.
-
Kusiak A., Li W. The prediction and diagnosis of wind turbine faults. Renewable Energy, Vol. 36, 2011, p. 16-23.
-
Zimroz R., Bartelmus W., Barszcz T., Urbanek J. Diagnostics of bearings in presence of strong operating conditions non-stationarity- a procedure of load-dependent features processing with application to wind turbine bearings. Mechanical Systems and Signal Processing, Vol. 46, 2014, p. 16-27.
-
Bartelmus W., Zimroz R. A new feature for monitoring the condition of gearboxes in non-stationary operating conditions. Mechanical Systems and Signal Processing, Vol. 23, 2009, p. 1528-1534.
-
Mcfadden P., Smith J. Vibration monitoring of rolling element bearings by the high-frequency resonance technique-a review. Tribology International, Vol. 17, 1984, p. 3-10.
-
Wang W. Early detection of gear tooth cracking using the resonance demodulation technique. Mechanical Systems and Signal Processing, Vol. 15, 2001, p. 887-903.
-
Antoni J., Randall R. The spectral kurtosis: application to the vibratory surveillance and diagnostics of rotating machines. Mechanical Systems and Signal Processing, Vol. 20, 2006, p. 308-331.
-
Antoni J. The spectral kurtosis: a useful tool for characterising non-stationary signals. Mechanical Systems and Signal Processing, Vol. 20, 2006, p. 282-307.
-
Barszcz T., Randall R. B. Application of spectral kurtosis for detection of a tooth crack in the planetary gear of a wind turbine. Mechanical Systems and Signal Processing, Vol. 23, 2009, p. 1352-1365.
-
Combet F., Gelman L. Optimal filtering of gear signals for early damage detection based on the spectral kurtosis. Mechanical Systems and Signal Processing, Vol. 23, 2009, p. 652-668.
-
Barszcz T., Jabłonski A. A novel method for the optimal band selection for vibration signal demodulation and comparison with the kurtogram. Mechanical Systems and Signal Processing, Vol. 25, 2011, p. 431-451.
-
Obuchowski J., Wyłomanska A., Zimroz R. Selection of informative frequency band in local damage detection in rotating machinery. Mechanical Systems and Signal Processing, Vol. 48, 2014, p. 138-152.
-
Zak G., Wyłomanska A., Zimroz R. Application of alpha-stable distribution approach for local damage detection in rotating machines. Journal of Vibroengineering, Vol. 17, 2015, p. 2987-3002.
-
Wyłomanska A., Zak G., Kruczek P., Zimroz R. Application of tempered stable distribution for selection of optimal frequency band in gearbox local damage detection. Applied Acoustics, Vol. 128, 2017, p. 14-22.
-
Wodecki J., Wyłomanska A., Połoczanski R., Zimroz R. A new segmentation method of roadheader signal based on the statistical analysis of waiting times. Vibroengineering Procedia, Vol. 7, 2016, p. 59-64.
About this article

This work is supported by EIT RawMaterials GmbH under Framework Partnership Agreement No. 16136 (RockVader-Smart Hard Rock Mining System).
