Abstract
When people stay in the vibrating environment for a long time, the body may produce a series of physiological and psychological diseases. In order to evaluate the impact of vibration on the human body, the establishment of evaluation method or evaluation system is necessary. At present, most countries usually evaluate whole-body vibration based on the international standard ISO 2631-1 “Mechanical vibration and shock-Evaluation of human exposure to whole-body vibration-Part 1: General requirements”. In this paper, the experiments of perception threshold of whole-body vibration were taken as the breakthrough point of evaluation method, and 12 subjects participated in the experiments. Through the experiments, comparing the provisions of ISO 2631-1, we get some different conclusions about the distribution law of perception thresholds. This also provides some data support for further experimental research.
1. Introduction
Many scholars have done a lot of research on whole-body vibration [1, 2]. However, there are many parameters to evaluate the effect of vibration on the human body, such as vibration intensity, vibration frequency, vibration exposure time and subjective feelings, etc. Therefore, it is very difficult to establish a criterion or method for evaluating the effect of vibration on the human body. At present, most countries usually evaluate whole-body vibration based on the international standard ISO 2631-1 [3]. China adopted this standard in 2007, and published the recommended standard of GBT 13441.1-2007 “Mechanical vibration and shock-Evaluation of human exposure to whole-body vibration-Part 1: General requirements”. In this standard, the basic evaluation method of vibration on the human body is proposed, and the evaluation factors and weighting factors are recommended. Besides, it is recommended to use the root-mean-square value of the weighted acceleration to evaluate the impact of vibration. However, the standard does not explain the source of the underlying data, such as frequency weighted factors, perception thresholds, etc., so we do not know whether these provisions and numerical value apply to the Chinese people as well. In this paper, we carried out the experimental study of the perception thresholds, and it was taken as the breakthrough point of the whole-body vibration study. A study was done to measure standing vibration perception thresholds in the vertical direction at 12.5, 20, 25, 31.5, 40, 50, 63, and 80 Hz.
2. The experiments
2.1. Test equipment
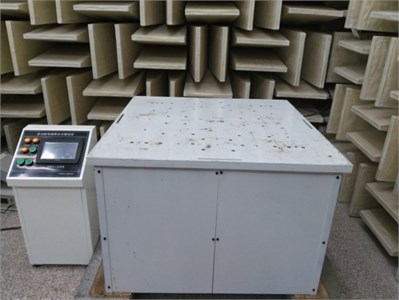
We carried out the whole-body vibration experiments by electromagnetic vibration platform. In order to eliminate the influence of ambient vibration, rubber pads were laid at the bottom of the shaking table. The vibration platform is shown in Fig. 1, and the main parameters are shown in the following Table 1.
Table 1Parameters of the vibration platform
Modes of vibration | single frequency stimulus and swept frequency stimulus |
Direction of stimulus | , and axis |
Frequency range of stimulus | 1Hz to 600 Hz (minimum frequency interval is 0.1 Hz) |
Amplitude of vibration | 0 mm to 5 mm |
Maximum acceleration | 20 g |
Maximum load | 150 kg |
Fig. 1The vibration platform
2.2. The subjects
In this paper, 12 subjects participated in the experiments, including 6 females and 6males. To ensure the reliability of the experimental data, all subjects were healthy and without related diseases, such as respiratory diseases, cardiovascular diseases, skeletal and muscular diseases, etc.
The subjects were between 22 and 28 years old, and the average height was 167 cm. Body mass index (BMI) is commonly used to the standard that measure body fat levels and whether the body is health. Among the subjects, the BMI of one of them is overweight (24.0 < BMI ≤ 26.9) and the other one is severe obesity (BMI ≥ 30). The BMI of the other subjects is in the normal range (18.5 ≤ BMI < 23.9). The body condition of the subjects is shown in the following Table 2.
Table 2Condition of the subjects
Name | Gender | Age | Height (cm) | Weight (kg) | BMI |
Subj.1 | Female | 22 | 167 | 60 | 21.5 |
Subj.2 | Female | 25 | 160 | 50 | 19.5 |
Subj.3 | Female | 24 | 167 | 60 | 21.5 |
Subj.4 | Female | 28 | 164 | 54 | 20.1 |
Subj.5 | Female | 28 | 163 | 64 | 24.1 |
Subj.6 | Female | 25 | 170 | 55 | 19.0 |
Subj.7 | Male | 25 | 173 | 67 | 22.4 |
Subj.8 | Male | 28 | 170 | 60 | 20.8 |
Subj.9 | Male | 24 | 168 | 65 | 23.0 |
Subj.10 | Male | 22 | 168 | 87 | 30.8 |
Subj.11 | Male | 23 | 166 | 53 | 19.2 |
Subj.12 | Male | 24 | 166 | 54 | 19.6 |
2.3. Transducer installation
Transducer should be located so as to indicate the vibration at the interface between the human body and the source of its vibration. Therefore, in the standing experiments, we installed the transducer on the contact area between the foot and the vibration platform.
2.4. The experiment description
Before the experiment begins, we told the subjects that he would be stimulated by a random vibration, but in fact, we had set the vibration stimulus according to the certain procedures. The reason for this was to minimize the subjective judgment of the subjects, and to ensure that their response to the vibration stimulus was objective and true. When we gave the vibration stimulus, they needed to tell us whether they could feel it or not, and then we would adjust the vibration stimulus according to the procedures.
We adopted a cyclic down-up-down-up approach to carry out the whole-body vibration experiments. First of all, we gave the subjects a stimulus level of 0.1 m/s2, which was distinctly discernable to all of the subjects. Then we descended the level of stimulation with an equal acceleration value, but the subjects were not told. Subjects need to tell us whether they could feel it or not about every vibration stimulus. We continued to descend the stimulus level until the subjects could not feel the vibration, then we ascended the stimulus to the last level. Subsequently we descended the stimulus level with a smaller equal acceleration value. Repeated the above steps until we got the subjects’ perception threshold.
We used the sine stimulus signal in the vertical direction to carry out the whole-body vibration experiments. Through the method of swept frequency, we got the resonance frequency of the vibration platform was 16 Hz in the vertical direction, so we avoided this frequency in the experiments. The frequencies included 12.5, 20, 25, 31.5, 40, 50, 63, and 80 Hz. Every subject needed to complete the vibration stimulation test at all the above frequencies. Besides, taking into account the reliability and repeatability of the data, each subject was tested on two different dates.
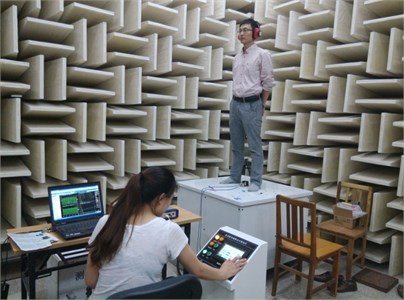
Strong noise could affect the vibration perception of the subjects, so the experiments were carried out under background noise of 39 dB(A) [4]. The subjects needed to take off the shoes, stand still and relax. The experimental photo is shown in Fig. 2.
Fig. 2The vibration experiment
2.5. The results
As briefly described in the experiment description, the vertical tests were conducted using the cyclic down-up-down-up approach covering a range of 12.5 to 80 Hz in 1/3 octave. Twelve test subjects were employed, 6 male and 6 female, ranging in age from approximately 22 to 28, with all of them having a healthy body. The stimulus was sinusoid of one minute duration. Table 3 shows the perception thresholds of different subjects on two different dates.
The test results show that perception thresholds of the whole-body vibration distribution in the range of 0.005-0.05 m/s2. The perception thresholds have some difference between the subjects. Also, the perception thresholds of each subject are varied at different test time. We calculate the average of twice perception thresholds test for each subject and draw the curve distribution.
The ISO2631-1 standard states that persons can detect a weighted vibration with a peak magnitude of 0.015 m/s2, therefore, the root-mean-square value is 0.010 m/s2. Combining the weighted factors specified in the standard, we can calculate the linear result of perception thresholds in different frequencies. They are shown in Table 4.
Table 3Perception thresholds of the subjects
Name | Acceleration, root-mean-square value () | |||||||
12.5 Hz | 20 Hz | 25 Hz | 31.5 Hz | 40 Hz | 50 Hz | 63 Hz | 80 Hz | |
Subj. 1 | 0.053 | 0.020 | 0.017 | 0.033 | 0.041 | 0.038 | 0.016 | 0.014 |
0.012 | 0.011 | 0.007 | 0.009 | 0.009 | 0.011 | 0.013 | 0.012 | |
Subj. 2 | 0.020 | 0.030 | 0.030 | 0.022 | 0.037 | 0.028 | 0.042 | 0.033 |
0.024 | 0.038 | 0.044 | 0.030 | 0.025 | 0.035 | 0.036 | 0.037 | |
Subj. 3 | 0.017 | 0.017 | 0.014 | 0.012 | 0.010 | 0.022 | 0.031 | 0.028 |
0.012 | 0.015 | 0.016 | 0.012 | 0.010 | 0.019 | 0.020 | 0.017 | |
Subj. 4 | 0.011 | 0.018 | 0.015 | 0.013 | 0.008 | 0.016 | 0.013 | 0.018 |
0.007 | 0.017 | 0.013 | 0.014 | 0.006 | 0.012 | 0.013 | 0.013 | |
Subj. 5 | 0.019 | 0.017 | 0.016 | 0.016 | 0.009 | 0.022 | 0.022 | 0.031 |
0.023 | 0.020 | 0.015 | 0.012 | 0.009 | 0.017 | 0.015 | 0.017 | |
Subj. 6 | 0.016 | 0.018 | 0.017 | 0.015 | 0.009 | 0.019 | 0.026 | 0.008 |
0.013 | 0.012 | 0.010 | 0.008 | 0.010 | 0.016 | 0.019 | 0.007 | |
Subj. 7 | 0.007 | 0.001 | 0.008 | 0.013 | 0.007 | 0.011 | 0.009 | 0.024 |
0.007 | 0.015 | 0.007 | 0.010 | 0.005 | 0.010 | 0.020 | 0.011 | |
Subj. 8 | 0.017 | 0.029 | 0.024 | 0.017 | 0.019 | 0.036 | 0.022 | 0.035 |
0.023 | 0.035 | 0.022 | 0.029 | 0.018 | 0.039 | 0.041 | 0.029 | |
Subj. 9 | 0.018 | 0.040 | 0.036 | 0.035 | 0.012 | 0.039 | 0.031 | 0.024 |
0.013 | 0.027 | 0.020 | 0.022 | 0.017 | 0.029 | 0.030 | 0.018 | |
Subj. 10 | 0.018 | 0.028 | 0.029 | 0.028 | 0.014 | 0.021 | 0.016 | 0.020 |
0.017 | 0.030 | 0.019 | 0.012 | 0.009 | 0.018 | 0.018 | 0.012 | |
Subj. 11 | 0.018 | 0.025 | 0.019 | 0.016 | 0.008 | 0.016 | 0.016 | 0.016 |
0.014 | 0.020 | 0.020 | 0.021 | 0.011 | 0.025 | 0.023 | 0.018 | |
Subj. 12 | 0.017 | 0.018 | 0.025 | 0.028 | 0.015 | 0.021 | 0.028 | 0.034 |
0.010 | 0.012 | 0.012 | 0.013 | 0.016 | 0.020 | 0.022 | 0.019 | |
Table 4Perception thresholds of ISO 2631-1
12.5 Hz | 20 Hz | 25 Hz | 31.5 Hz | 40 Hz | 50 Hz | 63 Hz | 80 Hz | |
Weighted value | 0.010 | 0.010 | 0.010 | 0.010 | 0.010 | 0.010 | 0.010 | 0.010 |
Weighted factors | 0.902 | 0.636 | 0.513 | 0.405 | 0.314 | 0.246 | 0.186 | 0.132 |
Linear value | 0.011 | 0.016 | 0.019 | 0.025 | 0.032 | 0.041 | 0.054 | 0.076 |
Fig. 3The distribution of perception thresholds
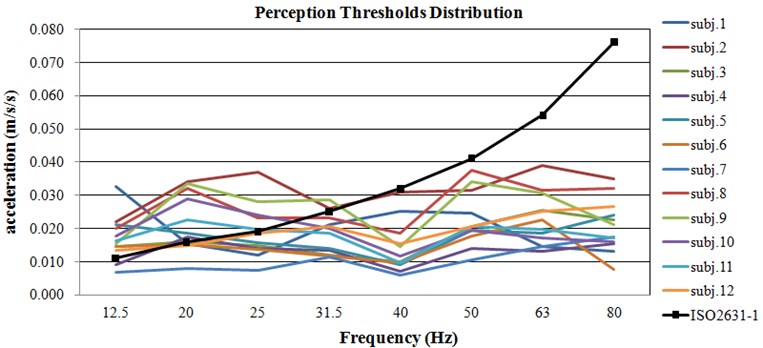
Fig. 4Comparison of results between experiment and ISO 2631-1
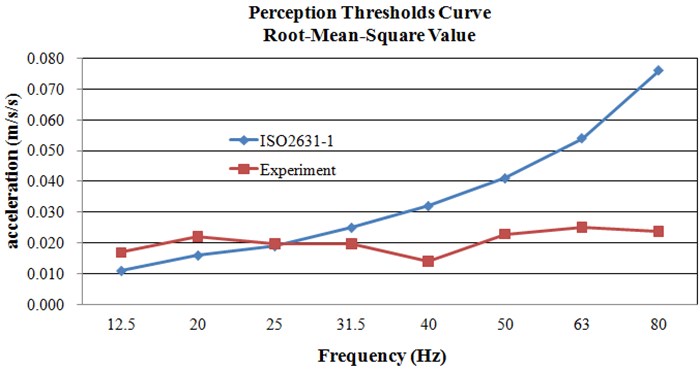
Fig. 3 shows the distribution law of perception thresholds in different frequencies about different subjects. Fig. 4 shows the comparison between the experiment results and the standard about the perception thresholds of whole-body vibration.
The results show that:
1) Comparison of the curve of perception thresholds, a range of 12.5 to 80 Hz, the experimental curve of perception thresholds is flat, the thresholds do not change obviously with the change of frequency, but the thresholds of ISO 2631-1 increase with the change of frequency.
2) Below of 25 Hz, the subjects’ perception thresholds exceed the limits given in the ISO2631-1, and above of 25 Hz, the subjects’ perception thresholds significantly below the boundaries of ISO 2631-1 standard.
3) Regulation of ISO 2631-1, overestimate the influence of vibration at low frequency and underestimate the effect of high frequency vibration on the human body.
4) The trend of 13 subjects’ perception thresholds curve is basically identical with the change of frequency.
5) The vertical vibration perception thresholds have no significant relationship with the gender and BMI (age and separate height or weight need to further study).
3. Conclusions
We adopt a cyclic down-up-down-up approach to carry out the experiments of whole-body vibration. Through the experiments, comparing the provisions of ISO 2631-1, we get some different conclusions about the distribution law of perception thresholds. A range of 12.5 to 80 Hz, the experimental curve of perception thresholds is flat, the thresholds do not change obviously with the change of frequency, but the thresholds of ISO 2631-1 increase with the change of frequency. Below of 25 Hz, the subjects’ perception thresholds higher than the provisions of ISO2631-1, and above of 25 Hz, the subjects’ perception thresholds significantly below the level of ISO 2631-1, so the defined perception thresholds of ISO 2631-1, overestimate the influence of vibration at low frequency and underestimate the effect of high frequency vibration on the human body.
References
-
Basri Bazil, Griffin Michael J. Thresholds for the perception of vibration of the back: effect of backrest inclination. The 44th UK Conference on Human Responses to Vibration, Loughborough, GB, 2009, p. 65-76.
-
Kowalski Piotr, Zając Jacek Research on simultaneous impact of hand-arm and whole-body vibration. International Journal of Occupational Safety and Ergonomics, Vol. 18, Issue 1, 2012, p. 59-66.
-
Mechanical Vibration and Shock-Evaluation of Human Exposure to Whole-Body Vibration-Part 1: General Requirements [s]. ISO 2631-1, 1997.
-
Sato Tetsumi, Maeda Setsuo, Yano Takashi Effects of noise exposure on whole-body vibration perception threshold. Journal of South China University of Technology, Vol. 18, 2007, p. 108-110.
About this article

This paper is supported by youth science and technology backbone topic of Beijing Academy of Science and Technology, and Beijing Municipal Natural Science Foundation (L150007).
