Abstract
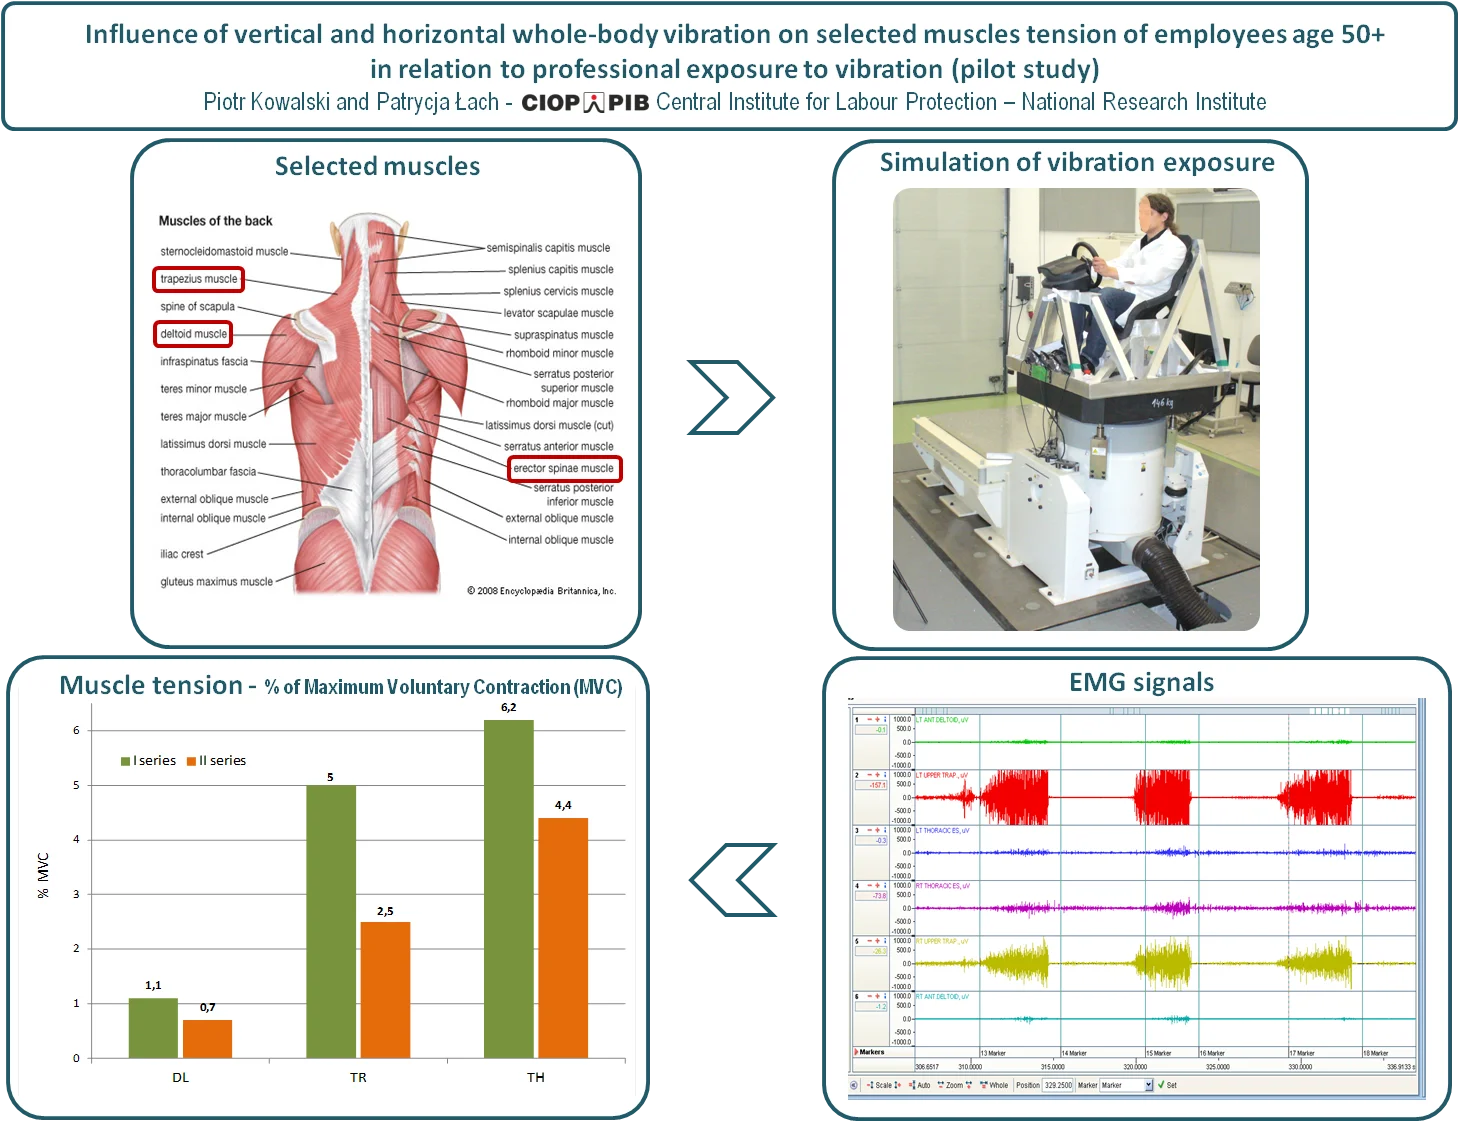
The pilot study on changes of selected muscles tension caused by vertical and horizontal whole-body vibration focused on employees belonging to two professional (occupational) groups. One of these groups consisted of men aged 50 years professionally exposed to vibration and the second were men not exposed to vibration at the workplace. Tests have been conducted in two series on special designed laboratory test bench for simulation of exposure to whole-body vibration. During the I series of tests, vertical vibration had acted on subjects and during II series horizontal lateral vibration had acted. The EMG signals were registered from muscles of the shoulder girdle and lower back, both sites of the body. Muscles tension values obtained during I and II series indicates that there are no statistical significant differences between reaction of subjects on vertical and horizontal vibration. However slightly lower EMG RMS values during II series were noticed. Exposure to whole-body vibration may cause changes in muscle tension both in employees (aged 50 years and older) occupationally exposed to vibration and not exposed to vibration. The observed changes vary in both groups of subjects. In occupationally exposed to vibration subjects the impact of exposure to vibration on muscle tension is less than in reference group.
Highlights
- Comparison of muscle tension: deltoid - clavicular part, trapezius - cervical part and erector spinae under whole-body vibration exposure conditions.
- Tension of selected muscles depending on the exposure to vertical and horizontal whole-body vibration.
- Tension of selected muscles in conditions of vibration exposure for people aged 50+ professionally exposed to whole-body vibration and people not exposed.
1. Introduction
Occupational exposure to whole-body vibration affects 4-8 % of workers in industrialised European countries [1] and more than four million workers in the USA. The highest percentage of workers being regularly exposed to vibration is reported in such sectors as: construction, forestry and fishing, transport and storage and industry. Operators of heavy machines such as operating bulldozers, motor graders, backhoes, cranes and other construction vehicles are particularly exposed to musculoskeletal disorders. Among operators of construction equipment, transportation and the railroad industry the most common are back injuries 36 %, followed by body parts such as shoulder 12 %, knee 12 % and ankle 9 % [2, 3] and in the more than half of whole population, back problems are reported [4].
Numerous studies show that [5-7] along with biomechanical load [8] and psychosocial factors [9] are external factors contributing significantly to the development of musculoskeletal disorders. Whole-body vibration with additional awkward posture increase the risk of low back pain even four times compared with the sitting posture only [1]. It is therefore important to correctly identify hazards caused by external factors. Muscular activity caused mechanical vibrations can lead to muscle fatigue [11]. On the basis of studies of people exposed to vibration (1-100 Hz), it was found that the lack of a feeling of fatigue (LFF low-frequency fatigue) in terms of exposure to low-frequency vibrations can cause excessive load and increase the risk of progression musculoskeletal disorders [12-14]. In some countries (Germany, Belgium, Denmark, France, Italy and the Netherlands) the low back pain syndrome – the result of exposure to vibrations is an occupational disease. The appearance of musculoskeletal disorders can lead to a reduction of capacity to work and increasing the likelihood of an accident (especially in road transport); it can also cause permanent lesions. The influence of mechanical vibrations acting continuously on musculoskeletal system of exposed workers is still in the focus of research [1, 15, 16].
In view of lengthening the time of professional activity, the mentioned issues are particularly relevant in relation to employees aged 50 years and older. Performed in CIOP-PIB study are related to prevention of negative phenomena accompanying exposure to vibration. The study is carried out on a specially developed test bench to simulate low-frequency whole-body vibrations considered most dangerous to the health of workers.
2. Aim of the study
The aim of this pilot studies was to recognize differences between influences of horizontal (lateral) and vertical whole-body vibration on selected muscles tension of employees age 50+ in relation to their professional exposure to vibration. Presented study is a part of larger project on the impact of vibrations on the employee at this age.
3. Methodology
Objective, scope and methodology of the study have been presented to the Commission of ethics and bioethics, Cardinal Stefan Wyszyński University in Warsaw, which issued a favorable opinion (No. KEIB-14/2015) that represents the approval for their implementation.
All research carried out comply with the requirements of standard PN-EN ISO 13090-1:2002 [17]. Tests were conducted in laboratory at ambient temperature in the range of 22.1 °C to 23.1 °C and relative humidity in the range of 22 % to 57 %.
The study consisted of the subjects’ muscle tension determination on the basis of EMG signals in two measurement series. I series involved tests related to vertical whole-body vibration exposure and II series to horizontal (lateral) whole-body vibration exposure.
The tension tests related to the following muscles:
• deltoid – clavicular part (Deltoideus pars Clavicularis, DL),
• trapezius – cervical part (Trapezius pars Descendents, TR),
• erector spinae (Erector Spinae, TH).
The left and right sides of the body were included by placing electrodes symmetrically (Fig. 1).
Fig. 1The measuring electrode placement on selected muscles of the shoulder girdle and back
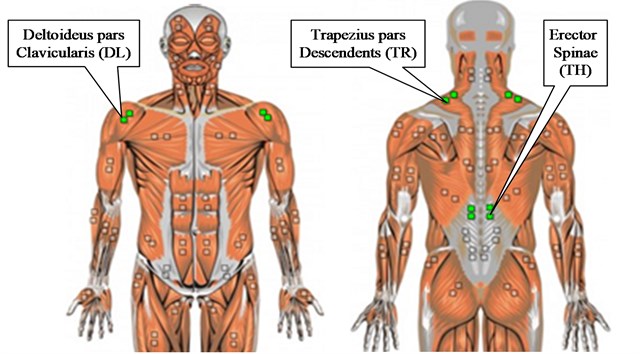
According to the recommendations of the European research programme SENIAM (Surface ElectroMyoGraphy for the NonInvasive Assessment of Muscles), [18, 19], the electrodes for recording the EMG signal of muscles selected for the study were placed on the skin in the following places:
• for Erector Spinae - in the central part of the medial band brzuśca, in the lumbar segment,
• for deltoid (Deltoideus pars Clavicularis) – in 1/2 of the muscle length between the clavicle and the deltoid protuberance of the humerus,
• for trapezius (Trapezius pars descendents) – in the middle of the line linking the outgrowth of the shoulder blades and circle C7 of vertebral column.
The electrodes were stuck to the skin which was previously greased using alcohol and cleaned from hair and scurf.
Before proceeding to the recording of the EMG signal, maximum voluntary contraction (MVC) of the each selected muscle was measured. Recorded maximum values of MVC were used to normalize the EMG signal measured during the tests. For each type of muscle specially selected test activates muscle was performed.
In both test series, the same group of examined persons was subjected to testing. They were subjected to exposure to vibration, in a sitting position two times (one day exposure to vertical vibration and horizontal vibration another day). For each subject break between series I and II of studies was at least 2 weeks. Vibration test signal was filtered white noise with frequency range: 1 Hz-30 Hz controlled with the accuracy of +/–2 dB. The value of the frequency weighted vibration acceleration of the test signal was 0.9 m/s2 controlled with a precision of +/–0.05 m/s2. (In Poland it is 28 % of the limit value for short-term exposure whole-body vibrations in the working environment of 3.2 m/s2 [20]). The test signal was selected on the base of research on the whole body vibration at the work places of machine operators and various vehicle drivers conducted for over 25 years by CIOP-PIB as parts of national research programs.
A single exposure of the subject lasted 20 min. In both test series, for each subject, EMG signals were recorded before, during and right after vibration exposure.
3.1. Measurement equipment
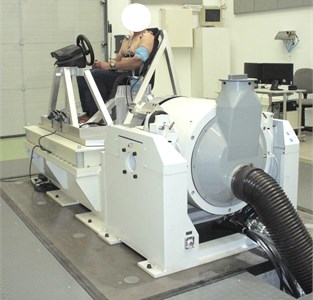
The experimental tests carried out on developed test bench [21]. The basic part of the bench was the system for generation of low-frequency vibrations. The system allowed to simulate both horizontally and vertically whole-body vibration. It was based on: shaker IMV J240 type, power amplifier IMV type SA4M J40 and control system Crystal Instruments Spider-81. The developed bench is shown in Fig. 2. It provides simulation exciting signal without disturbances in the entire range used in the research 1-30 Hz (resonance frequencies of bench elements > 120 Hz).
Fig. 2Test bench during simulation of the horizontal vibration exposure
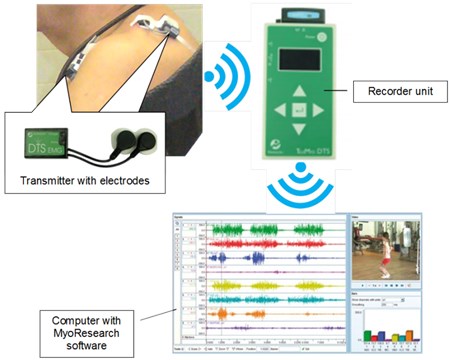
For recording EMG signals TeleMyo DTS Noraxon wireless system with software MyoResearch XP Master Edition 1.08.17. was used. Fig. 3 shows a diagram of the system. EMG signals were recorded with sampling rate 3 kHz. The raw EMG signals were amplified with a bandwidth of 10-500 Hz. The baseline noise was filtered to below 1 μV rms. The recorded raw data were processed by electrocardiography (ECG) reduction, full-wave rectification and then averaging within 200 ms to determine the RMS. To reduce the ECG signal, the EMG signals were recorded and processed using MyoResearch XP Master Edition 1.08.17.
Fig. 3Wireless EMG signal recording system
3.2. Determined parameters
For each subject, in both tests series (I and II) and each measurement six EMG signals were recorded simultaneously. The EMG records included left and right of the body, by symmetrically electrodes placing. For the signal recorded from each muscle tested, RMS (Root Mean Square) was calculated at the selected time interval. The amplitude value describes the muscle tension for a given task. The values obtained for the right and left sides were averaged.
EMG signal analysis was carried out in time domain based on: RMS value of EMG amplitude URMS, the AEMG parameter value calculated as ratio of the recorded signal to a maximum value of MVC signal (Maximum Voluntary Contraction) – percentage % of MVC.
4. Subjects
The study enrolled 20 men at the age of 50+. The target group had 10 men working at workplaces in vibration exposure for at least 10 years (earthmoving machinery operators and heavy vehicle drivers), and the reference group had 10 men working for at least the last 10 years at work places without exposure to vibration (office workers). Qualification of the subjects was carried out on the basis of the medical assessment. In accordance with the requirements of PN-EN ISO 13090-1 within the scope of the study includes the following types of qualifying tests: survey (on the state of health of the subjects), medical examination, test resting ECG. Age, mass and height of qualified subjects are shown in Table 1.
Table 1Physical characteristics of subjects
Age, year | Mass, kg | Height, cm | ||||
Reference group | Target group | Reference group | Target group | Reference group | Target group | |
Mean value | 56.4 | 52.5 | 95.9 | 91.9 | 179.2 | 177.5 |
Standard deviation | 3.8 | 2.6 | 12.5 | 10.9 | 3.3 | 5.9 |
Median | 57 | 52 | 98 | 90.5 | 179 | 178 |
5. Results
The values of muscle tension were continuously recorded for selected muscles (DL, TR, TH). Both test series (I and II) enrolled three measurements of EMG signals:
• measurement 1 – before vibration exposure,
• measurement 2 – during vibration exposure,
• measurement 3 – after vibration exposure.
In the Tables 2-5 the obtained values of selected muscle tension are shown:
• in Table 2 – the values obtained in I series (whole-body vertical vibration exposure) for the reference group,
• in Table 3 – the values obtained in I series for the target group,
• in Table 4 – the values obtained in II series of tests (whole-body horizontal vibration exposure) for the reference group,
• the Table 5 – the values obtained in II series of tests for the target group.
Table 2Muscle tension URMS values obtained in I series of tests in reference group
, µV | |||||||||
DL | TR | TH | |||||||
Measurement 1 | Measurement 2 | Measurement 3 | Measurement 1 | Measurement 2 | Measurement 3 | Measurement 1 | Measurement 2 | Measurement 3 | |
Mean value | 1.718 | 3.226 | 2.324 | 5.372 | 7.853 | 5.650 | 2.952 | 3.992 | 2.831 |
Standard deviation | 0.997 | 1.951 | 1.310 | 5.844 | 6.210 | 5.299 | 1.683 | 2.723 | 2.319 |
Median | 1.258 | 3.468 | 1.753 | 3.335 | 5.853 | 2.953 | 2.985 | 3.135 | 2.178 |
Table 3Muscle tension URMS values obtained in I series of tests in target group
, µV | |||||||||
DL | TR | TH | |||||||
Measurement 1 | Measurement 2 | Measurement 3 | Measurement 1 | Measurement 2 | Measurement 3 | Measurement 1 | Measurement 2 | Measurement 3 | |
Mean value | 1.680 | 2.697 | 1.690 | 2.128 | 3.203 | 2.476 | 3.205 | 3.905 | 2.375 |
Standard deviation | 0.963 | 1.982 | 0.857 | 0.851 | 1.702 | 0.879 | 1.659 | 2.282 | 0.851 |
Median | 1.353 | 2.310 | 1.598 | 2.143 | 2.890 | 2.250 | 2.510 | 3.130 | 2.473 |
Table 4Muscle tension URMS values obtained in II series of tests in reference group
, µV | |||||||||
DL | TR | TH | |||||||
Measurement 1 | Measurement 2 | Measurement 3 | Measurement 1 | Measurement 2 | Measurement 3 | Measurement 1 | Measurement 2 | Measurement 3 | |
Mean value | 1.299 | 2.054 | 1.378 | 4.518 | 5.065 | 4.047 | 2.349 | 4.043 | 2.041 |
Standard deviation | 0.467 | 0.831 | 0.404 | 2.894 | 3.372 | 2.782 | 1.094 | 2.303 | 0.800 |
Median | 1.398 | 1.970 | 1.460 | 4.453 | 4.625 | 3.553 | 2.278 | 4.163 | 2.020 |
Table 5Muscle tension URMS values obtained in II series of tests in target group
, µV | |||||||||
DL | TR | TH | |||||||
Measurement 1 | Measurement 2 | Measurement 3 | Measurement 1 | Measurement 2 | Measurement 3 | Measurement 1 | Measurement 2 | Measurement 3 | |
Mean value | 1.984 | 2.765 | 1.733 | 3.089 | 3.296 | 3.092 | 3.556 | 5.027 | 2.362 |
Standard deviation | 1.378 | 1.578 | 0.465 | 1.792 | 1.620 | 2.279 | 1.705 | 1.757 | 1.073 |
Median | 1.675 | 2.555 | 1.675 | 2.248 | 2.685 | 2.053 | 2.965 | 5.115 | 2.470 |
6. Discussion
The results of the research indicate that the EMG signal parameters can be used to determine the effect of vertical and horizontal whole-body vibration on the muscle tension. The RMS amplitude of EMG is useful quantity to observe changes in the EMG signal caused by vibration. It is used for the examination of muscular reactions as the conventional non-invasive method [22-25] when direct measurement of the muscle forces is impossible as well as for muscle activity and fatigue detection [26]. Some study [27, 28] show, that RMS values increasing is expected during vibration exposure.
In present study the values of muscle (DL, TR and TH) tension URMS obtained during exposure (measurement 2) and after exposure to vibration (measurement 3) were compared with the values obtained before exposure to vibration (measurement 1).
The proportions of the URMS determined in this way, for I tests series (whole-body vertical vibration exposure) are presented in Fig. 4 and for II tests series (whole-body horizontal vibration exposure) in Fig. 5. (In Figs. 4 and 5 URMS values complement the values: URMS – standard deviation and URMS + standard deviation).
Fig. 4Proportions of the (URMS,measurement 2) / (URMS, measurement 1) and (URMS, measurement 3) / (URMS, measurement 1), for I tests series (whole-body vertical vibration exposure)
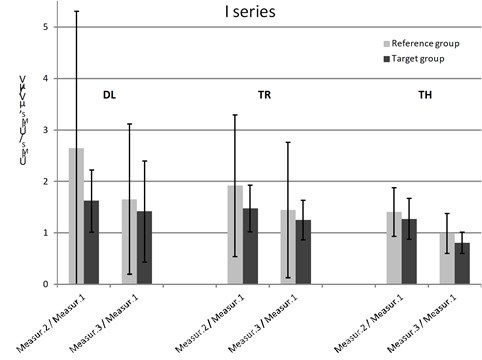
Fig. 5Proportions of the (URMS,measurement 2) / (URMS, measurement 1) and (URMS, measurement 3) / (URMS, measurement 1), for II tests series (whole-body horizontal vibration exposure)
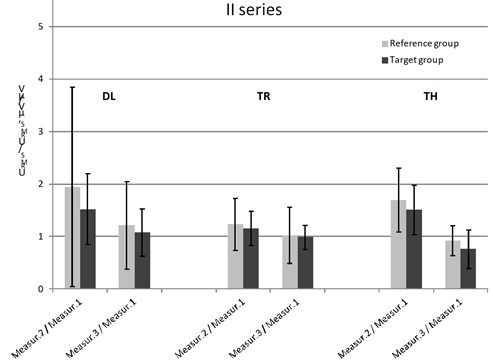
By analyzing the submitted comparison, it can be observed that in both test series, and in both groups of subjects during exposure to vibration, recorded signal amplitudes of muscle tension all muscles were higher than before exposure. Muscle tension decreased after exposure to vibration reaching, however, in some cases larger values than before exposure to vibration.
By comparing the obtained values in target group and reference group, it can be concluded that in all cases (i.e. in both series of testing and for all muscle) muscle tension changes were significantly higher in the reference group than in the target group.
This may mean that in people exposed professionally on the vibration impact of exposure to vibration on muscle tension is less than in other people, what also Balasumbramanian [29] has observed. In his study, in professional drivers almost there have been no change in the right deltoid activity compare with non-professional drivers. The lower than in other group of people impact of exposure to vibration on muscle tension in professionally exposed could be the result of their years of experience and training.
Despite the fact that whole-body vibration is in most cases noxious factor some studies show its beneficial effects. The review of Madou and Cronin [30] confirm beneficial effects on balance, stability and gait, strength and physical and physiological properties of whole-body vibration exercise as compared with conventional resistance training and physiotherapy.
Lenhard et al. [31] compared lower limb muscle activity during whole-body vibration exercise between a young (20+) and an older study population. The increases in EMG activity were significantly higher in the older than the younger adults for all muscles. This may mean more benefit from exercise, but on the other hand, for older workers and long-term exposure to vibration, there is a greater risk of muscle overload and consequent exposure to musculoskeletal damage.
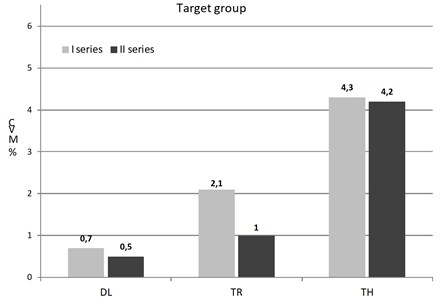
Fig. 6 shows the proportions of the amplitude value URMS obtained during exposure to vertical vibration (I series) and the values obtained during horizontal vibration exposure (II turn).
Fig. 6Comparison of the muscle tension proportions URMS values obtained during I and II test series in target group and reference group
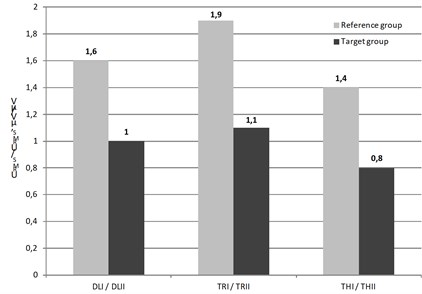
By comparing the obtained proportions, it can be concluded that muscle tension changes recorded during the I test series in the reference group series in relation to the values recorded in the II series were clear for all the muscles (> 40 %) while in the target group, these changes were minor (< 20 %) or not occurred.
This means that muscular tension of the subjects from reference group during the exposure to whole-body vertical vibration is much greater than during the exposure to whole-body horizontal vibration. In subjects from the target group this phenomenon practically not occurred, except in case of TH muscle where the opposite (but much weaker) effect was observed.
EMG signal is characterized by its amplitude which not exceeding a few mV, with maximum muscle tension in the case of young people with a high level of training, while the resting muscle tension values are at the level of microvolts. When MVC testing in both groups of subjects the values of instantaneous amplitude reached maximally approximately 2 mV and in rest conditions the amplitude oscillated at the level from a few to a dozen μv and average normalized values of amplitude was on level 2-3 % MVC. The values are comparable to the values of 1 % MVC reported by Leinonen et al. [32] for bus drivers and to the average amplitude of EMG signal between 1 % and 2 % MVC obtained during testing effect on transmission of vibration through the trunk by Kingma and Dieen [33].
In Figs. 7 and 8 EMG signal amplitudes are presented as percentages of the signal MVC obtained during maximal muscle contraction (muscle activity) in reference group and in target group of subjects.
Fig. 7Comparison of the muscle tension proportions URMS values obtained during I and II test series in reference group
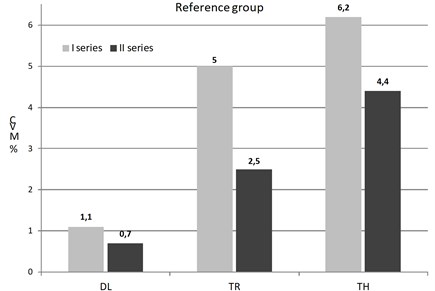
Fig. 8Comparison of the muscle tension proportions URMS values obtained during I and II test series in target group
By analyzing the activity of tested muscles registered during both tur (I and II) in both groups it can be seen that the greatest activity showed erector spinae (TH), while the smallest deltoid (DL). In the reference group has been observed greater activity of all tested muscles than in target group in both test series.
Previous research reported that the most load muscles of subjects exposed to whole-body vibration are muscles of upper limb, shoulder and back, upper and low [29]. Balasumbramanian [29] also reported that significant change in muscle activity was observed in the EMG acquired from all muscles of subjects while the performed a simulated driving activity. Jagannath et al. [34] has observed significant change in postural muscle-group such as erector spinae. In the sitting position closest to the source of vibration are the back muscles. Therefore, the highest amplitude of the signal was recorded from the back muscles, next from trapezius and the end from deltoid. Research of Xu et al. [35] confirmed that the vibration transmission generally is reduced with the increase in distance from the hand interface with the vibration source. Team of Xu et al. [35] was investigating the vibration transfer from human hands to upper arm, shoulder, back, neck and head.
Another cause of the greatest back muscles activity is the fact that the back muscle groups need to support the body to maintain its posture during driving in sitting position. The near static seated posture while driving causes high intramuscular pressure due to driver’s body weight.
This fact is confirmed by numerous studies showing that it is the back muscles that are most loaded when driving [15, 36]. Which often results in pain and discomfort of the spine among professional drivers [6].
7. Statistic analysis
Despite the fact that both groups of subjects were not large, the statistic analysis of the obtained results has been performed using software Statistica (from StatSoft).To verify the statistical significance of observed dependencies, impact of two types of exposure to vibration on the tested person and an assessment of the response of muscle to exposure to vibration depending on the test group were analysed. Testing of the similarity of the distribution of the used variables to normal distribution has been carried out using the test of Shapiro-Wilk. The test ruled out the existence of a similarity of distributions of variables to the normal distribution. Therefore, to compare the differences in target and reference groups, the test for independent groups of U Mann-Whitney was used. The assumption of the existence of differences in the EMG signal parameters recorded in target and reference groups was tested. Table 6 contains the results of the test.
Table 6Results of U Mann-Whitney test
Parameter | Series I | Series II | ||
(0.05) | (0.05) | |||
URMS Measurement 1_DL | –0.22686 | 0.82053 | 1.39952 | 0.161658 |
URMS Measurement 2_DL | –0.71813 | 0.472676 | 0.56716 | 0.570606 |
URMS Measurement 3_DL | –0.79373 | 0.427356 | 1.81765 | 0.069119 |
URMS Measurement 1_TR | –1.85203 | 0.064023 | –1.17257 | 0.240968 |
URMS Measurement 2_TR | –2.00321 | 0.045155 | –1.32387 | 0.185547 |
URMS Measurement 3_TR | –1.47406 | 0.140466 | –1.39847 | 0.161973 |
URMS Measurement 1_TH | 0.34017 | 0.73373 | 1.62586 | 0.103981 |
URMS Measurement 2_TH | 0.0378 | 0.96985 | 1.17213 | 0.241145 |
URMS Measurement 3_TH | 0.18898 | 0.850107 | 0.71867 | 0.472343 |
Statistical analysis did not demonstrate the existence of statistically significant differences between the EMG signal parameter values obtained in the reference and the target groups. The muscles of the subjects responded in a similar way to both types of exposure to vibration. Only the values obtained for the TR muscle can differentiate both examined groups.
For comparison of the impact of the type of vibration on the tested group Wilcoxon test was used. The test results for the target and the reference group of are presented in Table 7.
Table 7Results of Wilcoxon test
Parameter | Target group | Reference Group | ||
URMS Measurement 1_DL_I ↔ URMS Measurement 1_DL_II | 0.86640 | 0.38627 | 0.8664 | 0.38627 |
URMS Measurement 2_DL_I ↔ URMS Measurement 2_DL_II | 0.25482 | 0.79886 | 2.08955 | 0.03666 |
URMS Measurement 3_DL_I ↔ URMS Measurement 3_DL_II | 0.05096 | 0.95935 | 1.88569 | 0.05934 |
URMS Measurement 1_TR_I ↔ URMS Measurement 1_TR_II | 1.07026 | 0.28450 | 0.35675 | 0.72128 |
URMS Measurement 2_TR_I ↔ URMS Measurement 2_TR_II | 0.05096 | 0.95935 | 1.57991 | 0.11413 |
URMS Measurement 3_TR_I ↔ URMS Measurement 3_TR_II | 0.15289 | 0.87848 | 1.17219 | 0.24112 |
URMS Measurement 1_TH_I ↔ URMS Measurement 1_TH_II | 0.56061 | 0.57506 | 1.07026 | 0.28450 |
URMS Measurement 2_TH_I ↔ URMS Measurement 2_TH_II | 1.78376 | 0.07446 | 0.56061 | 0.57506 |
URMS Measurement 3_TH_I ↔ URMS Measurement 3_TH_II | 0.86640 | 0.38627 | 0.76447 | 0.44459 |
By testing the assumption of the existence of differences between the EMG signal parameters recorded during the I and II test series similar results were received. Wilcoxon tests showed no statistically significant differences. Only stronger response of DL muscle during exposure to vertical vibrations than during exposure to horizontal vibration in the reference group was confirmed.
Although the statistical tests have not confirmed the observed dependences, the obtained results of the pilot studies of muscle tension shows the existence of their relations with exposure to the whole-body vibrations, which should be verified in a larger test group.
8. Conclusions
The results of research show that, EMG can be used in order to analyze the muscular reactions during vibration exposure. After the analysis of the results of research on the impact of exposure to whole-body vibration on muscle tension, it was found that:
1) in both groups of subjects (aged 50 +) muscular reaction occurs under the influence of exposure to vibration (vertical and horizontal),
2) in occupationally exposed to vibration subjects (target group) the impact of exposure to vibration on muscle tension is less than in other people,
3) when in subjects from the reference group muscular tension was greater during the exposure to the whole-body vertical vibrations than during the exposure on the whole-body horizontal vibrations, in the target group this phenomenon was not observed,
4) during exposure to both types of vibration in both subject groups the greatest activity showed muscle erector spinae (TH),
5) in the reference group has been observed greater activity of all tested muscle than in target group in both series of testing (i.e. during exposure to vertical and horizontal whole-body vibrations),
6) probably due to small strength of the subject groups, statistical tests have not confirmed the observed dependencies.
The obtained research results show that exposure to whole-body vibration may cause changes in muscle tension both in employees (aged 50 years and older) occupationally exposed to vibration and not exposed to vibration. The observed phenomena and relationships should be verified on a large population of employees. The understanding of these mechanisms would enable a better prediction of muscle reactions on whole-body vibration during work activity.
References
-
Kuijer P. P. F. M., Van Der Molen H. F., Schop A., Moeijes F., Frings Dresen M.-H.-W., Hulshof C. T. J. Annual incidence of non-specific low back pain as an occupational disease attributed to whole-body vibration according to the national Dutch register 2005-2012. Ergonomics, Vol. 58, Issue 7, 2015, p. 1232-1238.
-
Kittusamy N. K., Buchholz B. Whole-body vibration and postural stress among operators of construction equipment: a literature review. The Journal of Safety Research, Vol. 35, Issue 3, 2004, p. 255-261.
-
Tak S., Calvert G. M. The estimated national burden of physical ergonomic hazards among US workers. American Journal of Industrial Medicine, Vol. 54, Issue 5, 2011, p. 395-404.
-
Widanarko B., Legg S., Stevenson M., Devereux J., Eng A., Mannetje A., Cheng S., Douwes J., Ellison Loschmann L., Mclean D., Pearce N. Prevalence of musculoskeletal symptoms in relation to gender, age, and occupational/industrial group. International Journal of Industrial Ergonomics, Vol. 41, 2011, p. 561-572.
-
Village J., Trask C., Chow Y., Morrison J. B., Koehoorn M., Tschke K. Assessing whole body vibration exposure for use in epidemiological studies of back injuries: measurements, observation and self-reports. Ergonomics, Vol. 55, Issue 4, 2012, p. 415-424.
-
Johanning E. Whole-body vibration-related health disorders in occupational medicine – an international comparison. Ergonomics, Vol. 58, Issue 7, 2015, p. 1239-1252.
-
Bovenzi M., Schust M., Menzel G., Hofmann J., Hinz B. A cohort study of sciatic pain and measures of internal spinal load in professional drivers. Ergonomics, Vol. 58, Issue 7, 2015, p. 1088-1102.
-
Punnett L., Pruss Ustun A., Nelson D. I., Fingerhut M. A., Leigh J., Tak S. W., Phillips S. Estimating the global burden of low back pain attributable to combined occupational exposures. American Journal of Industrial Medicine, Vol. 48, 2005, p. 458-469.
-
Smith D. R., Mihashi M., Adachi Y., Koga H., Ishitake T. A detailed analysis of musculoskeletal disorder risk factors among Japanese nurses. Journal of Safety Research, Vol. 37, Issue 2, 2006, p. 195-200.
-
Lis A. M., Black K. M., Korn M., Nordin M. Association between sitting and occupational LBP. European Spine Journal, Vol. 16, 2007, p. 283-298.
-
Martin B. J., Park H. S. Analysis of the tonic vibration reflex: influence of vibration variables on motor unit synchronization and fatigue. European Journal of Applied Physiology, Vol. 75, Issue 6, 1997, p. 504-511.
-
Dundon J. M., Cirillo J., Semmler J. G. Low-frequency fatigue and neuromuscular performance after exercise-induced damage to elbow flexor muscles. Journal of Applied Physiology, Vol. 150, Issue 4, 2008, p. 1146-1155.
-
Keaton R. B., Binder Macleod S.-A. Low frequency fatigue. Physical Therapy, Vol. 86, Issue 8, 2006, p. 1146-1150.
-
Adamo D. E., Martin B. J., Peter W., Johnson P. W. Vibration-induced muscle fatigue, a possible contribution to musculoskeletal injury. European Journal of Applied Physiology, Vol. 88, 2002, p. 134-140.
-
Zimmermann C. L., Cook T. M., Goel V. K. Effects of seated posture on erector spine EMG activity during whole body vibration. Ergonomics, Vol. 36, Issue 6, 1993, p. 667-675.
-
Tiemessen J. H., Hulshof C. T. J., Frings Dresen M.-H.-W. Low back pain in drivers exposed to whole body vibration: analysis of a dose-response pattern. Occupational and Environmental Medicine, Vol. 65, 2008, p. 667-675.
-
PN-EN ISO 13090-1:2002 Mechanical Vibration and Shock – Guidelines for Safety Tests and Experiments Involving Humans – Part 1: Exposure to Whole-Body Mechanical Vibration and Repeated Shocks, 2002.
-
Hermens H. J., Freriks B., Disselhorst Klug C., Rau G. Development of recommendations for SEMG sensors and sensor placement procedures. Journal of Electromyography and Kinesiology, Vol. 10, Issue 5, 2000, p. 361-374.
-
Perotto A. O. Anatomic Guide for the Electromyographer – the Limbs and Trunk. 4th ed., Charles C Thomas, Sprigfield, 2005.
-
Regulation of the Minister of Labour and Social Policy in Poland dated June 6, 2014, on Maximum Concentrations and Intensities of Factors Harmful to Health in the Working Environment, 2014.
-
Kowalski P., Zając J. Test bench for the simulation of low frequency whole-body vibration. Proceedings of the 22nd International Congress on Sound and Vibration, Florence, Italy, 2015.
-
De Luca C. J. The use of surface electromyography in biomechanics. Journal of Applied Biomechanics, Vol. 13, 1997, p. 135-163.
-
Bosch T., Mathiassen S. E., Visser B., Looze M. P. The effect of work pace on workload, motor variability and fatigue during simulated light assembly work. Ergonomics, Vol. 54, Issue 2, 2011, p. 154-168.
-
Barandun M., Von Tscharner V., Meuli Simmen C., Bowen V., Valderrabano V. Frequency and conduction velocity analysis of the abductor pollicis brevis muscle during early fatigue. Journal of Electromyography and Kinesiology, Vol. 19, Issue 1, 2009, p. 65-74.
-
Cifrek M., Medved V., Tonkovic S., Ostojic S. Surface EMG based muscle fatigue evaluation in biomechanics. Clinical Biomechanics, Vol. 24, 2009, p. 327-340.
-
Petrofsky J. S. Frequency and amplitude analysis of the EMG during exercise on the bicycle ergometer. European Journal of Applied Physiology and Occupational Physiology, Vol. 41, 1979, p. 1-15.
-
Bosco C., Cardinale M., Tsarpela O. Influence of vibration on mechanical power and electromyogram activity in human arm flexor muscles. European Journal of Applied Physiology and Occupational Physiology, Vol. 79, Issue 4, 1999, p. 306-311.
-
Wakeling J. M., Liphardt A. Task-specific recruitment of motor units for vibration damping. Journal of Biomechanics, Vol. 39, Issue 7, 2006, p. 1342-1346.
-
Balasubramanian V., Adalarasu K. EMG-based analysis of change in muscle activity during simulated driving. Journal of Bodywork and Movement Therapies, Vol. 11, 2007, p. 151-158.
-
Madou K. H., Cronin J. B. The effects of whole body vibration on physical and physiological capability in special populations. Hong Kong Physiotherapy Journal, Vol. 26, 2008, p. 24-38.
-
Lienhard K., Vienneau J., Nigg S., Friesenbichler B. Older adults show higher increases in lowe-limb muscle activity during whole-body vibration exercise. Journal of Biomechanics, Vol. 52, 2017, p. 55-60.
-
Leinonen V. Back and neck extensor loading and back pain provocation in urban bus drivers with and without low back pain. Pathophysiology, Vol. 12, 2005, p. 249-255.
-
Kingma I., Van Dieen J. H. Car driving with and without a movable back support: Effect on transmission of vibration through the trunk and on its consequences for muscle activation and spinal shrinkage. Ergonomics Ergonomics, Vol. 52, Issue 7, 2009, p. 830-839.
-
Jagannaath M., Balasubramanian V. Assessment of early onset of driver fatigue using multimodal fatigue measures in a static simulator. Applied Ergonomics, Vol. 45, 2014, p. 1140-1147.
-
Xu X. S., Dong R. G., Welcome D. E., Warren C., Mcdowell T. W., Wu J. Z. Vibration transmitted from human hands to upper arm, shoulder, back, neck, and head. International Journal of Industrial Ergonomics, Vol. 62, 2016, p. 1-12.
-
Schust M., Menzel G., Hofmann J., Forta N. G., Pinto I., Hinz B., Bovenzi M. Measures of internal lumbar load in professional drivers – the use whole-body finite-element model for the evaluation of adverse health effects of multi-axis vibration. Ergonomics, Vol. 58, Issue 7, 2015, p. 1191-1206.
About this article

This paper was based on the results of a research task carried out within the scope of the third stage of the National Programme “Improvement of safety and working conditions” partly supported — within the scope of research and development — by the Ministry of Science and Higher Education/National Centre for Research and Development. The Central Institute for Labour Protection – National Research Institute is the Programme’s main co-ordinator
