Abstract
This paper presents the pilot study on influence of vertical and horizontal vibration on some psychomotor and cognitive functions of employees at the age of 50+. Tests have been conducted in two series on special designed laboratory test bench for simulation of exposure to whole-body vibration. During the I series of tests, vertical vibration had acted on subjects and during II series horizontal lateral vibration had acted. Complex reaction time values obtained during I and II series indicates that there are no statistical significant differences between reaction of subjects on vertical and horizontal vibration. However slightly lower values during II series were noticed. Similar observations regarded results of cognitive function (attention and perceptiveness) tests.
1. Introduction
Phenomena associated with the impact of whole-body vibration on psychomotor functions are important from safety and health point of view and still require research and analysis. Studies based on psychological tests have shown so far that exposure to vibration can cause sleepiness, worsening fatigue or susceptibility to collapse into a nap [1, 2]. Also, psychological stress reactions [3] as well as the deterioration of motor function [4] related to the general feeling of discomfort, headaches, abdominal pain, chest pain, muscle cramps were reported.
Reaction time is a characteristic of an individual, and it depends on nervous stimulation, sex, age, physiological status, interest, etc. Currently the test of reaction time is important in the selection of candidates for certain professions and positions that require quick reaction, attention span and to work related to system operation [5, 6].
The concept of attention refers to the selective aspect of perception, which is manifested in seeing and focus on some of the environment characteristics and relative leaving other characteristics [7, 8]. This ability can be manifested also the ability to focus the mind on a specific issue or on several problems at the same time for an extended period of time. Analysis of the role of the characteristics of the individual human being in terms of efficiency of the sensorimotor, personality traits, abilities, and interests in a safety implementation of difficult and dangerous professions showed that in the category concentration capacity attention takes 2nd place among 10 other abilities [9].
2. Aim of the study
The aim of this pilot studies was to recognize differences between influences of horizontal (lateral) and vertical whole-body vibration on some psychomotor and cognitive functions of employees. In view of lengthening the time of professional activity, it was considered that the interest will be the results of studies in people at the age of 50+. Presented study is part of larger project on the impact of vibrations on the employee at this age.
3. Methodology
Objective, scope and methodology of the study have been presented to the Commission of ethics and bioethics, Cardinal Stefan Wyszyński University in Warsaw, which issued a favorable opinion (No. KEIB-14/2015) that represents the approval for their implementation.
All research carried out comply with the requirements of standard PN-EN ISO 13090-1:2002 [10]. Tests were conducted in laboratory at ambient temperature in the range from 22,1 °C to 23,1 °C and relative humidity in the range from 22 % to 57 %.
The study consisted of the determination of the subjects’ complex reaction time and indicators of cognitive function (attention and perceptiveness – tests TUS) in two measurement series. I series involved tests related to vertical whole-body vibration exposure and II series to horizontal (lateral) whole-body vibration exposure.
Vibration test signal was filtered white noise with frequency range: 1 Hz-30 Hz controlled with an accuracy of ±2 dB. The value of the frequency weighted vibration acceleration of the test signal was 0.9 m/s2 controlled with a precision of ±0.05 m/s2. (In Poland it is 28 % of the limit value for short-term exposure whole-body vibrations in the working environment of 3.2 m/s2 [11]). Each single exposure of the subject lasted 20 min.
3.1. Measurement equipment
The experimental tests have been carried out on developed test bench [12]. The basic part of the bench was the system for generation of low-frequency vibrations. The system allowed to simulate both horizontally and vertically whole-body vibration. It was based on: shaker IMV J240 type, power amplifier IMV type SA4M J40 and control system Crystal Instruments Spider-81. The schemes of bench for simulation of the vertical vibration is shown in Fig. 1 and its version for simulation of horizontal vibration in Fig. 2.
Fig. 1The scheme of bench for simulation of the vertical vibration exposure
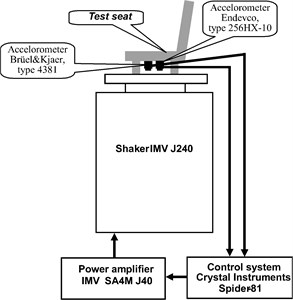
Fig. 2The scheme of bench for simulation of the horizontal vibration exposure
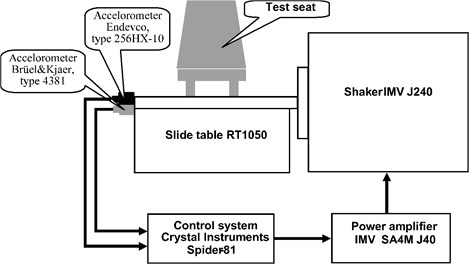
Fig. 3Measurement set for complex reaction time tests
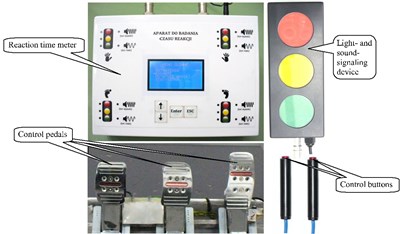
The developed bench provides simulation exciting signal without disturbances in the entire range used in the research 1-30 Hz (resonance frequencies of bench elements > 120 Hz). It has been equipped with the system for complex reaction time measurements i.e. the AT SMART meter working with control pedals and buttons as well as the signal light- and sound-signaling device (Fig. 3).
3.2. Tests procedure and determined parameters
Both test series enrolled training and three measurements of the complex reaction time as well as two TUS tests according to the following order:
1. 3/8 TUS test (performed in separated room),
2. Complex reaction time test-training,
3. Complex reaction time test before exposure to vibration-measurement 1,
4. Complex reaction time test during exposure to vibration (after 10 minutes from the start of the exposure)-measurement 2,
5. Complex reaction time test after exposure to vibration-measurement 3,
6. 6/9 TUS test (performed in separated room).
In both series, the same groups of examined persons participated in tests. They were exposed to vibration, in a sitting position two times (one day exposure to vertical vibration-I series and horizontal vibration another day-II series). For each subject break between series I and II of studies was at least 2 weeks to reduce the effect of “learning”.
During complex reaction time tests the subjects had intended to push with foot the right pedal when the light-signaling device turns red, push the left pedal when the light-signaling device turns green, do not react when the light-signaling device turns yellow, press the button with right hand when the sound-signaling device turns on.
The following parameters were recorded: complex reaction time value, range (maximum value minus minimum value) of recorded values, number of errors.
Used cognitive function (attention and perceptiveness) tests TUS consists of 2 independent versions differing in symbols to cross out: 3 and 8 (3/8 test), 6 and 9 (6/9 test). Subjects have to cross out in 3 minutes given symbols out of similar ones. Three indicators were determined:
1. SP-the number of items viewed (working speed),
2. LO-the capacity indicator to see relevant stimuli (the number of omitted items),
3. LB-indicator of the correctness of the tusk completion (the number of errors).
4. Subjects
The study enrolled 20 men at the age of 50+ (10 men who have been exposed to vibration at workplaces for at least 10 years, and 10 men working for at least the last 10 years at workplaces without exposure to vibration). Qualification of the subjects was carried out on the basis of the medical assessment and preliminary psychomotor tests.
Table 1Physical characteristics of subjects
Age, year | Mass, kg | Height, cm | |
Mean value | 54,5 | 93,9 | 178,4 |
Standard deviation | 3,7 | 11,6 | 4,7 |
Median | 53 | 95 | 179 |
In accordance with the requirements of PN-EN ISO 13090-1 within the scope of the study includes the following types of qualifying tests: survey (on the state of health of the subjects), medical examination, test resting ECG.
Age, mass and height of qualified subjects are shown in Table 1.
5. Results
According to the applied methodology, complex reaction time was determined during three measurements for each subject: measurement 1-just before vibration exposure, measurement 2-during vibration exposure (10 min after the start), measurement 3-immediately after the end of exposure. Each of the three result sets contained 35 recorded values for each of 20 subjects. In Table 2 mean values of the average values of complex reaction time determined for each subject during the I series of tests (vertical vibration) are presented. Similarly, Table 3 shows the results obtained during the II series of tests (horizontal vibration).
Indicators of cognitive function tests (TUS) were determined during two tests for each subject: 3/8 test 10 min before vibration exposure, 6/9 test-10 min after the end of exposure. In Table 4 mean values of the average values of TUS test indicators for each subject during the I series of tests (vertical vibration) are presented. Similarly, Table 5 shows the results obtained during the II series of tests (horizontal vibration). Because during all tests there was only one case of error, LB-indicator is not included in the tables.
Table 2Complex reaction time values, ranges and number of errors in I series of tests (vertical vibration)
Complex reaction time, s | Range, s | Number of errors | |||||||
Measurement 1 | Measurement 2 | Measurement 3 | Measurement 1 | Measurement 2 | Measurement 3 | Measurement 1 | Measurement 2 | Measurement 3 | |
Mean value | 0,555 | 0,549 | 0,539 | 0,450 | 0,436 | 0,421 | 2,55 | 2 | 1,45 |
Standard deviation | 0,041 | 0,047 | 0,048 | 0,063 | 0,107 | 0,101 | 1,54 | 1,89 | 1,76 |
Median | 0,550 | 0,550 | 0,535 | 0,440 | 0,440 | 0,430 | 2,0 | 1,5 | 1,0 |
Table 3Complex reaction time values, ranges and number of errors in II series of tests (horizontal vibration)
Complex reaction time, s | Range, s | Number of errors | |||||||
Measurement 1 | Measurement 2 | Measurement 3 | Measurement 1 | Measurement 2 | Measurement 3 | Measurement 1 | Measurement 2 | Measurement 3 | |
Mean value | 0,525 | 0,518 | 0,505 | 0,436 | 0,377 | 0,396 | 1,5 | 1,25 | 1,05 |
Standard deviation | 0,045 | 0,063 | 0,042 | 0,082 | 0,116 | 0,105 | 1,32 | 1,33 | 1,05 |
Median | 0,510 | 0,515 | 0,490 | 0,440 | 0,370 | 0,380 | 1,0 | 1,0 | 1,0 |
Table 4Cognitive function tests (TUS), I series (vertical vibration)
3/8 test | 6/9 test | |||
SP | LO | SP | LO | |
Mean value | 636,2 | 4,7 | 676 | 4,7 |
Standard deviation | 150,1 | 4,5 | 136,4 | 4,3 |
Median | 593,0 | 2,5 | 627,5 | 3,0 |
Table 5Cognitive function tests (TUS), II series (horizontal vibration)
3/8 test | 6/9 test | |||
SP | LO | SP | LO | |
Mean value | 716,7 | 4,3 | 737,4 | 5,5 |
Standard deviation | 162,8 | 4,3 | 152,2 | 5,5 |
Median | 668,5 | 3,0 | 692,0 | 4,0 |
For statistical evaluation of obtained results univariate analysis of variance has been used ( 0,05, – result of univariate analysis of variance, – significance level). Tables 6 and 7 contain results of statistical calculations.
Table 6Results of univariate analysis of variance of complex reaction time values, ranges and number of errors in I series of tests in relation to the results of II series of tests (vertical/ horizontal vibration)
Complex reaction time, s | Range, s | Number of errors | |||||||
Measure ment 1 I ↕ Measure ment 1 II | Measure ment 2 I ↕ Measure ment 2 II | Measure ment 3 I ↕ Measure ment 3 II | Measure ment 1 I ↕ Measure ment 1 II | Measure ment 2 I ↕ Measure ment 2 II | Measure ment 3 I ↕ Measure ment 3 II | Measure ment 1 I ↕ Measure ment 1 II | Measure ment 2 I ↕ Measure ment 2 II | Measure ment 3 I ↕ Measure ment 3 II | |
2,288 | 1,467 | 2,732 | 0,161 | 1,330 | 0,277 | 2,546 | 0,995 | 0,360 | |
0,148 | 0,242 | 0,116 | 0,695 | 0,265 | 0,607 | 0,128 | 0,333 | 0,557 | |
Table 7Results of univariate analysis of variance for indicators of cognitive function (TUS) in I series of tests in relation to the results of II series of tests (vertical/ horizontal vibration)
3/8 test I ↕ 3/8 test II | 6/9 test I ↕ 6/9 test II | |||
SP | LO | SP | LO | |
1,251 | 0,050 | 0,854 | 0,123 | |
0,279 | 0,828 | 0,369 | 0,732 | |
6. Discussion
Comparison of average complex reaction time values shows that in both test series the values obtained before and during exposure to vibration (measurement 1 and 2) practically do not differ. While the slightly smaller values ware obtained after exposure (measurement 2). The decreasing value of complex reaction time means improved psychomotor functions. Complex reaction time values obtained during all three measurements of II test series are slightly smaller than obtained values of I test series. Similar dependencies concern the values of range and the number of errors. However, all the observed dependencies were not clearly confirmed in the statistical analysis (Table 6, significance level 0,116).
Analysis of TUS test results show that the working speed indicator SP reaches a bit larger values during 6/9 test than during 3/8 test in both test series (I and II). The increasing values of SP indicator mean improved cognitive function. By comparing the SP values in the I and II series it can be noticed that both the SP values obtained during 3/8 and 6/9 test were bigger in II series of tests. (Probably this may be due to a learning effect.) These phenomena were not observed in relation to the LO (and LB) indicator. As in the case of the complex reaction time observed depending on the statistical calculations have not been confirmed (Table 7, significance level 0,279).
7. Conclusions
Although, during carried out pilot studies, none of the observed phenomena has not been confirmed in statistical calculations, they can be justification to undertake research on the larger population of subjects.
It is very positive, that it has not been observed deterioration in complex reaction time and in cognitive functions as the effect of exposure to vibration. Often observed even improvements of the indicators after vibration exposure, however it should be checked in order to eliminate the effect of other factors and phenomena (especially the learning effect and habituation to the stimulus).
On the base of the study results can be concluded that, probably even workers at the age of 50+ can safely perform work requiring psychomotor efficiency during exposure to vibration. This should be confirmed by the results of the research on a large population of employees.
References
-
Kun Jiao Qi S., Chengtao Wang, Ming Chen, Zengyong Li Effect of different vibration frequencies on heart rate variability and driving fatigue in healthy drivers. International Archives of Occupational and Environmental Health, Vol. 5, Issues 2004-77, 3, p. 205-212.
-
Mabbott N., Foster G., Mcphee B. Heavy Vehicle Seat Vibration and Driver Fatigue. Department of Transport and Regional Services Australian Transport Safety Bureau. ARRB Transport Research, 2001, p. 1445-4467.
-
Ljungberg J. K., Parmentier F. B. R. Psychological effects of combined noise and whole-body vibration: a review and avenues for future research. Proceedings of the Institution of Mechanical Engineers, Part D: Journal of Automobile Engineering, Vol. 224, Issue 10, 2010, p. 1289-1302.
-
Shinohara M. Effects of prolonged vibration on motor unit activity and motor performance. Medicine and Science in Sports and Exercise, Vol. 37, Issue 12, 2005, p. 2120-2125.
-
Tirović M. A., Popović V. M., Stamenković D. D. Operator’s reaction time prolongation induced by whole-body vibration. FME Transactions, Vol. 42, Issue 4, 2014, p. 297-304.
-
Sillamy N. Dictionary of Psychology. Publishing House Książnica, 1989.
-
Reber A. S. The Penguin Dictionary of Psychology. Penguin Books, 1985.
-
Zamanian Z., Nikravesh A., Monazzam M. R., Hassanzadeh J., Fararouei M. Short-term exposure with vibration and its effect on attention. Journal of Environmental Health Science and Engineering, Vol. 13, Issue 12, 2014, p. 1-135.
-
Łuczak A. Selection to the Difficult and Dangerous. Work Safety, 2, 1999, p. 12-17
-
PN-EN ISO 13090-1:2002 Mechanical vibration and shock – guidelines for safety tests and experiments involving humans – part 1: Exposure to whole-body mechanical vibration and repeated shocks.
-
Regulation of the Minister of Labour and Social Policy in Poland dated June 6, 2014, on maximum concentrations and intensities of factors harmful to health in the working environment, 2014.
-
Kowalski P., Zając J. Test bench for the simulation of low frequency whole-body vibration, Proceedings of the 22nd International Congress on Sound and Vibration, Florence, Italy, 2015.
Cited by
About this article

This paper was based on the results of a research task carried out within the scope of the third stage of the National Programme “Improvement of safety and working conditions” partly supported in 2014-2016 – within the scope of research and development – by the Ministry of Science and Higher Education/National Centre for Research and Development. The Central Institute for Labour Protection – National Research Institute is the Programme’s main coordinator. The authors make special thanks for psychological consultation dr. Anna Łuczak, Central Institute for Labour Protection – National Research Institute.
