Abstract
In order to reduce the disadvantages of current biological product quality testing methods, taking the quality testing in cocoon trade markets as an example, this paper has proposed a quality nondestructive testing method for biological products based on the analysis of vibration signal from acceleration sensors. According to the wavelet transformation analysis on the random vibration signal acquired from the acceleration sensor, the random vibration signal related to the silkworm chrysalis quality has been analyzed and reconstructed; then the characteristic values such as: mean value, variance, mean square root, waveform index, pulse factor, and so on of the quality signal have been extracted also; and then the characteristic values of the quality have been optimally selected within a fuzzy clustering method; at the end, a RBF neural network testing model with characteristic values from the silkworm chrysalis quality as an input signal was built. With these procedures, this paper has established a quality nondestructive testing system for silkworm chrysalis quality based on acceleration sensor signal measurement. The results from the application experiments demonstrated the effectiveness and applicability of this quality nondestructive system for quality testing of biological products. This quality nondestructive testing system has many advantages, including shortening the testing time, avoiding sample waste from traditional testing method, increasing the accuracy and reliability, which shows many bright social and economic benefits. This paper also provides the design and application of quality nondestructive testing systems based on vibration signal analysis with a theoretical support and experimental basis.
1. Introduction
At present, the nondestructive testing of biological products is one of the important research directions in food field, medicine field, light industry field and so on. But how to identify the characteristic value effectively, rapidly, accurately and to determine the target parameters of biological products is still a difficult problem [1]. For example, to purchase and sale the biological products such as cocoon in light industries field currently, the operation mode of cocoon quality rating consists usually in taking 50 g fresh specimens from cocoon to strip the cocoon covering, to cut and to pour out the pupa, to shed the skin, to remove the dirt, and to dry them to get no-water quality, then to measure the dry shell quality. Based on the dry shell quality, grade the cocoon, usually select 9.2 g dry shell quality having the quasi level, and each difference 0.2 g has its level [2]. Because of baking the shell for a long time, a lot of cocoon stations only evaluate the cocoon by touch and ocular estimation in the face of thousands of cocoon households. But this method only can be used to evaluate the visual quality of cocoon, and the testing precision of the method is very low, also the evaluation results could be influenced by subjective factors and practical experience of evaluator cannot achieve the high quality and high price. To cut the cocoon and to weight it, one must destroy the sample, to cause great economic waste. According to the statistics, about 930 t of fresh cocoon may be wasted every year, the direct economic losses amounted to RMB 13 million.
In order to realize the hedonic price and reduce the economic loss during the purchasing of cocoon, the cocoon quality nondestructive testing technology without cutting cocoon develops rapidly in recent years. Many related researches have been carried out by the China Test Research Institute, Sichuan Academy of Agricultural Sciences, Zhejiang Academy of Agricultural Sciences and so on, and the principle of suspension separation application momentum, two weighing method, elastic determination method, image recognition method, THz wave method, magnetic resonance imaging method and et al had been put forward [3]. However, due to the detection accuracy is not stable; there is still a distance from the practice. Such as, the detection is based on image processing method [4], through the lighting of cocoon, using CCD camera image acquisition and processing, to calculate the dry shell quality of cocoon, but due to cocoon surface shape and internal structure difference and light affected by external disturbance, the detection effect and accuracy are not ideal. The [5] had studied the THz wave technology in the application of nondestructive measurement of agricultural products, and which became a research hotspot in recent stage, but most studies were conducted under laboratory conditions, which ignored many factors, so it was difficult to ensure the accuracy of test results from the practical application, there was a certain gap. The [6] using mechanical detection technology established the test system response to acquire the response signal and to analyze the signal frequency characteristics of the biological materials. The good correlation between the main response frequency and the quality of the material properties had been analyzed, but due to measurement limitations, the effect was not satisfactory. In addition, the silkworm and other crop products were detected by the NMR nondestructive testing technique in [7], and the results were satisfactory. But because of expensive equipment, equipment of large volume and low detection cost effect, which was not suitable for the practical application of low prices of agricultural products.
Therefore, the paper proposes a new method for cocoon quality nondestructive testing based on vibration signal analysis. It is aimed to sample the random vibration response signal of biological products by the acceleration sensor using the wavelet transform method to decompose and reconstruct the vibration signal by wavelet transform, and to extract the characteristic value [8]. Then it is optimum to select the characteristic value by fuzzy clustering method [9]. Then using the characteristic signals as the input, the RBF neural network identification model has been set up to realize the nondestructive quality testing for silkworm chrysalis. Comparing with the traditional testing method, the nondestructive testing method that proposed in the paper can greatly short the operation time, and can avoid wasting a large number of samples. The recognition results have higher precision and higher reliability. And the nondestructive testing method that designed in the paper is expected to obtain obvious social and economic benefits [10].
2. Nondestructive testing system established for biological product
The basic principle of the nondestructive testing method is to fix the cocoon shell in the test bench shown in Fig. 1 (the silkworm chrysalis can random vibrate in the cocoon shell), and the vibration exciter with sine law excitation
Fig. 1Nondestructive testing experimental bench
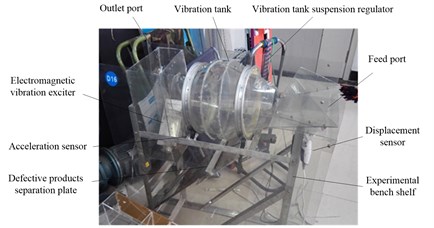
Using the acceleration sensors, it is required to sample the original vibration signal of the cocoon.
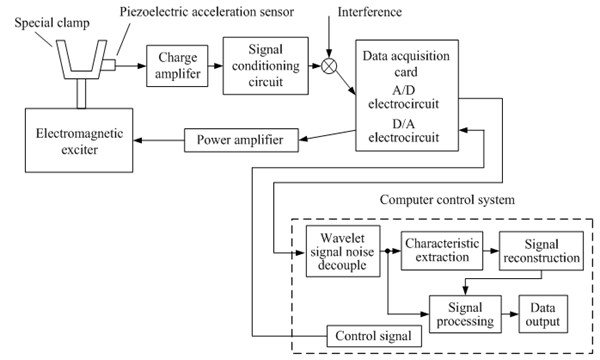
From the experiment it is known that, under the conditions of excitation frequency and excitation power invariable, if the quality of the silkworm chrysalis is greater, the greater random vibration signal amplitude of the silkworm chrysalis in the cocoon shell can be obtained, and the greater variance. The vibration testing device is shown as Fig. 1. The testing device is mainly composed of electromagnetic vibration exciter, piezoelectric acceleration sensor, charge amplifier, power amplifier, data acquisition card and so on. The nondestructive testing system structure chart that used to sample and process the cocoon vibration signal is shown in Fig. 2.
Fig. 2Vibration signal test structure chart of nondestructive testing system
3. Wavelet decomposition and characteristic extraction of vibration response signal
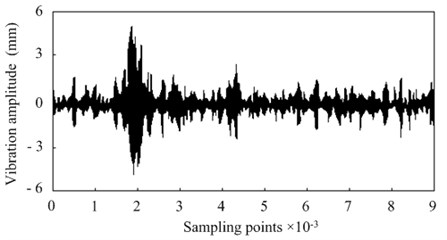
During the measuring course, 25 grain cocoons are randomly selected from a group of cocoons, and randomly fixed in the test bench shown in Fig. 1. The sampling frame length is set as 8192, and the sampling frequency is 2 MHz, then the original vibration signal can be sampled shown in Fig. 3.
Fig. 3Original vibration signal of cocoon
Discrete process the original vibration signal of cocoon that measured by acceleration sensor, and select Eq. (1) to be the discrete processing function [13-15]:
If then:
If then:
Then based on Eq. (1), Eq. (2) and Eq. (3), the binary wavelet transform of cocoon random vibration signal can be expressed as:
where, is the dual operator of .
To discrete process the continuous time , the finite length sequences discrete wavelet transform of vibration signal can be described as :
Namely, the wavelet decomposition discrete form of random vibration signal can be obtained as Eq. (5) and Eq. (6). Then based on Eq. (5) and Eq. (6), the wavelet packet reconstruction of can be expressed as:
where, is the No. decomposition sequence of the finite length sequences which are wavelet packet decomposed with layer; and are the low pass and high pass filter functions; and are the dual operators of and .
Use the 4-layers wavelet packet decomposition method to analyze the vibration signal shown in Fig. 3, then the energy spectrum can be obtained to be the identification characteristic value of the silkworm chrysalis quality. Four detail characteristic coefficients can be gotten as shown in Fig. 4, where 1, 2, 3, 4.
The detail characteristic coefficients shown in Fig. 4 are the important indicator, which can be used to distinguish the different type vibration signals such as silkworm chrysalis and noise signal and so on from the vibration signal of cocoon.
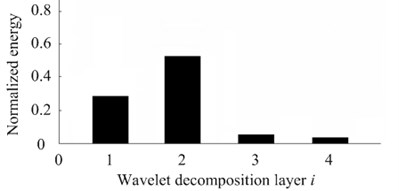
In the paper, to normalize the process and energy of the four-layers detail characteristic space coefficients, then the normalized energy distribution of each detail characteristic space can be gotten as shown in Fig. 5. In Fig. 5, the horizontal coordinate express that the detail characteristic space of No. layer is (1, 2, 3, 4).
Know from Fig. 5 that, the energy of the cocoon’s vibration response signal is concentrated in the first layer and second layer. According to the energy value, to order the different wavelet decomposition layers and to form the characteristic vector, then the characteristic frequency band of the vibration signal of different silkworm chrysalis quality can be identified [16, 17].
Based on the frequency band energy, the wavelet characteristic extraction algorithm can be designed as follows:
(1) To reduce the noise of the vibration response signal of the cocoon and then to decompose the 4 layers’ wavelet packet the signal, to extract the 24 (remember to ) unit’s frequency components of the signal characteristic from low frequency to high frequency of every layer respectively;
(2) To wavelet packet decompose and reconstruct the vibration signal, then to extract the vibration signal in each frequency band, and express them as ;
(3) To find the total energy of each frequency band of the vibration signal, and set the energy of every frequency band is , namely ;
(4) To construct the characteristic vector based on the energy of every frequency band .
Then the characteristic vector of silkworm chrysalis quality can be established as Eq. (8):
Fig. 4Detail characteristic drawing of 4 layers wavelet decomposition
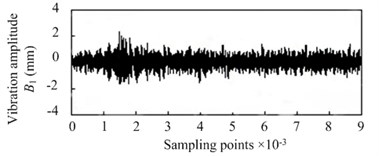
a) First layer of wavelet decomposition
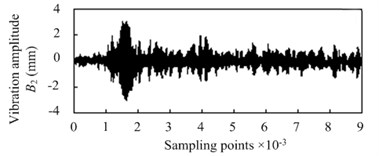
b) Second layer of wavelet decomposition
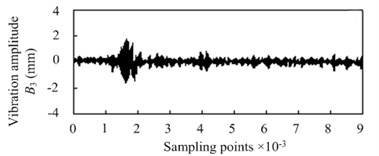
c) Third layer of wavelet decomposition
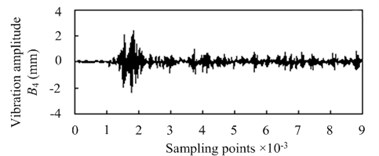
d) Fourth layer of wavelet decomposition
Fig. 5Energy distribution of wavelet decomposition layer
4. Selection of preferred characteristic parameters based on fuzzy clustering
It is known from the analysis result of the wavelet decomposition and characteristic extraction of the cocoon vibration signal ahead, that many kinds of characteristic parameters of the random vibration signal of the silkworm chrysalis can be obtained, such as mean value, variance, mean square root, peak value number, waveform index, peak value factor, pulse factor, margin factor, wavelet transform 4-layer decomposition energy value and so on. Because the multiple and miscellaneous characteristic indicators will bring trouble to the analysis and some characteristic indicators are interrelated, if the interrelated indicators also are analyzed, which will bound to cause redundancy of the analysis. In order to avoid the blindness and subjectivity during the course of the characteristic parameters selected of the silkworm chrysalis vibration signal, based on the fuzzy clustering theory [18-21], the paper has designed a new selected method to carry out the selected preferred characteristic parameters.
Set the given sample in the test is , fuzzy clustering number is , then setting objective function Eq. (9) can be obtained as:
where, is the centre of No. category, is the membership degree of No. sample in No. category, and meet that:
In order to obtain the optimal solution of objective function Eq. (9), set the constraint condition as Eq. (11) and Eq. (12):
where, is the weighted coefficient of membership degree.
Using the following algorithm, the characteristic sample of the cocoon vibration signal is optimally selected as:
(1) Set the initial value of parameters and , the value of is usually set as 2 which can be gotten from the literature [22], and then calculate the initial clustering center value of ;
(2) Calculate the value of and which are restricted by the constraint conditions Eq. (11) and Eq. (12);
(3) Set the cluster trial range , if the appropriate norm matrix can be obtained, which make satisfied, then stop the analysis, and according to the calculated result output to determine the preferred characteristic value; if the norm matrix , then turn to the step (2) to start the next calculating, until be met.
Based on the fuzzy clustering algorithm above, select the preferred characteristic identification indexes of the silkworm chrysalis quality that is shown as follows: root mean square, wavelet decomposition energy of No. 1 layer, wavelet decomposition energy of No. 2 layer, margin factor and wave form indicator. Where the root mean square is ; the waveform indicators is ; the margin factor is .
5. Quality recognition model based on RBF neural network
At present, the methods of quality identification include orthogonal test, variance analysis, regression analysis and so on [23]. Due to the characteristics value of the vibration signal and the quality of silkworm chrysalis has a complex multi-input single output nonlinear relationship, these methods of poor adaptability deal with this kind of problem, and the application of these methods overly depends upon the knowledge and experience of the research field, it is difficult to establish the accurate mathematical model to calculate the quality of silkworm.
Using five vibration signal characteristic values which are obtained by the fuzzy clustering optimization method as the input, and the identification of cocoon chrysalis quality value as the output, establish the RBF neural network model for cocoon nondestructive testing system [24]. The number of the hidden nodes of the neural network is optimized by the genetic algorithm to set 5. Set the initial weights, and the output layer of the neural network is 1. Then set up the RBF neural network structure shown in Fig. 6.
Fig. 6RBF neural network model for silkworm chrysalis quality recognition
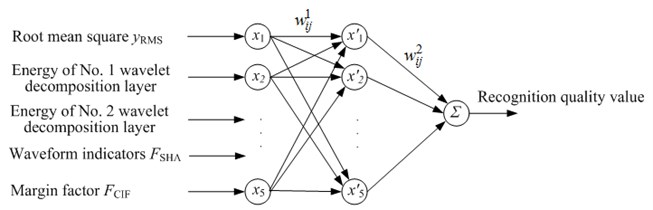
The mathematical description of each layer of Fig. 6 is as follows: network input vector is ; the implicit node activation function uses the Gauss’s function which can be obtained from literature [25] that , where is the RBF neural network expansion constant, which can be used to determine the response range of the neural network to the input. In Fig. 6, is the transform weight of every layer, where the superscript represents the transformation layer, and the subscript represents two nodes which are connected by transformation. This paper calculates the weight of every layer by the steepest gradient descent method, and the operation algorithm is shown as follows:
(1) Use the small random number to initialize the weight of Fig. 6, and set the initial training time is ;
(2) Randomly select a single sample and expected output from the training sample, and set them to be the validation sample;
(3) Calculate the actual output of the neural network as shown in Fig. 6 under the conditions of input which are set at step (2):
where, is the number of training samples; is the Sigmoid function and ;
Fig. 7Quality identification signal of silkworm chrysalis by RBF neural network
(4) Adjust the weight from the input layer, the weight of No. layer is expressed as:
where, ; is the learning step size of the neural network as shown in Fig. 6; is the expansion constant of the implicit layer and the output layer which are calculated by the inverse calculation method. And the output layer is , 1, 2,…, 5, the implicit layer is , 1, 2,…, 5;
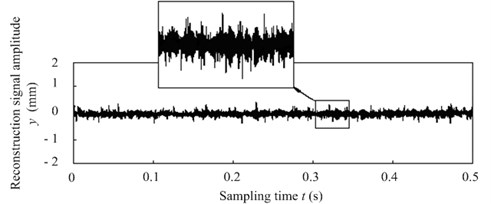
(5) Test the neural network as shown in Fig. 6 many times, if the average square variance of the actual output and desired output is less than the threshold value than set by the initial value, then stop the calculation, and the silkworm chrysalis quality identification value could be obtained from a random vibration signal , which is shown in Fig. 7.
6. Experiment and discussion
During every test, randomly select 25 grains from a number of cocoons, and randomly place them in the fixture shown in Fig. 1, made a total of 200 tests. According to the analysis method that deduced in the third part of the paper, decompose a wavelet of the vibration signals of the cocoons which sampled by the nondestructive testing system as shown in Fig. 2 to reconstruct random vibration signals of silkworm chrysalis as described in Eq. (7), and the characteristic energy layer shown in Fig. 4 and Fig. 5 can be also obtained by the by wavelet decomposition system. By the wavelet feature extraction algorithm based on frequency band energy analysis designed in the paper, the quality characteristics random vibration signal of silkworm could be gotten as Eq. (8). Based on Eq. (8) and the fuzzy clustering optimization algorithm for the quality vibration signal characteristic value which is derived in the fourth part of the paper, five characteristic values related to the silkworm chrysalis quality can be obtained: the root mean square, wavelet decomposition energy of No. 1 layer (the 1st layer shown in Fig. 5), wavelet decomposition energy of No. 2 layer (the 2nd layer shown in Fig. 5), margin factor and wave form indicator. Then use five characteristic values to be the input of the RBF neural network identification model shown in Fig. 6, the quality of silkworm identification value could be derived as shown in Fig. 7. Based on the steps shown above, the whole process from the random vibration signal of cocoon to the recognition quality value of silkworm can be accomplished perfectly.
During the tests, select 120 samples to be the training samples, and select 155 samples to be the prediction samples, then the prediction error statistical results can be obtained as shown in Table 1.
Table 1Prediction error statistical results of prediction samples
Prediction error range / g | Number of samples which meet conditions | Total number of samples | Prediction success rate / % |
< 0.2 | 141 | 155 | 90.9677 |
0.2-0.5 | 5 | 155 | 3.2258 |
> 0.5 | 9 | 155 | 5.8064 |
As known from the Table 1, when the set error of the actual value and predicted value is less than 0.2 g, the number of prediction success value has the occupation ratio of 90.9677 % of the total sample number. Comparing the value of the error statistics and value of cocoon testing standard statistics (the statistics value shall reach more than 95 %), a certain difference can be found out. But the experiment proved that the detection method was feasible, and the comparison with the previous detection method was a great improvement [26], which could realize the principle of “high quality – high price, and low quality – low price” of the cocoon purchasing policy basically, and the accuracy of rating was stable and reliable, and there were little human factors, which could greatly improve the enthusiasm of the farmer.
Comparing with the literature [27], the nondestructive detection method that designed in this paper could effectively reduce a generalization error of each operation link during the process of detection, could improve the detection accuracy, and the highest detection accuracy could be increased to about 3.2 %.
Table 1 also shows that if the error of the actual value and predicted value is greater than 0.5 g, the occupation ratio is 5.8064 %. The reason may be that the silkworm chrysalis is stuck in the cocoon shell, which will result in that the silkworm chrysalis cannot produce the vibration signal, so it causes testing errors. In order to eliminate these kinds of error, add the multi-sensor data integration method to the vibration signal test above, used to detect the characteristic value of the cocoon’s surface image related to the quality of cocoon shell by surface image testing sensor, and then integrate the vibration signal characteristic value and image characteristic value, in order to eliminate the error of single sensor testing.
7. Conclusions
Based on the acceleration sensor, the response vibration signal of biological products has been obtained in this paper. Then wavelet decomposition and reconstruction analysis has been conducted on the signal. The characteristic values of the signal have been optimized within the principle of fuzzy clustering. And a RBF neural network testing model has been built to detect the quality of the silkworm chrysalis. Then the quality nondestructive system for silkworm chrysalis has been designed and established based on the vibration signal analysis.
The application of the testing system has demonstrated the effectiveness and feasibility of this quality nondestructive testing method for silkworm chrysalis quality testing. The proposed method is significant because it can effectively increase the speed and accuracy of testing and extraction of biological product characteristic parameters, and it has strong anti-interference ability. Statistic data shows that this nondestructive testing method can increase the testing speed by about thirty-one times, and it has the testing accuracy rate of 90.97 percent, which eliminates the disadvantages in conventional methods, and increases the efficiency, accuracy and economic benefits.
References
-
Wen B. C., Li Y. N., Zhang Y. M., et al. Vibration Utilizing Engineering. Science Press, Beijing, 2005.
-
General Administration of Quality Supervision, Inspection and Quarantine of the People’s Republic of China (AQSIQ), GB/T 9111-2006: The methods of mulberry silkworm dried cocoons. Standardization Administration of the People’s Republic of China (SAC), 2006.
-
Ying Y. B., Yu H. Y. Review of non-destructive quality determination technology for agricultural products. Proceedings of the Annual Meeting of the Chinese Society of Agricultural Engineering, 2005, p. 70-83.
-
Gan Y., Zhou G. Z., Zhang J. G., et al. Study of cocoon quality nondestructive intelligent detection method. Guangxi Sericulture, Vol. 39, Issue 3, 2002, p. 37-39.
-
Jiang Y. Y., Ge H. Y., Lian F. Y., et al. Application of THz technology to nondestructive detection of agricultural product quality. Spectroscopy and Spectral Analysis, Vol. 34, Issue 8, 2014, p. 2047-2052.
-
Wang J., Teng B., Zhou M. Dynamic response of impact forces on pear. Transactions of the Chinese Society for Agricultural Machinery, Vol. 35, Issue 2, 2004, p. 65-68.
-
Zhang J. F., Wu D., Gong X. Y., et al. Non-destructive detection of plant roots based on magnetic resonance imaging technology. Transactions of the Chinese Society of Agricultural Engineering, Vol. 28, Issue 8, 2012, p. 181-185.
-
Richard B. An algorithm for the continuous Morlet wavelet transform. Mechanical Systems and Signal Processing, Vol. 21, Issue 8, 2007, p. 2970-2979.
-
Wang W., Zhang Y. T., Xu Z. S. Noise reduction in singular value decomposition based on dynamic clustering. Journal of Vibration Engineering, Vol. 21, Issue 3, 2008, p. 304-308.
-
Sajid H., Hossa A. A robust method for coupling detection among process variables. Process System Engineering, Vol. 2, Issue 1, 2012, p. 93-110.
-
Jordan M., Markus T. Fault detection in variable speed machinery: statistical parameterization. Journal of Sound and Vibration, Vol. 327, Issues 3-5, 2009, p. 623-646.
-
Peng Z., Chu F. Application of the wavelet transform in machine condition monitoring and fault diagnostics: a review with bibliography. Mechanical Systems and Signal Processing, Vol. 18, Issue 2, 2004, p. 199-221.
-
Fan H. Feature Extraction Method and its Application of Non-stationary Signal. Science Press, Beijing, 2013.
-
Newland D. E. An Introduction to Random Vibrations, Spectral and Wavelet Analysis. Prentice Hall, New Jersey, 1996.
-
Wang G. F., Wang Z. L., Qin X. D., et al. Accurate diagnosis of rolling bearing based on wavelet packet and RBF neural networks. Journal of University of Science and Technology Beijing, Vol. 26, Issue 2, 2004, p. 184-187.
-
Qiu H., Lee J., Lin J., et al. Wavelet filter-based weak signature detection method and its application on rolling element bearing prognostics. Journal of Sound and Vibration, Vol. 289, Issues 4-5, 2006, p. 1066-1090.
-
Song Y. X., Zhang C. C., Shi Y. S. Extracting algorithm for diagnostic parameters of aero-engine based on fuzzy-rough sets. Journal of Aerospace Power, Vol. 23, Issue 6, 2008, p. 1127-1130.
-
Li D. M., Wang Z. O. An algorithm for computing Lyapunov exponents of a dynamical system based on RBF neural networks. Information and Control, Vol. 33, Issue 5, 2004, p. 523-526.
-
Zeng S., Tong X. J., Sang N. Study on multi-center fuzzy C-means algorithm based on transitive closure and spectral clustering. Applied Soft Computing Journal, Vol. 16, Issue 3, 2014, p. 89-101.
-
Li J., Qian X. Z. A novel validity index for fuzzy c-means clustering algorithm. Journal of Computational Information Systems, Vol. 9, Issue 23, 2013, p. 9679-9688.
-
Kannan S. R., Ramathilagam S., Chung P. C. Effective fuzzy c-means clustering algorithms for data clustering problems. Expert Systems with Applications, Vol. 39, Issue 7, 2012, p. 6292-6300.
-
Li X. C., Xie M. D., Xu D. S., et al. On theoretic model of fuzzy classification and fuzzy recognition. Fuzzy Systems and Mathematics, Vol. 16, Issue 2, 2002, p. 58-64.
-
He W., Xue W. D., Tang B. Optimization Design of Experiment Method and Data Analysis. Chemical Industry Press, Beijing, 2012.
-
Zhang L. X., Zhao Y. Q., Wu J., et al. A new method of road surface spectrum identification based on RBF neural network. Journal of Highway and Transportation Research and Development, Vol. 24, Issue 6, 2007, p. 135-138.
-
Zhao Y. X., Xu Y. G., Gao L. X., et al. For fault pattern recognition of rolling bearing acoustic emission technique based on harmonic wavelet packet and BP neural network. Journal of Vibration and Shock, Vol. 29, Issue 10, 2010, p. 163-166.
-
Tang K. M., Xie Q. F., Yang M. Y., et al. Research progress on evaluation methods and new inspection technologies for silkworm cocoon quality. Science of Sericulture, Vol. 40, Issue 5, 2014, p. 924-927.
-
Hu Z. Z., Du Y. P., Zhang S. W. Theory and practice of the test method of dried cocoon shell weight. Sichuan Silk, Vol. 19, Issue 3, 1998, p. 14-17.
Cited by
About this article

The authors gratefully acknowledge the support from the National Natural Science Foundation of China (Grant No. 51105066), and the Fundamental Research Funds for the Central Universities (Grant No. N130403011).
