Abstract
Based on the wavelet packet analysis method with time-frequency analysis characteristics, the measurement signal of the vibration system is processed for noise reduction, the soft-hard threshold compromise wavelet denoising method used has the advantages of soft threshold and hard threshold denoising, and through the introduction of compromise factors, signal processing can be performed more flexibly in signal analysis. For the denoised signal, the fundamental wavelet time-energy spectrum analysis, the main components of the signal can be clearly displayed, and according to the distribution of its energy in each frequency band, the signal characteristics can be displayed intuitively. Experimental results show: It can be determined that there is a foreign body intrusion incident at a position 520 m away from the monitoring point, rather than a normal train travel incident. In fact, we are walking back and forth at a distance of about 520 m from the monitoring point, simulating the intrusion of illegal foreign objects such as pedestrians and livestock beside the railroad tracks prove that analysis and judgment can be known, the wavelet analysis proposed by the author can realize the monitoring and judgment of some illegal foreign body intrusion incidents such as pedestrians and livestock.
Highlights
- The article proposes a wavelet analysis framework to realize Fourier transformation and conversion processing, the processing effect of the signal with a longer period is better, because when a steam turbine fails.
- Its internal vibration signals are all generated by pulses, however, the structure of the steam turbine is very complex and requires high precision, and it is difficult to maintain and inspects.
- This results in the fault characteristics and fault signal pulses are very secret and difficult to find, at the same time.
- The noise generated by other normal operating equipment parts inside the steam turbine will cover it up, it is difficult for inspectors to find problems during maintenance.
- It analyzes the energy frequency band generated by the equipment independently and realize a separate detection record, quickly and effectively lock the frequency band generated by the fault.
1. Introduction
Wavelet analysis is also called multi-resolution or multi-angle analysis, is an analysis method evolved from Fourier analysis, it has important applications in the functional analysis of basic disciplines and the detection of signal systems, on-demand communications and digital fields, it is also a very important mathematical analysis method in information detection and system setting detection [1]. Among the signals generated by the vibration fault of the steam turbine, wavelet analysis can handle unstable signals, and only need to perform simple binary processing and normal exchange, can meet the testing needs. As shown in Fig. 1, in vibration fault engineering, wavelet analysis decomposes the vibration generated by the steam turbine into band-pass filtering and low-pass filtering, decompose the vibration wave generated by the steam turbine into two different sub-signals, in a short time, it helps inspectors to complete inspection tasks to achieve the purpose of inspection [2].
The major contribution of this article proposes a wavelet analysis framework to realize Fourier transformation and conversion processing, the processing effect of the signal with a longer period is better, because when a steam turbine fails. Its internal vibration signals are all generated by pulses, however, the structure of the steam turbine is very complex and requires high precision, and it is difficult to maintain and inspects. This results in the fault characteristics and fault signal pulses are very secret and difficult to find, at the same time. The noise generated by other normal operating equipment parts inside the steam turbine will cover it up, it is difficult for inspectors to find problems during maintenance, but with the help of wavelet analysis, the existing technical loopholes and shortcomings can be change, it analyzes the energy frequency band generated by the equipment independently and realize a separate detection record, quickly and effectively lock the frequency band generated by the fault [3].
The rest of this article is systematized as: Section 2 representing literature review followed by the methods described in Section 3. Section 4 provides the experimental results and analysis and conclusion is presented in Section 5.
Fig. 1Wavelet analysis v ibration signal detection framework
2. Literature review
Hassan and Bruni [4], linear array CCD measurement system, through the collection, processing and analysis of wheel and rail vibration signals, in order to realize the detection of train wheel failure. Based on semiconductor lasers and linear array sensors, designed a set of rail vibration measurement system that is not disturbed by roadbed vibration, realize the fast and high-precision online measurement of the train wheel/rail status in high-speed operation [5]. Gupta and Mittal [6], used a phase-sensitive optical time domain reflectometer, collection and analysis of rail vibration signals, in order to realize the positioning and speed measurement of the train. Al-Obaidi [7], uses the vibration acceleration detection method of train wheels, propose a method to detect the flat wheel signal of the train. Qi et al. [8], uses an acceleration sensor based on mEms technology, designed a set of vibration detection system, the monitoring and analysis of railway vibration signals provide a reasonable basis for the detection and judgment of railway vibration faults. Michalak et al. [9], proposed a special railway mobile communication system LTE-R (Long Term Evolution for Railway) method for wireless positioning of high-speed trains. Zhen et al. [10], designed a system based on GPS/DR/mm (global positioning technology, dead reckoning, map matching) combined positioning technology, in order to achieve real-time acquisition of train trajectory information. On the basis of GNss train positioning theory, Qiu Wangzhi, use GPS and Beidou satellite navigation and positioning system to realize real-time positioning of trains. Sun et al. [11], proposed a train positioning method based on Beidou/sINS (strapdown Inertial Navigation system) fusion, provides train positioning data with higher accuracy for train operation. The authors have proposed a multi-sensor information fusion positioning method based on speed sensors, reduce the number of query transponders used to improve the accuracy of train positioning. Wang et al. [12], believes that in the train positioning subsystem, multi-sensor information fusion technology will be possible to meet the requirements of train operation control accuracy. The multi-sensor positioning system they built mainly includes radar, fiber optic gyroscope, speed sensor and query transponder. Xueyi et al. [13], proposed a train positioning method based on map matching, this method must first have a map database, the database contains the angular velocity corresponding to each coordinate position point, accurately measure angular velocity through fiber optic gyroscope, then compare it with the angular velocity in the map database, furthermore, the current position of the train is determined according to the coordinate position points in the map database. Zhang et al. [14], Using phase-sensitive optical time domain reflectometer technology to collect and analyze rail vibration signals, in order to realize the positioning and speed measurement of the train. This technology uses only existing trackside optical cables, no need for additional construction workload, good real-time performance, it has many advantages such as simple installation, long service life, low maintenance cost, strong anti-interference ability, and large-scale distributed detection. The author will first denoise the measurement signal based on the compromise threshold method of wavelet analysis, then the signal is analyzed based on the wavelet energy spectrum method to identify the operating state of the system. Balyan [15], proposed a scheme for relay selection for users experiencing poor service on the basis of angle and coverage. The experimental analysis shows the dominance of their scheme over other relevant works. Saini and Balyan [16], proposed a scheme to reduce the code-blocking effect by implementing non-blocking codes. Their scheme achieves benefits for both single and multi-code options. Babalola and Balyan [17], proposed a scheme to enhance the transmission efficiency of visible light communication systems. Their work provides a simple encoding structure and presents a minimal number of redundancies to achieve energy efficiency. Yan et al. [18], proposed an image processing-based defect inspections scheme. Their approach is very effective in detecting defects and surpasses other image-processing-based approaches for defect detection. Kansal et al. [19], introduced a study for the performance analysis of WiMAX system. The observed results illustrate the reduction in signal-to-noise ratio.
3. Methods
3.1. Introduction to wavelet analysis
The essence of wavelet transform is to express the process of signal equation with carefully selected basis. Each wavelet transform will have a mother wavelet , there is also a scaling function, after scaling and panning the two, the basis function set of any wavelet transform can be obtained [15].
The continuous wavelet transform of signal is defined as:
Its inverse transformation (recovered signal or reconstructed signal) is:
The two coefficients of wavelet , represent the expansion factor and translation factor of signal decomposition, can describe the frequency domain information and time domain information of the signal respectively, the parameter a can also be called a scale factor, which is used to decompose the signal in different frequency domains, perform multi-scale analysis.
The discrete wavelet transform of signal is defined as:
Its inverse transform (return signal or reconstructed signal) is:
3.2. The compromise threshold method of wavelet coefficient estimation
Wavelet threshold denoising includes soft threshold and hard threshold denoising methods, that is, among the many wavelet coefficients, the coefficient with the smaller absolute value is set to zero, keeping or shrinking the coefficients with larger absolute values corresponds to the hard threshold and soft threshold methods respectively [16]. In the research of this project, by comparing and analyzing the characteristics of wavelet threshold denoising methods based on soft threshold and hard threshold, the soft-hard threshold compromise method is proposed, and the soft-hard threshold compromise method model for wavelet coefficient estimation is defined as:
where represents the wavelet coefficient of signal decomposition, represents the wavelet coefficients corrected by the compromise threshold method, corresponds to the threshold of the corresponding decomposition layer. In addition, . In particular, when taking 0 and 1, respectively, the above formula corresponds to the hard threshold and soft threshold estimation methods. For general , the size of the data estimated by this method is between the soft threshold and hard threshold methods. The size adjusted appropriately between 0 and 1, can obtain a better denoising effect [17].
3.3. Wavelet packet energy spectrum
According to the expression of wavelet decomposition, the wavelet transform obeys the conservation of energy, there are:
The above formula can be rewritten into the following two forms:
Define separately:
where and respectively represent the distribution of energy in time coordinate and scale coordinate. is a function containing only time parameters, which is subjected to spectrum analysis, the frequency information of the energy distribution of the signal to be analyzed can be obtained, which can be used to analyze the unsteady signal, that is, the speed-up signal in this project. is a function containing only the scale parameter a, according to the number of decomposition layers, we can get the distribution of energy in different frequency bands, it can be used to analyze steady-state signals, and by comparing with normal signals, fault signals can be identified [18].
4. Experimental results and analysis
On the rails, there are mainly two types of incidents: normal train driving and the intrusion of illegal foreign objects. So if you want to monitor and determine the intrusion of illegal foreign objects, first, it needs to be able to realize the monitoring and judgment of normal train driving events. Then, according to the characteristics of these two types of different events, the normal train operation and the invasion of illegal foreign objects are distinguished [19]. From a certain moment, use the -OTDR (optical time-domain reflectometer) system to collect the original signal of a certain section of high-speed rail train line in a certain southern high-speed rail station for a period of time, that is, the backscatter light signal along the railway track, which reflects the vibration signal along the railway track [20].
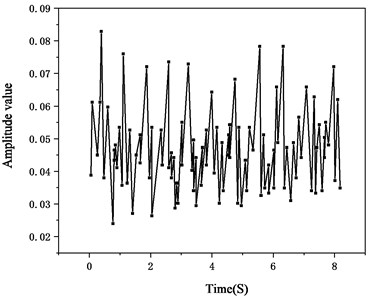
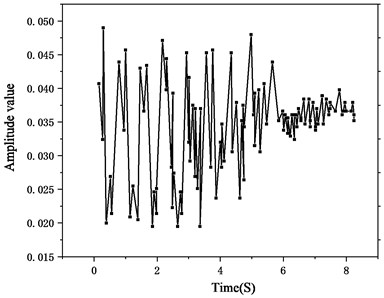
Fig. 2, Fig. 3 and Fig. 4, Fig. 5 are from different moments in a period of time, the original signal collected at the position of 1954 m from the monitoring point and the sub-picture of each signal processing effect.
Fig. 2The original signal at 1954 m at a certain moment
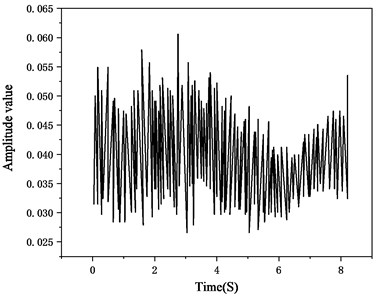
Fig. 3Filtered signal at 1954 m at a certain moment
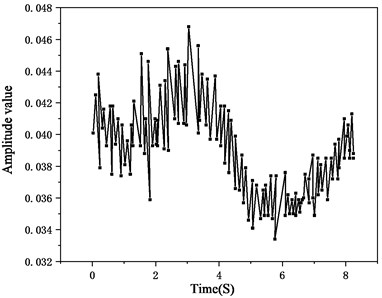
Fig. 4The original signal at 1954 m at another time
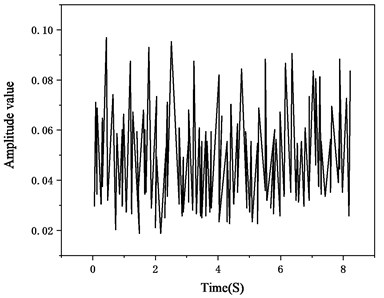
Fig. 5Filtered signal at 1954 m at another moment
Taking into account the particularity of the train, the normal train length is generally 400 m. When the train passes through this point normally, at least one location point within the range of 100 m-200 m before and after the location point has an event, and the foreign body intrusion event is usually a point, therefore, there has been no incident at any point outside the range of several tens of meters before and after the point of occurrence [21].
Figs. 6 and 7 are sub-pictures of the original signal and the effect of each signal processing at a position 1803 m 151 m in front of the 1954 m position point, it can be seen from the figures that an event occurred during the 4 s-8 s period. Figs. 8 and 9 are sub-pictures of the original signal and the signal processing effect at the position 2162 m 208 m behind the 1954 m position point, it can be seen from the figures that an event occurred during the period of 0 s-6 s. That is to say, there are incidents at the left and right positions in the range of 150 m-200 m before and after the position point, the duration of the entire distance exceeds 350 m, so it can be inferred that this is a signal for normal trains, it is not an illegal foreign body invasion incident [22].
Fig. 6Original signal at 1803 m
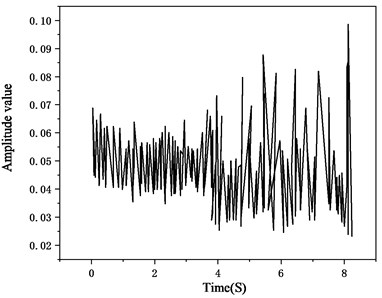
Fig. 7Filtered signal at 1803 m
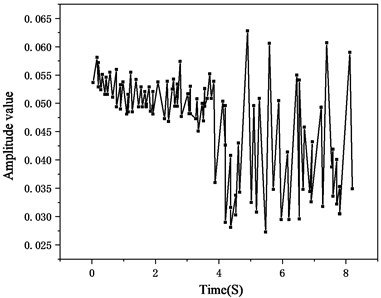
Fig. 8Original signal at 2162 m
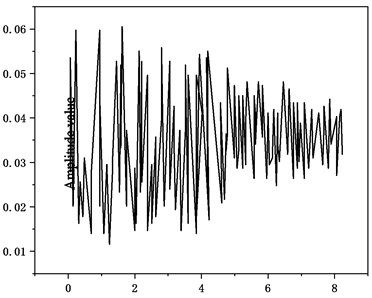
Fig. 9Filtered signal at 2162 m
In order to ensure the safety of public personnel, livestock and trains, and some of the railway infrastructure is free from malicious damage, railroad tracks are considered to be a relatively closed environment, in addition to normal railway staff and authorized behavior, do not allow other unauthorized acts and incidents of illegal intrusion into the railroad tracks, therefore, it is of great significance and function to monitor the illegal intrusion of railroad tracks [23, 24]. The optical fiber laid beside the railway track will be disturbed by pedestrians and livestock walking beside the railway track, the refractive index and length of the fiber at the corresponding position will change, this will cause a change in the light phase at that location. Since the light source is a strong coherent laser light source, so the final phase change will cause the light intensity to change due to interference, the specific location of the intrusion can be calculated through periodic light intensity changes and time delays.
Under the theory of wavelet analysis, sampling and wavelet frequency operation are the main tasks of the whole detection, because the vibration signal of each rotor in a steam turbine is different, the signal frequencies generated by different vibration signals are calculated in cycles and data collection is realized, during the operation of the steam turbine, the sampled data needs to be set periodically, the set period is the sampling frequency, generally, the data of the sampling setting is the number of whole cycles in order to sample and analyze and get the specific frequency range, at the same time, it can be known according to the vibration characteristics of the internal rotor of the steam turbine and the vibration signal, when performing operations after sampling, multi-scale decomposition of the signal source is required, and confirm the frequency range, starting from the signal of the wavelet classification at the top level, it is calculated by the number of cycles step by step, by analogy, the signal frequency range of each level can be obtained [25, 26]. In addition, the fault signals generated during counting and pulse statistics are also obstacles to detection that wavelet analysis often encounters, the fault signal characteristics of the machine need to be extracted in advance and loaded with a computer, the fault identification methods used in different modes are different, therefore, it is very important to accurately locate the signal frequency band where the fault is located before performing wavelet analysis, otherwise, the signal source strength will be reduced due to improper selection of frequency bands or uneven sampling in the later stage, the weak fault information is hidden in the frequency band, which increases the complexity and difficulty of the operation [27, 28].
5. Conclusions
For the initial signal with noise, first, the initial signal is denoised based on the wavelet packet denoising method of compromise threshold, remove the influence of noise, then, based on the wavelet energy spectrum method, the proportion of the de-noised signal in each frequency band is calculated, it can effectively extract the distribution characteristics of the measured signal and identify the state of the system. The effectiveness of the method is verified from simulation examples and actual measurement signal analysis. Experimental results show: It can be determined that there is a foreign body intrusion event at a location 520 m away from the monitoring point, rather than a normal train driving event. The experiments are conducted by walking around 520 m from the monitoring point to simulate the intrusion of pedestrians, livestock, and other illegal foreign objects near the railway track. It is observed from the experiment that wavelet analysis can realize the monitoring and judgment of some illegal foreign body intrusion incidents such as pedestrians and livestock.
References
-
G. Chen, Q.-Y. Li, D.-Q. Li, Z.-Y. Wu, and Y. Liu, “Main frequency band of blast vibration signal based on wavelet packet transform,” Applied Mathematical Modelling, Vol. 74, pp. 569–585, Oct. 2019, https://doi.org/10.1016/j.apm.2019.05.005
-
T. F. Bernard Marie, D. Han, and B. An, “Pattern recognition algorithm and software design of an optical fiber vibration signal based on Φ-optical time-domain reflectometry,” Applied Optics, Vol. 58, No. 31, pp. 8423–8432, Nov. 2019, https://doi.org/10.1364/ao.58.008423
-
L. Peng, H. Chen, H. Li, and X. Xun, “Innovative experimental study for slagging diagnosis based on vibration signal of the superheater tube panels in coal-fired boilers,” Journal of the Energy Institute, Vol. 92, No. 4, pp. 971–981, Aug. 2019, https://doi.org/10.1016/j.joei.2018.07.008
-
M. Hassan and S. Bruni, “Experimental and numerical investigation of the possibilities for the structural health monitoring of railway axles based on acceleration measurements,” Structural Health Monitoring, Vol. 18, No. 3, pp. 902–919, May 2019, https://doi.org/10.1177/1475921718786427
-
M. Peng, Z. Ding, L. Wang, and X. Cheng, “Detection of sleep biosignals using an intelligent mattress based on piezoelectric ceramic sensors,” Sensors, Vol. 19, No. 18, p. 3843, Sep. 2019, https://doi.org/10.3390/s19183843
-
V. Gupta and M. Mittal, “Arrhythmia detection in ECG signal using fractional wavelet transform with principal component analysis,” Journal of The Institution of Engineers (India): Series B, Vol. 101, No. 5, pp. 451–461, Oct. 2020, https://doi.org/10.1007/s40031-020-00488-z
-
A. R. Al-Obaidi, “Detection of cavitation phenomenon within a centrifugal pump based on vibration analysis technique in both time and frequency domains,” Experimental Techniques, Vol. 44, No. 3, pp. 329–347, Jun. 2020, https://doi.org/10.1007/s40799-020-00362-z
-
X. Qi et al., “Dynamic analysis and detection of wheel polygonization on high-speed trains based on axle box vibrations,” International Journal of Condition Monitoring and Diagnostic Engineering Management, Vol. 22, No. 3, 2019.
-
A. Michalak, J. Wodecki, A. Wyłomańska, and R. Zimroz, “Application of cointegration to vibration signal for local damage detection in gearboxes,” Applied Acoustics, Vol. 144, pp. 4–10, Jan. 2019, https://doi.org/10.1016/j.apacoust.2017.08.024
-
D. Zhen, J. Guo, Y. Xu, H. Zhang, and F. Gu, “A novel fault detection method for rolling bearings based on non-stationary vibration signature analysis,” Sensors, Vol. 19, No. 18, p. 3994, Sep. 2019, https://doi.org/10.3390/s19183994
-
G.-D. Sun, Y.-R. Wang, C.-F. Sun, and Q. Jin, “Intelligent detection of a planetary gearbox composite fault based on adaptive separation and deep learning,” Sensors, Vol. 19, No. 23, p. 5222, Nov. 2019, https://doi.org/10.3390/s19235222
-
Y. Wang, B. Tang, Y. Qin, and T. Huang, “Rolling bearing fault detection of civil aircraft engine based on adaptive estimation of instantaneous angular speed,” IEEE Transactions on Industrial Informatics, Vol. 16, No. 7, pp. 4938–4948, Jul. 2020, https://doi.org/10.1109/tii.2019.2949000
-
X. Li, J. Li, Y. Qu, and D. He, “Semi-supervised gear fault diagnosis using raw vibration signal based on deep learning,” Chinese Journal of Aeronautics, Vol. 33, No. 2, pp. 418–426, Feb. 2020, https://doi.org/10.1016/j.cja.2019.04.018
-
Q. Zhang, G. Lu, C. Zhang, and Y. Xu, “Development of arbitrary waveform torsional vibration signal generator,” Telecommunication Systems, Vol. 75, No. 4, pp. 425–435, Dec. 2020, https://doi.org/10.1007/s11235-020-00692-8
-
V. Balyan, “Cooperative relay to relay communication using NOMA for energy efficient wireless communication,” Telecommunication Systems, Vol. 77, No. 2, pp. 271–281, Jun. 2021, https://doi.org/10.1007/s11235-021-00756-3
-
D. S. Saini and V. Balyan, “OVSF code slots sharing and reduction in call blocking for 3G and beyond WCDMA networks,” WSEAS Transactions on Communications, Vol. 4, pp. 135–146, 2012.
-
O. P. Babalola and V. Balyan, “Efficient channel coding for dimmable visible light communications system,” IEEE Access, Vol. 8, pp. 215100–215106, 2020, https://doi.org/10.1109/access.2020.3041431
-
L. Yan, K. Cengiz, and A. Sharma, “An improved image processing algorithm for automatic defect inspection in TFT-LCD TCON,” Nonlinear Engineering, Vol. 10, No. 1, pp. 293–303, Jan. 2021, https://doi.org/10.1515/nleng-2021-0023
-
L. Kansal, G. S. Gaba, A. Sharma, G. Dhiman, M. Baz, and M. Masud, “Performance analysis of WOFDM-WIMAX integrating diverse wavelets for 5G applications,” Wireless Communications and Mobile Computing, Vol. 2021, pp. 1–14, Nov. 2021, https://doi.org/10.1155/2021/5835806
-
C.-H. Loh, W. Hsueh, Y.-C. Tu, J.-H. Lin, and T.-J. Kuo, “Vibration-based damage assessment of structures using signal decomposition and two-dimensional visualization techniques,” Structural Health Monitoring, Vol. 18, No. 4, pp. 991–1009, Jul. 2019, https://doi.org/10.1177/1475921718765915
-
H. H. Tang et al., “Intelligent fault diagnosis for low-speed roller bearings based on stacked auto-encoder,” International Journal of Condition Monitoring and Diagnostic Engineering Management, Vol. 22, No. 4, pp. 45–50, 2019.
-
H. Li, T. Bao, C. Gu, and B. Chen, “Vibration feature extraction based on the improved variational mode decomposition and singular spectrum analysis combination algorithm,” Advances in Structural Engineering, Vol. 22, No. 7, pp. 1519–1530, May 2019, https://doi.org/10.1177/1369433218818921
-
Y. Li, H. Dong, H. Li, X. Zhang, B. Zhang, and Z. Xiao, “Multi-block SSD based on small object detection for UAV railway scene surveillance,” Chinese Journal of Aeronautics, Vol. 33, No. 6, pp. 1747–1755, Jun. 2020, https://doi.org/10.1016/j.cja.2020.02.024
-
M. Liu, X. Wang, A. Zhou, X. Fu, Y. Ma, and C. Piao, “UAV-YOLO: small object detection on unmanned aerial vehicle perspective,” Sensors, Vol. 20, No. 8, p. 2238, Apr. 2020, https://doi.org/10.3390/s20082238
-
S. Fan, X. Wang, and Y. Zhang, “Study on PD detection for GIS based on autocorrelation coefficient and similar Wavelet soft threshold,” Cluster Computing, Vol. 22, No. S3, pp. 6755–6766, May 2019, https://doi.org/10.1007/s10586-018-2619-8
-
R. Cao, Z. Duo, and M. Su, “Analysis of magnetic field waveforms of different launching stages of rail gun based on wavelet transform,” IEEE Transactions on Plasma Science, Vol. 47, No. 1, pp. 500–507, Jan. 2019, https://doi.org/10.1109/tps.2018.2846584
-
J. Xu et al., “Automatic extraction of lineaments based on wavelet edge detection and aided tracking by hillshade,” Advances in Space Research, Vol. 65, No. 1, pp. 506–517, Jan. 2020, https://doi.org/10.1016/j.asr.2019.09.045
-
N. Ji et al., “Appropriate mother wavelets for continuous gait event detection based on time-frequency analysis for hemiplegic and healthy individuals,” Sensors, Vol. 19, No. 16, p. 3462, Aug. 2019, https://doi.org/10.3390/s19163462
-
M. Bentoumi, D. Chikouche, A. Mezache, and H. Bakhti, “Wavelet DT method for water leak‐detection using a vibration sensor: an experimental analysis,” IET Signal Processing, Vol. 11, No. 4, pp. 396–405, Jun. 2017, https://doi.org/10.1049/iet-spr.2016.0113
-
W. Sawczuk and G. M. Szymański, “Diagnostics of the railway friction disc brake based on the analysis of the vibration signals in terms of resonant frequency,” Archive of Applied Mechanics, Vol. 87, No. 5, pp. 801–815, May 2017, https://doi.org/10.1007/s00419-016-1202-0
-
F. Dao, Y. Zeng, Y. Zou, X. Li, and J. Qian, “Acoustic vibration approach for detecting faults in hydroelectric units: a review,” Energies, Vol. 14, No. 23, p. 7840, Nov. 2021, https://doi.org/10.3390/en14237840
-
Y. Zheng, X. Chen, and R. Zhu, “Frequency hopping signal detection based on wavelet decomposition and Hilbert-Huang transform,” Modern Physics Letters B, Vol. 31, No. 19-21, p. 1740078, Jul. 2017, https://doi.org/10.1142/s0217984917400784
-
T. Hu, Y.-H. Lu, C.-G. Cheng, and X.-C. Sun, “Study on the early detection of gastric cancer based on discrete wavelet transformation feature extraction of FT-IR spectra combined with probability neural network,” Spectroscopy, Vol. 26, No. 3, pp. 155–165, 2011, https://doi.org/10.1155/2011/946783
About this article

Young and Middle-Aged Backbone Teachers of Henan Higher Vocational Colleges, No. 2019GZGG038.
2020 Henan Vocational Education Teaching Reform Research and Practice project. Based on “Teaching, Learning, Competition and Occupation” Vocational College Rail Transit Signal Control Professional Curriculum Reform, Key Project No. ZJA20114.
