Abstract
Due to the harsh working environment and various types of faults in mine hoists, the implementation of conventional detection is relatively difficult. In order to improve the maintenance and fault detection efficiency of mine hoist, a portable vibration detection system is designed and applied in this paper, which can judge the type and characteristics of mechanical faults according to the different responses of vibration signals. According to the test conditions of the vibration system, the overall structure and functional composition of the hardware system are established. The key functional modules are designed, including signal conditioning module, main control module, vibration sensor and power management module. The main reasons that affect and produce the hoist fault and mechanical vibration are analyzed. The wavelet packet analysis method is proposed to realize the decomposition of low frequency and high frequency signals to improve the signal resolution of the whole frequency band in the frequency domain. The vibration test system has the function of real-time data transmission and control. The realization methods include WiFi and reserved RS485 communication interface, which can match the communication rate with the data sampling rate. The amplifying circuit of the electric signal is designed to effectively ensure that the output voltage of the charge amplifier is within the input range of the amplified ADC value. In order to verify the working effect of the system, the most common gearbox and bearing failures are taken as examples. The response signals of vibration test and diagnosis can be effectively obtained, and the fault types and characteristics can be accurately judged. Through confusion matrix analysis, the reliability of the system detection index is effectively verified. The research results show that the data of the vibration detection system is stable and reliable, and can achieve good troubleshooting effect. It also can be known that different fault types can excite different vibration responses, especially at resonance frequencies. According to the verification, the data of the vibration detection system is stable and reliable, and can achieve good troubleshooting effect.
Highlights
- A portable vibration detection system is designed and applied, which can judge the type and characteristics of mechanical faults according to the different responses of vibration signals.
- The wavelet packet analysis method is proposed to realize the decomposition of low frequency and high frequency signals to improve the signal resolution of the whole frequency band in the frequency domain.
- The realization methods include WiFi and reserved RS485 communication interface, which can match the communication rate with the data sampling rate.
1. Introduction
With the development of mining technology [1], the development depth of the coal mine has exceeded 1500 meters. Therefore, the safety and reliability of mine hoist is one of the most important guarantees to ensure the safety of life and property. Vibration, as an important performance index in the fault diagnosis and testing of transmission system, can reflect the operation of the mechanism in the system to some extent, and can be used as the basis for the evaluation of mechanical operation quality [2], which has important reference value. However, traditional vibration testing equipment has many problems, such as large volume, complicated layout, and complex data transmission. In the case of small space of the measured point and inconvenient installation and disassembly of the testing device, the traditional vibration detection system cannot solve the functions such as work triggering and real-time data transmission [3], and the overall testing is insufficient [4]. At present, the vibration characteristic analysis and fault diagnosis of mine hoist are mainly based on human experience [5,6] or traditional fast Fourier transform [7] of the vibration signal directly to extract the main frequency components for analysis. Most coal mining enterprises adopt regular maintenance, which has no real-time effect. Therefore, the whole detection has obvious hysteresis and oneness, and cannot predict the fault in time. The vibration signal of mine hoist is a discrete signal with discontinuous noise, and the system response corresponding to each working condition is different. In different working conditions and operation stages, the vibration signals are obviously different. The main problems and difficulties in vibration signal processing and feature extraction include complex mechanical structures, multiple elastic elements, dense natural frequencies and disordered excitation factors, which increase the difficulty of vibration feature extraction [8, 9]. Representative studies on fault diagnosis techniques are as follows: Wang [10] proposed a vibration signal acquisition and computer simulation detection method for mechanical equipment faults. He adopted a mechanical equipment fault detection method based on wavelet domain Wiener filtering and established a mechanical equipment vibration signal acquisition model. This study obtained the error between the real signal and the filtered signal, solving the problem of optimizing the accuracy of mechanical equipment fault detection. Jia [11] proposed a mechanical vibration fault signal detection method based on Kalman filtering algorithm, analyzing the time-varying nonlinear oil film forces of mechanical equipment under different working conditions, obtaining the frequency and amplitude characteristics of mechanical vibration fault signals, and completing the detection of mechanical vibration fault signals. Shen [12] proposed a new method for detecting vibration faults in vehicle transmission gearboxes based on non-stationary signal time-frequency analysis, analyzing various components of the gearbox and obtaining the transmission path of vibration fault signals based on their structural characteristics. Gelman [13] attempts to apply instantaneous wavelet dual coherence technology to the detection of multiple natural local faults in early stages of gears, and evaluates the effectiveness of industrial related detection. Renáta [14] predicts the working state through vibration, detects pure harmonic sine waveform acceleration signals in the frequency subband, and performs cepstrum analysis.
Due to the low-frequency trend term in the vibration test signal, the original test signal often deviates from the reference line, and the unprocessed acceleration signal will accumulate large errors when extracting the velocity and displacement signals. In addition, the existence of high-frequency noise and low-frequency interference is difficult to focus on analysis. In order to solve the above problems, this paper designs a fault diagnosis system based on the portable real-time detection of vibration signals. In terms of hardware structure design, the system is divided into a host and a detection terminal based on the principle of functional modules. To ensure detection accuracy and reliability, functions such as weak charge signal conversion, voltage signal amplification, and filtering have been designed and optimized. The microcontroller is adopted in the host control scheme, ensuring the working conditions of various hardware through the design of the battery management system. The innovation of this study mainly includes: The filter circuit is designed to eliminate high-frequency noise, and the vibration signal can directly enter the A/D conversion module for analog-to-digital conversion after passing through the anti aliasing circuit, which can improve the detection accuracy and anti-interference ability of the signal; The signal processing and analysis methods of wavelet packets have been applied in detection and signal processing module, which further improves the accuracy of fault diagnosis and prediction. The application of this study can greatly reduce the maintenance time and cost of equipment, and has good economic benefits.
2. Design of vibration monitoring system
2.1. Function design of system hardware
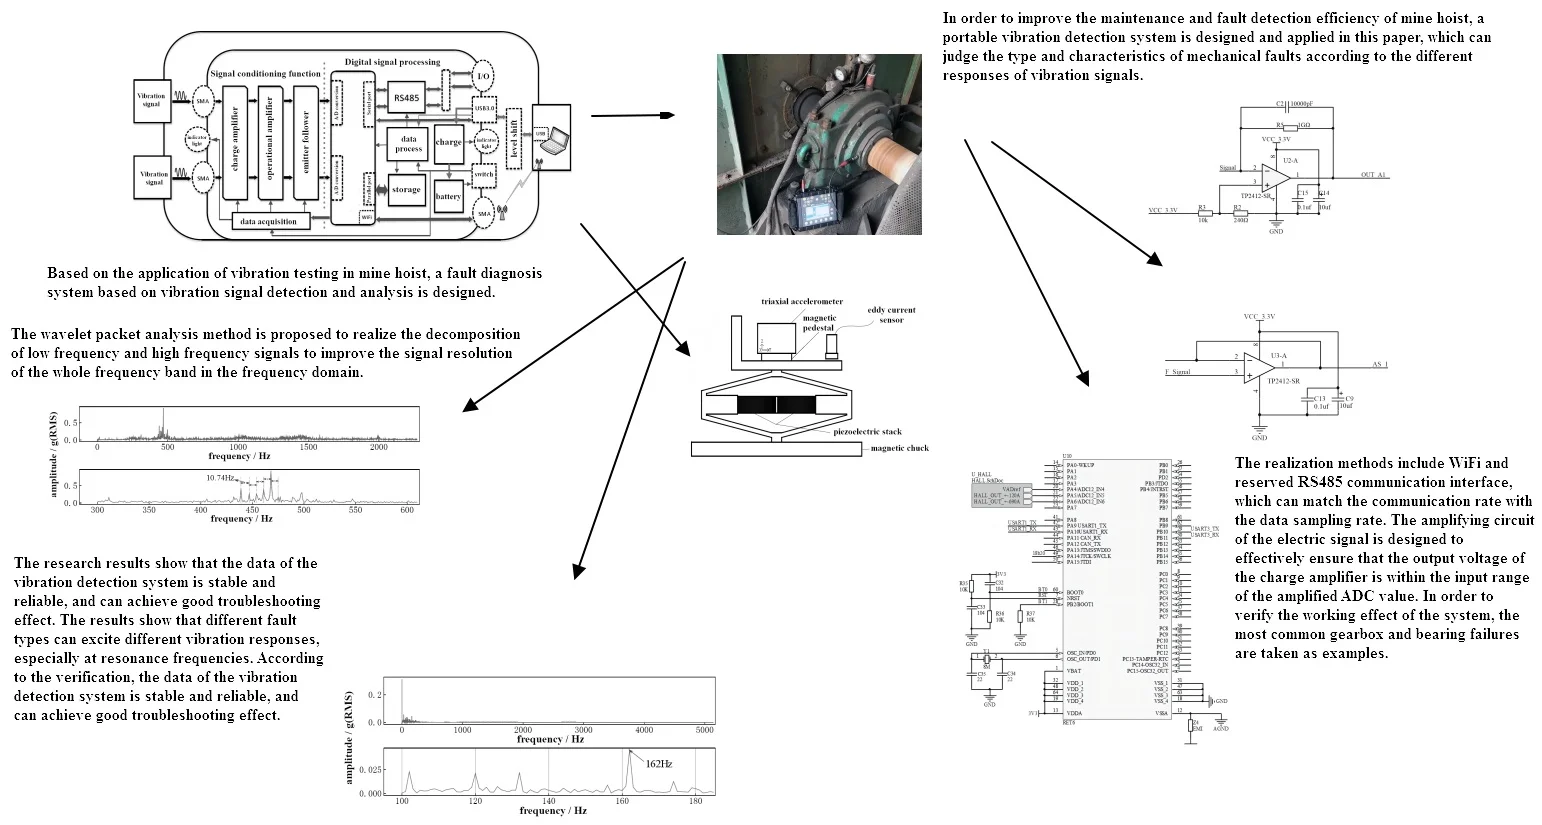
Based on the application of vibration testing in mine hoist, a fault diagnosis system based on vibration signal detection and analysis is designed, of which composition and principle is shown in Fig. 1. According to the testing conditions and requirements of the hoist, the design of hardware functions is summarized as follows:
(1) The vibration detection system can adjust the signals collected by the sensor, including the functions of baseline centering, weak charge signal conversion, voltage signal amplification, filtering, etc.
(2) The vibration detection system can complete analog digital conversion function and data recording function [15]. The sampling rate of the A/D conversion function shall match the rate of the data recording function, and shall be capable of continuous detection with sufficient storage capacity.
(3) In order to meet the wireless communication conditions of the mine, it is required that the vibration test system can complete data interaction with the information control platform through wireless WiFi. During real-time transmission, the communication rate shall match the data sampling rate [16]. The test system can be charged through USB interface (compatible with USB3.0 and USB2.0 interfaces), and the charging current is limited to 400 mA. In order to meet the requirements of special test environment, when wireless communication cannot be used, wiring can be used to ensure normal data transmission. Considering the difficulty of common communication protocols, RS485 communication interface is reserved.
Fig. 1Composition and principle of vibration detection system
2.2. Overall design of hardware functions
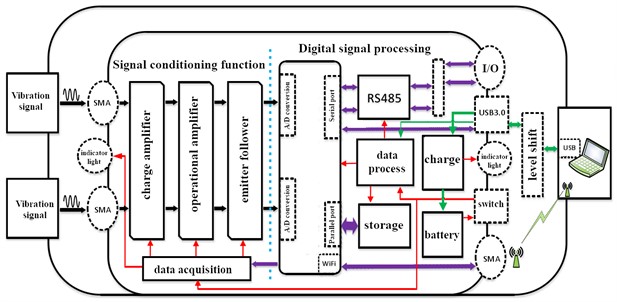
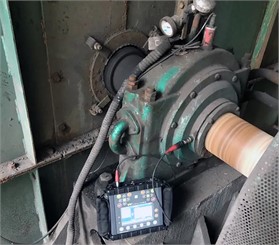
The vibration detection system mainly consists of sensor probe and control host, as shown in Fig. 2(a). The picture was taken by the author at a coal mining enterprise on December 2, 2022. For host, the hardware design of the vibration test system is mainly divided into three parts: signal conditioning circuit (analog circuit), digital circuit and level conversion module. The signal conditioning circuit mainly includes charge amplifier, operational amplifier, emitter follower and other modules. The digital circuit includes USB charging management, power conversion, main control logic unit, RS485 communication and storage modules. In addition, since the level conversion module is realized by digital logic, it is also divided into the digital circuit part. The vibration sensor mainly senses some characteristic quantities of the vibration signal, mainly including displacement, velocity, acceleration, force, etc., and then converts them into electricity in proportion to them. The specific values of physical quantities can be obtained through the detection and calculation of some instruments. According to the detection environment of the hoist, the piezoelectric acceleration sensor is selected and used as the sensor probe of this set of vibration detection system. Its principle is shown in Fig. 2(b). Piezoelectric acceleration sensor is a contact sensor based on piezoelectric effect. Generally, piezoelectric sensors are mainly made of piezoelectric materials. According to the positive piezoelectric effect, when a force in a certain direction is applied to them to deform them, charges will be generated on their surfaces. Through some circuit designs, the charge can be converted into voltage signal for easy acquisition and reading. Piezoelectric acceleration sensor is simple in structure, light in weight, less affected by temperature, and has the advantages of high frequency band, high sensitivity, high signal-to-noise ratio, etc.
Fig. 2The composition and functional principle of the system
a) Composition of vibration detection system
b) Structure composition of vibration sensor
2.3. Design of signal conditioning module
Piezoelectric acceleration sensor is a kind of sensor designed based on piezoelectric effect, and its output signal is analog charge. During the test, the equipment with analog to digital conversion function can only convert analog voltage. Therefore, during the design of signal conditioning circuit, the charge signal output by piezoelectric acceleration sensor is first converted into voltage signal. The function of this module is to convert the input charge into a proportional voltage output, which is mainly composed of an operational amplifier and a deep capacitance negative feedback network [17]. In addition, the corresponding baseline adjustment circuit is designed, which mainly uses resistance voltage divider to ensure the positive voltage after the conversion of the charge amplifier. In order to keep the signal undistorted and stable, an operational amplifier with appropriate gain bandwidth product parameters and high power supply voltage rejection ratio is applied. As the output charge of piezoelectric acceleration sensor is weak, in order to ensure the consistency of power supply, an operational amplifier with a power supply range of 3.3 V is selected. The schematic diagram of charge amplifier module is shown in Fig. 3, it can be seen that feedback capacitor C2, feedback resistor R5 and operational amplifier U2-A constitute a charge amplifier circuit, which is responsible for the conversion of charge amount to voltage amount. The voltage dividing circuit composed of resistor R3 and resistor R2 ensures that the output voltage signal of the charge amplifier is not distorted. C14 and C15 are used as filter capacitors to stabilize the working power supply of operational amplifier.
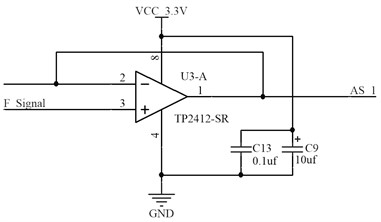
Considering the characteristics of the acceleration signal, in order to prevent its distortion, it is necessary to design a baseline adjustment circuit at the in-phase input end of the charge amplifier to provide a suitable bias for the converted acceleration signal. Since the input voltage range of the system microcontroller chip ADC is 0-1.46 V, the baseline voltage after amplification by the operational amplifier module is set as 730 mV. To ensure that the output voltage of the charge amplifier is within the input range of ADC value after amplification, the amplification factor of the amplification circuit is set to 9.5. When the hoist vibration test is carried out on site, a large number of high-frequency interference signals are usually coupled into the circuit through the acceleration sensor. If the high-frequency noise is stored after analog-to-digital conversion, it will cause distortion in data restoration. In order to avoid this phenomenon, it is necessary to design a filter circuit to eliminate the high-frequency noise. After passing through the anti aliasing circuit, the vibration signal can directly enter the A/D conversion module for analog digital conversion. However, in order to avoid the interference of the digital circuit to the output stage of the analog circuit in the later stage, the emitter follower module, as shown in Fig. 4, is added in the later stage of the anti aliasing circuit, which is mainly used to isolate the signal interference of the front stage and the rear stage, and also plays a role in reducing the output impedance and signal loss.
Fig. 3Schematic diagram of charge amplifier module
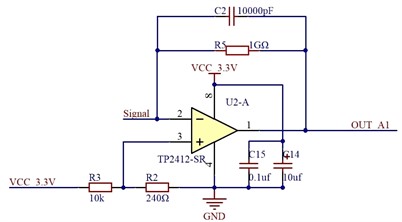
Fig. 4Schematic diagram of emitter follower module
2.4. Design of main control module
As the core of the whole vibration detection system, the main control logic unit is mainly used to coordinate the logic control among the functional modules. In order to ensure the stability of the system, STM32 microcontroller is used as the main control chip, of which the wiring circuit is shown in Fig. 5. The chip has strong expansion ability and can effectively realize WiFi, ADC and other functions. In order to prevent the main control chip from disordered working state after power on, a reset signal is usually sent to the main control chip externally at the moment of power on to clear the current state value of the internal registers of the chip. The function of the reset circuit is to generate an external reset signal. As the basis for updating the data and logic unit status in the master chip, the failure or damage of the clock frequency signal component in the clock circuit will directly lead to the abnormal operation of the entire system.
Fig. 5The wiring circuit of the main control module
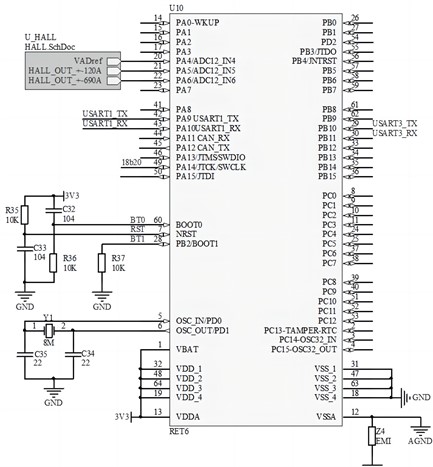
In this module, the master clock circuit and the real-time clock circuit are designed. The master clock circuit is composed of a 40 MHz passive crystal oscillator and a grounding capacitor. The clock frequency generated by the master clock circuit is mainly used to ensure the normal operation of the on-chip serial port, WiFi and other peripheral resources. In the design of the real-time clock circuit, in order to make full use of the I/O pin resource reuse function on the chip, 32.768 kHz active crystal oscillator is selected to generate the real-time clock frequency of the main control chip. The clock frequency is mainly used for internal control logic timing, data timestamp generation and other information. As the guarantee of wireless communication quality in the system, WiFi RF circuit is mainly used to convert data signals into electromagnetic waves and radiate them into space, so as to achieve the purpose of wireless data transmission. In this module, the design of WiFi RF circuit is mainly composed of 2.4 GHz band-pass filter, inductor, low-pass filter circuit and micro rod antenna. The cut-off frequency of the low-pass filter circuit is about 2.4 GHz, which is mainly used to filter the high-frequency components of RF signals. In the process of antenna design, considering the factors such as antenna signal strength and mechanical assembly, the omnidirectional ceramic patch antenna was abandoned and the SMA micro rod antenna with strong directivity and high radiation magnetic field strength was selected.
2.5. Design of vibration sensor
In the design process of the vibration sensor, not only the working environment but also the technical indicators should be considered. For example, some parameters such as measurement range and frequency response need to match with the research object. The measuring range of the designed sensor shall not exceed the maximum parameter value that the physical quantity to be measured may reach. The main technical indicators of the designed piezoelectric acceleration sensor are shown in Table 1. The vibration in x-axis direction refers to the vibration in horizontal plane, the vibration in -axis direction refers to the vibration perpendicular to the horizontal plane, and the vibration in -axis direction refers to the vibration perpendicular to the ground. The sensitivity parameters of the three directions are obtained from the calibration and measurement of the subsequent processing circuit module, which can be used as a reference for the vibration detection system. The working voltage and working current require the driving circuit to provide current and voltage that meet the conditions, so that the sensor can work normally. The function of DC bias voltage is to keep the AC output of the sensor at a positive value all the time, so that the circuit can be powered by a single power supply.
Table 1The main technical indicators of the designed vibration sensor
Technical indicators | Range | Working parameters | Range |
Test scope | ± 50 g | working voltage | 18-30 V |
Frequency in direction | 0-2000 Hz | working current | 2-20 mA |
Frequency in / direction | 0-5000 Hz | DC offset | 10 ± 2 V |
Resolution ratio | 0.1 g | output peak | > 5V |
Sensitivity in direction | 1000 mV/g | output impedance | < 100 Ω |
Sensitivity in direction | 1042 mV/g | ||
Sensitivity in direction | 1032 mV/g |
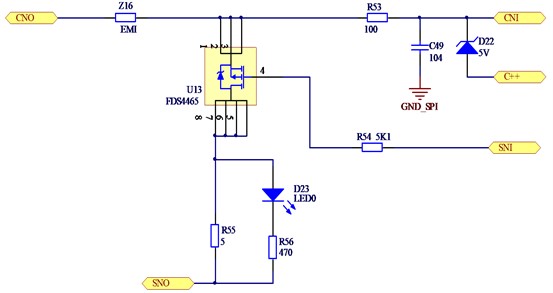
To ensure that the voltage deviation will not occur after the vibration sensor works for a long time, set the voltage equalization circuit as shown in Fig. 6. It can be seen that when the equalization module is working, the MOS components will switch to the closed state, and the resistance will consume a certain amount of power in the form of heating and cooling to achieve the effect of voltage equalization. FDS4465 is selected as the switching element in the equalization module. Its minimum grid drive voltage is 1.8 V, with high switching efficiency and good reliability. In addition, the equalization circuit is equipped with a voltage regulator to protect the chip state. The comprehensive use of high-resolution and low-resolution ADCs can effectively reduce power consumption and improve the performance price ratio of the system. However, with the decrease of ADC resolution, the performance loss is more significant, which is manifested as the decrease of transmission rate and spectral efficiency. If this problem occurs, the power increasing antenna can be added within a certain range to make up for the distortion of the signal and meet the optimization design requirements of the system.
Fig. 6The voltage equalization circuit of the vibration sensor
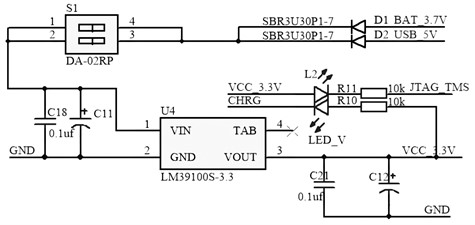
2.6. Design of power management module
As the power module of the digital part, the module mainly converts the lithium battery power supply or external USB power supply to the internal system power supply voltage through the LM39100S chip, of which wiring circuit is shown in Fig. 7. Its input pin voltage tolerance can reach 16 V, which can fully meet the power input of 3.7 V built-in lithium battery and 5 V external USB power supply. In the functional circuit design, in order to prevent current backflow, the module uses the diode forward conduction principle to block the power supply circuit of lithium battery and USB power supply in reverse to ensure that any power supply mode used in the power supply process will not affect other power supplies. In the overall architecture design of the system, rechargeable lithium batteries with small volume and large capacity are selected to power the system. Considering PCB space, cost and other factors, the USB3.0 interface connector is directly used instead of a dedicated DC connector port, which is convenient and efficient in design and use. The charging state of lithium battery is controlled by the charging management chip TP4055. The chip can directly charge the lithium battery from the USB port, its soft start function can effectively limit the surge current, and has the characteristics of small size and few peripheral components, which can effectively reduce the use area in PCB design.
Fig. 7Wiring circuit of LM39100S chip
3. Vibration characteristics and fault types of mine hoists
3.1. Analysis of fault inducement
Excessive amplitude of mine hoist will cause obvious harm to the conveying process. When the vibration is severe, it will also cause great interference to the work of the transmission equipment, reducing the service life. According to the working principle and environment of the hoist, some factors that have the greatest impact on vibration are summarized, mainly including:
(1) The bearing ball is damaged and the friction is too large.
(2) Unreasonable speed setting during startup or braking, resulting in excessive impact.
(3) The gears are worn and the meshing deviation is large.
(4) Uneven stress of wire rope leads to excessive tension deviation.
(5) Wear and corrosion caused by high-frequency use or improper use of core components.
As a complete set of mine hoist is composed of electromechanical control structure, other installation components and shafts, the establishment of the hoisting system is complex. In the actual detection process, the mechanical failure of the vertical hoist is not only caused by a single element, but also the result of a variety of factors, which is the main reason for the increase in the difficulty coefficient of troubleshooting. Due to the complex working conditions during operation, even under normal working conditions, the vibration characteristics will change with the aging of components and the degradation of components. However, previous experience is insufficient to analyze the failure. At the same time, the linkage effect caused by different input parameters of the electronic control system is uncertain. Therefore, when measuring the hoist acceleration, the measurement system can not only detect whether the operation time domain index exceeds the threshold, but also find the vibration source and predict the fault. According to the engineering maintenance experience, bearing and gear failures are the most common and frequent failures of the hoist, which need to focus on detection.
3.2. Analysis scheme of vibration signal
The pre processed vibration signal [18] only eliminates the error in the conversion between the instrument and the indicator, and the signal characteristics contained in the signal section cannot be seen. For the complex system of mine hoist, the common signal analysis method is difficult to capture the fault information contained in the non-stationary signal, and then the wavelet packet analysis method is proposed to analyze the signal. There are three common methods for analyzing signals: time domain analysis, frequency domain analysis and time-frequency domain analysis. The three kinds of methods are different in object orientation and function, and they often need joint analysis when analyzing signals. Wavelet packet analysis is an extension of wavelet analysis [19, 20]. This is a more refined analysis method, which aims to solve the problem that wavelet analysis only decomposes the low-frequency part. That is to say, it can not only decompose the low-frequency part, but also the high-frequency part, so as to realize the decomposition of the entire frequency band. Based on the characteristics of the signal itself, wavelet packet analysis makes the spectrum adaptively match the frequency band, so as to improve the signal resolution of the entire frequency band in the frequency domain, and can also process nonlinear and non-stationary signals. As shown in Fig. 8, signal is decomposed into 4-layer wavelet packets. represents the original signal, , , ..., represent the scale number of decomposition respectively, and finally 16 bands can be obtained.
Fig. 8Principle of signal separation
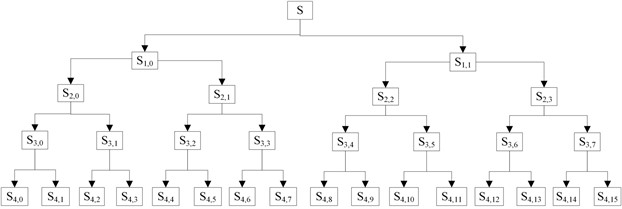
The essence of wavelet packet analysis is multi-resolution analysis. Its basic idea is to use orthogonal decomposition to project function space to subspace layer by layer. By extending the signal to different scales, the subdivision of each layer can obtain the characteristic information of each band on the basis of retaining the original time-domain characteristics of the signal. In signal processing, in order to obtain effective information in certain specific frequency bands of vibration signals, the frequency bands obtained by wavelet packet decomposition can be screened. Select a useful frequency band to reconstruct the selected frequency band, which is also called wavelet packet reconstruction.
4. Analysis and comparison of main faults
4.1. Detection and analysis of gearbox faults
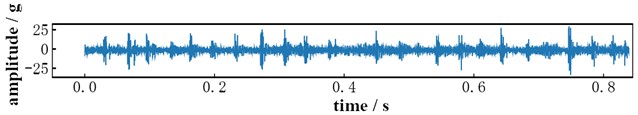
When the vibration sensor is installed at the output position of the high-speed shaft of the gearbox, the vibration response results of the big gear and the small gear can be considered at the same time. The vibration signal is collected at 817-880 r/min, and each state contains 53248 points, that is, the collection time of each segment is 0.8-1s. The data is divided into 5200 points according to the sampling frequency, that is, the resolution of frequency domain analysis is 1 Hz/point. When the gear pair is normally engaged and there is no obvious wear fault, the vibration detection results can be obtained, as shown in Fig. 9. The vibration response of the normal gearbox should have a signal speed of 880 r/min and a maximum time domain amplitude of about 10 g. It also can be seen that the peak value of its FFT transformed frequency appears at 468 Hz, which is caused by the natural vibration of the gear and is the natural frequency of the gear. In addition, if there is no meshing frequency at 806 Hz, it is judged as a normal gearbox vibration signal.
Fig. 9Vibration response of normal gearbox
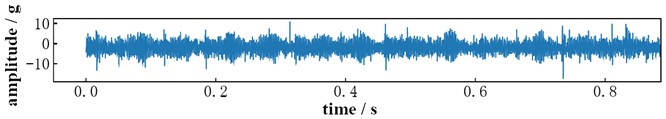
a) Time domain test results
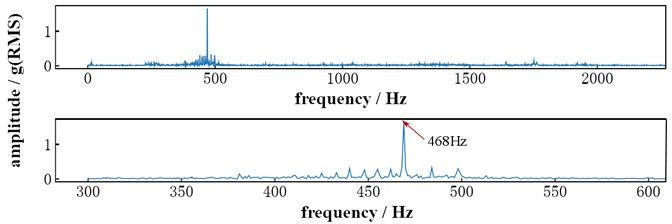
b) Spectrum analysis results
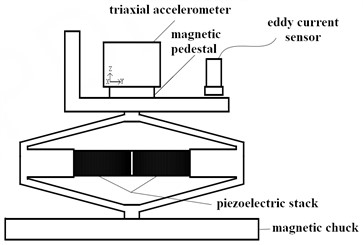
Vibration response with driving gear wear fault is shown in Fig. 10. It can be seen that the maximum amplitude in time domain is about 25 g, and obvious periodic impact can be observed. The frequency spectrum characteristics can be obtained through FFT transformation, and the peak value appears at 468 Hz, which is caused by the natural vibration of the gear, and resonance occurs at the natural frequency. In addition, if there is a peak value of meshing frequency and 0.25 g (RMS, Root Mean Square) at 806 Hz, and there is a modulation frequency of 14.7 Hz of pinion rotation frequency around the meshing frequency, it is judged as the vibration signal of driving gear wear. Vibration response with driven gear wear fault is shown in Fig. 11. It can be seen that the maximum amplitude in time domain is about 25 g, and obvious periodic impact can be observed. Similarly, the frequency spectrum characteristic can be obtained after FFT transformation of the time domain characteristic, and the peak value appears at 468 Hz. In addition, a modulation frequency of 10.74 Hz occurs near this natural frequency. Then it can be judged as the vibration signal of driving gear wear fault.
Fig. 10Vibration response with driving gear wear fault
a) Time domain test results
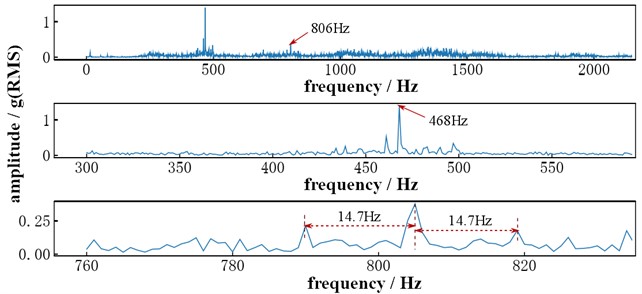
b) Spectrum analysis results
Fig. 11Vibration response with driven gear wear fault
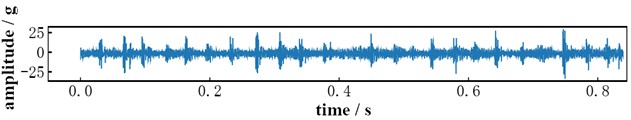
a) Time domain test results
b) Spectrum analysis results
4.2. Detection and analysis of bear faults
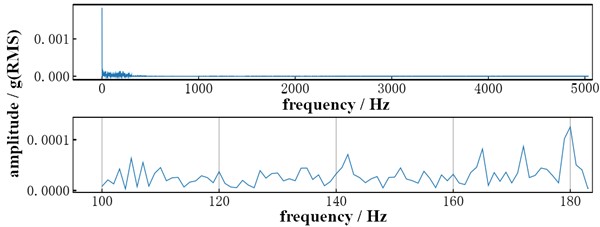
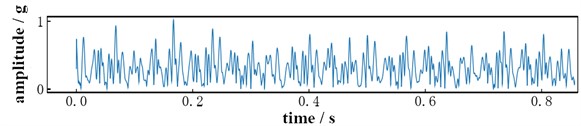
The vibration sensor is installed on the bearing seat surface of the motor output shaft, because the bearing at this position is more prone to wear failure. The sampling frequency is set to 12000 Hz, and the signal needs to be segmented before wavelet packet analysis and processing. In order to ensure that the resolution of the signal envelope spectrum can be used for manual fault analysis, the signal is sampled into a group of 12000 sampling points according to the sampling frequency, that is, the resolution of the envelope spectrum obtained through wavelet packet analysis is 1 Hz/point. Under the normal bearing vibration signal shown in Fig. 12, its time domain amplitude does not exceed 0.25, envelope spectrum amplitude does not exceed 0.0 002, and there is no fault natural frequency, so it can be judged as normal. As shown in Fig. 13, the maximum amplitude in the time domain is more than 2.5, and the natural frequency of the inner ring fault is known to be 162.18 Hz. There is a peak frequency of 162 Hz in the partial envelope spectrum, so it can be determined as the bearing inner ring fault.
Fig. 12Vibration response of normal bear
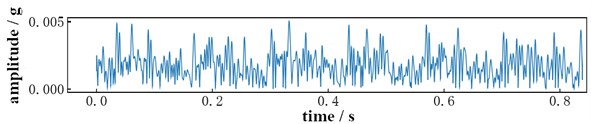
a) Time domain test results
b) Spectrum analysis results
Fig. 13Vibration response with wear failure of bearing inner race
a) Time domain test results
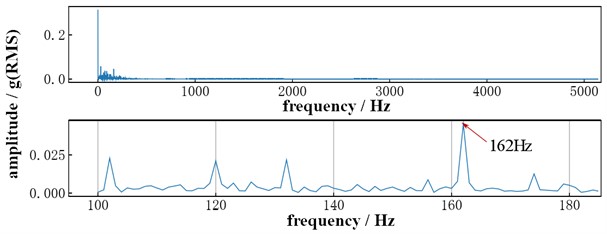
b) Spectrum analysis results
4.3. Evaluation index of confusion matrix
Confusion matrix, also known as error matrix, is a standard format for precision evaluation, which is expressed in matrix form. According to the common type of gear fault, 20 sets of normal gear pairs and 20 sets of worn gear pairs are compared and analyzed, and the confusion matrix is obtained as shown in Table 2.
Table 2Confusion matrix for gear fault prediction
Fault prediction | Normal | 20 50 % | 1 2.5 % | 95.2 % 4.8 % |
Wear fault | 0 0 % | 19 47.5 % | 100 % 0 % | |
100 % 0 % | 95 % 5 % | 97.5 % 2.5 % | ||
Normal | Vear fault | |||
Actual type | ||||
In order to verify the effectiveness of fault prediction, the accuracy A, precision B, sensitivity C, and harmonic mean P were calculated respectively, and the results are shown in Table 3. It can be seen that the accuracy and reliability of the fault prediction are high, and it has a good judgment effect on the wear fault of the mine hoist gear.
Table 3Calculation results of predictive indicators
A | P | S | F |
0.975 | 0.976 | 0.975 | 0.974 |
Using the same research method, 20 groups of bearings with normal operation and 20 groups of wear failure were compared and analyzed, and the confusion matrix was obtained as shown in Table 4. Due to the fact that the bearings of the hoist are regularly replaced parts, there is no need to distinguish the specific type of fault. The accuracy A, precision B, sensitivity C, and harmonic mean P were calculated respectively, and the results are shown in Table 5. It can be seen that the accuracy and reliability of the bear fault prediction are also high.
Table 4Confusion matrix for gear fault prediction
Fault prediction | Normal | 19 50 % | 2 2.5 % | 90.5 % 9.5 % |
Wear fault | 1 0 % | 18 47.5 % | 94.7 % 5.3 % | |
95 % 5 % | 90 % 10 % | 92.5 % 7.5 % | ||
Normal | Vear fault | |||
Actual type | ||||
Table 5Calculation results of predictive indicators
A | P | S | F |
0.925 | 0.926 | 0.925 | 0.925 |
5. Conclusions
The detection of vibration signal is very convenient and fast, which can effectively determine different types of mechanical failures, and can play an important role in the maintenance and repair of mine hoists. According to the working conditions and functional characteristics of mine hoist, a portable vibration detection system is designed and applied in this paper. The main conclusions are as follows:
1) According to the special requirements of coal mine detection, the vibration test system can complete the real-time interaction of data with the information control platform through WiFi. At the same time, RS485 communication interface is reserved, which can not only match the communication rate with the data sampling rate, but also ensure that when wireless communication cannot be used, wiring can be used to ensure normal data transmission.
2) After the sensor is driven by an appropriate power supply, in theory, the vibration sensor can output an electrical signal proportional to the quantity to be measured. However, in most cases, the electrical signal output only through the sensor is generally very weak, which is not easy to measure with the instrument on the one hand, and has a great impact on the accuracy of the measurement results on the other hand. Therefore, the electrical signal output by the sensor is amplified by an amplification circuit, and a reasonable amplification factor is set so that the amplified output signal is within the range of easy detection and will not affect the true value. For example, the amplification factor of the amplification circuit is set to 9.5 in the vibration test system, which can effectively ensure that the output voltage of the charge amplifier is within the input range of the amplified ADC value.
3) The vibration response of different fault types is obviously different, and because the natural frequencies of each part are different, the vibration signal can be identified more easily. At the same time, with the deepening of the fault, its time domain amplitude is also increasing and more obvious. Therefore, it is easy to judge different damage degrees in the same fault type according to the time domain amplitude. Through low-pass filtering and fast Fourier transform, the natural frequency of mechanical fault can be clearly reflected, which is convenient for further judging the fault state of the signal.
References
-
T. Zhigang, Z. Chun, H. Manchao, and L. Kuiming, “Research on the safe mining depth of anti-dip bedding slope in Changshanhao Mine,” Geomechanics and Geophysics for Geo-Energy and Geo-Resources, Vol. 6, No. 2, pp. 1–20, Jun. 2020, https://doi.org/10.1007/s40948-020-00159-9
-
J. Kalpana, P. S. Rao, and P. G. Rao, “Mechanical properties enhancement in dissimilar weldments fabricated under vibratory weld conditioning,” Advanced Science, Engineering and Medicine, Vol. 9, No. 6, pp. 493–498, Jun. 2017, https://doi.org/10.1166/asem.2017.2026
-
M. H. M. Ghazali and W. Rahiman, “An investigation of the reliability of different types of sensors in the real-time vibration-based anomaly inspection in drone,” Sensors, Vol. 22, No. 16, p. 6015, Aug. 2022, https://doi.org/10.3390/s22166015
-
A. P. Bovsunovsky, “Efficiency of crack detection based on damping characteristics,” Engineering Fracture Mechanics, Vol. 214, No. 1, pp. 464–473, 2019, https://doi.org/10.1016/j.engfracmech
-
V. Sharma and P. Kundu, “Minimization of the vestigial noise problem of empirical wavelet transform to detect bearing faults under time-varying speeds,” The International Journal of Advanced Manufacturing Technology, Vol. 123, No. 7-8, pp. 2623–2641, Dec. 2022, https://doi.org/10.1007/s00170-022-10320-1
-
R. Bouhali, K. Tadjine, H. Bendjama, and M. N. Saadi, “Fault diagnosis of bladed disc using wavelet transform and ensemble empirical mode decomposition,” Australian Journal of Mechanical Engineering, Vol. 18, No. sup1, pp. S165–S175, Jul. 2020, https://doi.org/10.1080/14484846.2018.1499471
-
B. D. Kshirsagar, S. C. Goud, and S. N. Khan, “Vibration analysis of femur bone by using consistent mass matrices and fast fourier transform analyzer,” Materials Today: Proceedings, Vol. 26, No. 2, pp. 2254–2259, 2020, https://doi.org/10.1016/j.matpr.2020.02.489
-
L. Cai, D. Hu, C. Zhang, S. Yu, and J. Xie, “Tool vibration feature extraction method based on SSA-VMD and SVM,” Arabian Journal for Science and Engineering, Vol. 47, No. 12, pp. 15429–15439, Dec. 2022, https://doi.org/10.1007/s13369-022-06635-6
-
H. Li, T. Bao, C. Gu, and B. Chen, “Vibration feature extraction based on the improved variational mode decomposition and singular spectrum analysis combination algorithm,” Advances in Structural Engineering, Vol. 22, No. 7, pp. 1519–1530, May 2019, https://doi.org/10.1177/1369433218818921
-
Y. Wang, V. Jagota, M. E. Makhatha, and P. Kumar, “Vibration signal acquisition and computer simulation detection of mechanical equipment failure,” Nonlinear Engineering, Vol. 11, No. 1, pp. 207–214, Jun. 2022, https://doi.org/10.1515/nleng-2022-0026
-
Y. Jia and Y. Hu, “Research on fault signal detection method of mechanical vibration based on Kalman filtering algorithm,” International Journal of Information and Communication Technology, Vol. 1, No. 1, pp. 272–289, 2022, https://doi.org/10.1504/ijict.2022.10044157
-
Y. Huang, Z. Shen, Q. Xie, and F. Jiang, “Vibration fault detection of vehicle transmission gearbox based on time-frequency analysis of non-stationary signals,” International Journal of Vehicle Design, Vol. 89, No. 1/2, p. 145, 2022, https://doi.org/10.1504/ijvd.2022.10053063
-
L. Gelman, K. Soliński, and A. Ball, “Novel instantaneous wavelet bicoherence for vibration fault detection in gear systems,” Energies, Vol. 14, No. 20, p. 6811, Oct. 2021, https://doi.org/10.3390/en14206811
-
R. Pidl, “Application of a Novel Methodology for the Detection of Harmonic Vibration in the Acceleration-Time Functions of Vehicle Platforms,” Strojnícky časopis – Journal of Mechanical Engineering, Vol. 72, No. 2, pp. 139–148, Nov. 2022, https://doi.org/10.2478/scjme-2022-0024
-
T. H. Khan and K. A. Wahid, “An advanced physiological data logger for medical imaging applications,” EURASIP Journal on Embedded Systems, Vol. 2012, No. 1, pp. 1–14, Dec. 2012, https://doi.org/10.1186/1687-3963-2012-10
-
J. Huchtkoetter and A. Reinhardt, “A study on the impact of data sampling rates on load signature event detection,” Energy Informatics, Vol. 2, No. S1, pp. 1–12, Sep. 2019, https://doi.org/10.1186/s42162-019-0096-9
-
E. L. Pankratov, “On optimization of manufacturing of an operational amplifier with common-mode feedback based on heterostructures to increase density of their elements. influence of miss-match induced stress and porosity of materials on technological process,” Advanced Science, Engineering and Medicine, Vol. 11, No. 3, pp. 229–246, Mar. 2019, https://doi.org/10.1166/asem.2019.2280
-
C. Gnanaprakasam and K. Chitra, “S-transform and ANFIS for detecting and classifying the vibration signals of induction motor,” Journal of Intelligent and Fuzzy Systems, Vol. 29, No. 5, pp. 2073–2085, Aug. 2015, https://doi.org/10.3233/ifs-151684
-
Yao Fei, C. Yimin, and C. Guangyu, “Wavelet packet analysis of shotcrete-rock structures using the impact-echo method,” Russian Journal of Nondestructive Testing, Vol. 57, No. 1, pp. 43–54, Jan. 2021, https://doi.org/10.1134/s106183092101006x
-
K. Wang, G. Su, L. Liu, and S. Wang, “Wavelet packet analysis for speaker-independent emotion recognition,” Neurocomputing, Vol. 398, No. 1, pp. 257–264, Jul. 2020, https://doi.org/10.1016/j.neucom.2020.02.085
Cited by
About this article

The paper is supported by provincial scientific research projects (62874136).
The datasets generated during and/or analyzed during the current study are available from the corresponding author on reasonable request.
Yonghong Fan: Investigation, Methodology, Supervision, Validation. Jinyan Zhang: Writing – Original Draft Preparation, Conceptualization. Daoping Han: Writing – Review and Editing, Investigation, Methodology, Project Administration
The authors declare that they have no conflict of interest.
