Abstract
Judging the working status of a gearbox through the characteristics of vibration signals was an effective fault diagnosis method. In order to improve the efficiency and reliability of vibration detection, a multi node testing system based on a microcontroller was designed and validated. The system mainly consists of signal processing equipment, signal collector, upper computer, sensors, and experimental workbench. Under different types of gear faults, the vibration signals of ten sets of gearboxes were synchronously collected and processed. In order to ensure the resolution of frequency conversion and accurately locate frequency conversion, the low-pass filtered spectrum with a filtering frequency of 1000 was verified and used to calculate the amplitude of frequency conversion. The normalization of amplitude was more conducive to feature recognition, and the frequency amplitude was proportional to its corresponding energy. According to standard spectral data and spectral analysis, wear, pitting, fracture, and bonding faults in the gearbox were identified and classified. Through the verification of three order feature spectrum, it can be seen that the accuracy of fault prediction for gearbox through vibration signals is high, which can effectively reduce maintenance and repair costs.
Highlights
- In order to improve the efficiency and reliability of vibration detection, a multi node testing system based on a microcontroller was designed and validated.
- Under different types of gear faults, the vibration signals of ten sets of gearboxes were synchronously collected and processed.
- In order to ensure the resolution of frequency conversion and accurately locate frequency conversion, the low-pass filtered spectrum with a filtering frequency of 1000 was verified and used to calculate the amplitude of frequency conversion.
1. Introduction
Gearbox is one of the most important transmission equipment, widely used in transportation, industrial production, aerospace and other fields. Fault detection based on vibration signals has gradually become the main testing method in gear transmission. The spectrum feature diagnosis of vibration is a current research hotspot, suitable for active vibration control of equipment such as gears in operation, which requires real-time detection and analysis of vibration signals [1, 2]. At present, with the rapid development of large-scale integrated circuit technology, the development of modern signal processing technology and applications is very rapid [3, 4]. With the promotion of emerging technologies and processes, and the continuous reduction of production costs and volume, the computing speed and storage capacity of large-scale integrated circuits are rapidly improving. On the basis of sufficient hardware resources, digital signal processing technology has also been increasingly widely applied [5]. In order to further improve the detection efficiency and evaluation effect of gearbox vibration characteristics, this paper designs a vibration detection system with stable performance and practical application, based on the application of mature and widely used and validated digital signal processing technologies. It has important guiding significance for the detection of different faults of gear wheels.
2. Overall design of vibration testing system
2.1. Functional design
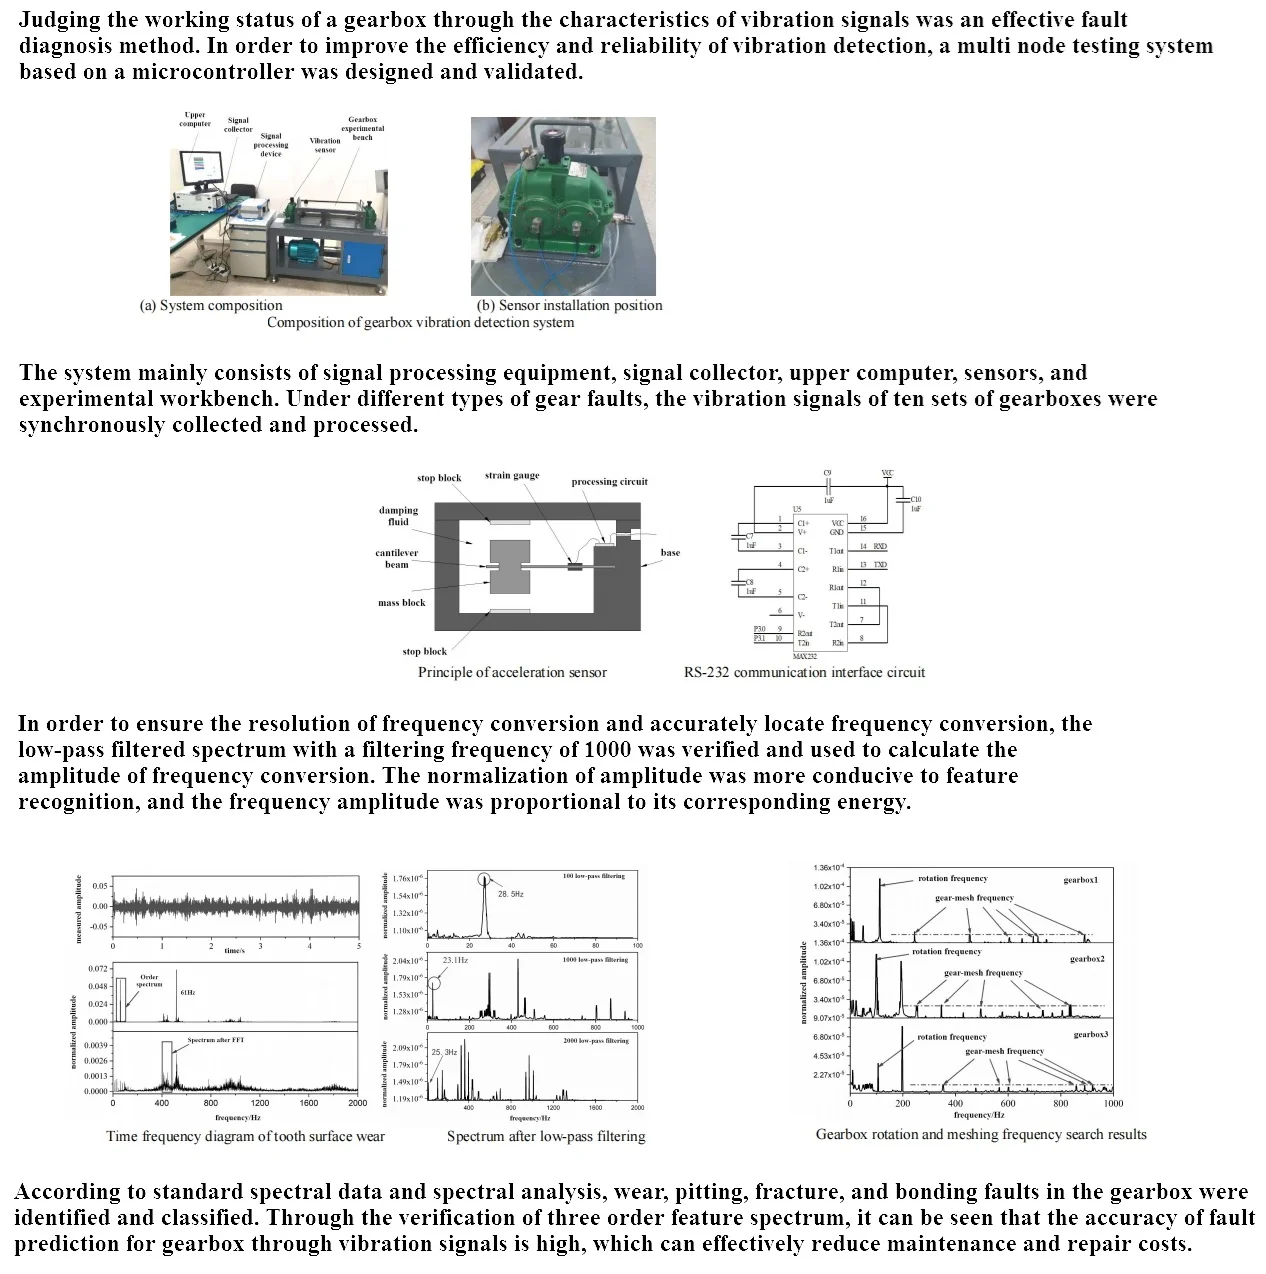
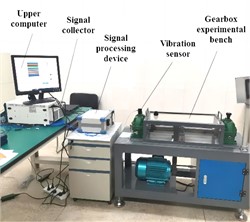
For vibration monitoring of gearboxes, high-precision kinematic parameters need to be directly collected. If batch testing is conducted on the vibration characteristics of gearboxes, relatively large bandwidth data can be applied in cloud platforms for real-time communication and monitoring to improve detection efficiency [6, 7]. The accuracy and speed of signal processing are the most crucial parts of a vibration monitoring system, and the operational efficiency of the signal processing system determines the response time and accuracy. In addition to effective signals, the signals fed back by the external environment of the gearbox are also accompanied by a large number of interference signals and environmental noise [8]. Signal processing algorithms play a crucial role and are a crucial part. The core detection unit of the vibration monitoring system is the acceleration sensor. Due to its low energy consumption and accurate measurement data, combined with the use of control systems, simple calculations can obtain kinematic basic data such as velocity direction, velocity magnitude, and acceleration magnitude. In terms of data communication, long-distance data transmission can be achieved, including wired transmission and wireless transmission. According to system requirements, data transmission function can be used to remotely adjust data [9]. The overall structure design of the system hardware is shown in Fig. 1(a), including signal processing equipment, signal collector, upper computer, sensors, and experimental workbench. For gearbox structures, vibration characteristics, including forced vibration, natural vibration, and harmonic vibration, are one of the most important structural characteristics. The selected sensor needs to be able to accurately and effectively collect structural vibration parameters. At present, the most commonly used vibration sensors in industrial sites include displacement sensors, velocity sensors, and acceleration sensors. Due to the ease with which acceleration can be calculated using integral algorithms for velocity and displacement information of structures, acceleration sensors are currently the most widely used type of vibration measurement sensor. From the perspective of vibration frequency, a gearbox is a low-frequency structure that has low-frequency limitations on the selected acceleration sensor. In addition, due to objective conditions, the number of sensors applied to the structure is limited, and a limited number of sensors need to be arranged to achieve optimal collection of structural parameters. This involves optimizing the sensor layout. To ensure convenient layout, sensors should be minimized and portable as much as possible, as shown in Fig. 1(b).
Fig. 1Composition of gearbox vibration detection system
a) System composition
b) Sensor installation position
2.2. Main hardware design
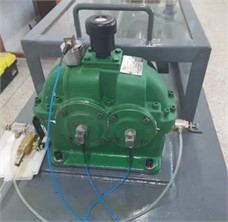
The acceleration sensor is the foundation of the entire vibration detection system, and the principle of the acceleration sensor is shown in Fig. 2. If the sensor cannot meet the needs of data collection, subsequent data processing will also be meaningless. Considering high-frequency vibration factors, it is appropriate to set the vibration range to be detected at around 2-200 Hz. To ensure effective detection of high-frequency vibrations and to consider low-frequency signals, the core frequency signal is not distorted. According to Nyquist's sampling law, the sampling frequency should be at least twice the frequency of the highest collected signal. For safety reasons, by sampling at a frequency of 4 times the sampled signal, the redundancy is doubled to at least 1000 Hz. If significant errors occur during the data collection process and the timeliness is not strong, subsequent experiments and data processing will also lose significance. The main function of this sensor node is to complete real-time collection and data fusion processing of lateral, longitudinal, and vertical vibration accelerations at different positions, and encapsulate the processed data, which is then transmitted to the upper computer for later analysis and processing [10].
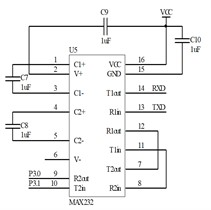
In industrial testing, integrated management is generally adopted to improve the testing efficiency of gearboxes. For different vibration testing nodes, the transmission module plays a bridging role, therefore requiring the module to have a bus structure that is easy to communicate, strong anti-interference ability, stable communication ability, and considerable communication distance. According to the design requirements, simple calculations can be performed, where each sensor needs to send at least 256 spectral feature points at once. If transmitted as a double precision floating-point number, the transmission capacity of a single data packet is at least 2k bytes, while the maximum number of design nodes is 16. To ensure that the data transmission of each node does not overlap or interfere with each other, based on dual time redundancy calculation, as long as the transmission rate reaches 128 kb/s, it can meet the design requirements. In terms of transmission distance, it is only necessary to ensure stable signal transmission within a range of 10 meters. Based on the above two points and the analysis of the networking mode, this design selects Zigbee technology that meets the IEEE 802.15.4 technical standard as the foundation of the network design. Under the guidance of this technical standard, CC2530 communication chip is selected as the core communication chip. In the communication module, the input and control of instructions are mainly achieved through the standard RS-232 interface, as shown in Fig. 3, which can achieve efficient data transmission.
Fig. 2Principle of acceleration sensor
Fig. 3RS-232 communication interface circuit
2.3. Testing precautions
In addition to realizing the detection and processing functions of vibration signals, the vibration monitoring system should also focus on completing protection functions. Therefore, it is necessary to design alarm states through software control schemes. After the system runs, the vibration monitoring system begins to monitor vibration parameters and make early warning judgments. The main content of early warning includes amplitude, frequency, speed, etc. The system will trigger a warning window and issue an audio warning through program control. The system sets communication port and baud rate, stop bit length and other parameter information on the communication port, controls the shutdown characteristics of the serial port, and processes and displays measurement data charts or curves through the report management module. In a single monitoring of vibration data collection, there is no regular pattern of random errors. However, when there are more monitoring times, the errors in the data will be distributed according to a normal pattern. Therefore, the more detection times the signal parameters undergo during the adoption period, the easier it is to handle and eliminate random errors. Generally speaking, the most common method to eliminate random errors is the arithmetic average method, which is called arithmetic average filtering. The number of times used can directly determine the smoothness of the method's interference signal processing. The more sampling times, the more interference signals can be filtered out, but it can easily lead to a decrease in system sensitivity. Therefore, under actual working conditions, it is necessary to comprehensively consider two factors and select appropriate sampling times to ensure that good filtering results can be achieved with as few sampling times as possible.
3. Feature extraction and recognition of vibration signals
3.1. Test condition settings
Common faults in gearboxes include tooth surface wear, tooth surface fatigue pitting, tooth root cracks, and missing teeth The vibration data of the gearbox in healthy state, worn tooth surface state, fatigue pitting tooth surface state, cracked tooth root state, and missing tooth state were tested separately. The sampling frequency is set to 2000 Hz, the collection time is set to 5 s, and the sampling time is 5 times, which constitutes the original dataset of vibration signals for this gearbox. In response to the empirical issues existing in the original EMD algorithm, the EEMD algorithm was adopted by the system by adding auxiliary noise during EMD decomposition. This method is based on the uniform distribution of white noise in the time-frequency domain space, and uses a two-dimensional reference frame to average the original algorithm signal set. To improve the problem of modal aliasing, signal components at different time scales are adaptively mapped to corresponding IMF components. This algorithm can adaptively determine the decomposition levels and input vectors of the IMF, input all useful features that can be used for fault diagnosis into the algorithm, and use the algorithm's adaptive ability to filter the input features. During this decomposition process, due to the overshoot or undershoot problem caused by the upper and lower envelope lines, and the accumulation of calculation errors, it will directly affect the decomposition accuracy of the EMD algorithm. The separated feature signals are more recognizable and can serve as important indicators for evaluating the degree of wear.
3.2. Determination of fault signals
The vibration signal under the condition of tooth surface wear is shown in Fig. 4. It can be seen that there is no specific pattern in the variation of vibration amplitude over time, making it difficult to detect characteristic signals from the time domain diagram. However, it is not difficult to find several frequencies with higher energy from the amplitude frequency map directly undergoing Fast Fourier Transform, but at the same time, the peak energy is dispersed in the spectrum, resulting in the phenomenon of spectral line blurring. After order tracking, the spectral line blurring caused by unstable speed was eliminated, and the order spectral lines of each rotating component can be clearly seen. Low pass filtering can filter out high-frequency signals while retaining low-frequency signals. Normalization of the amplitude is more conducive to discrimination, and the frequency amplitude is proportional to its corresponding energy.
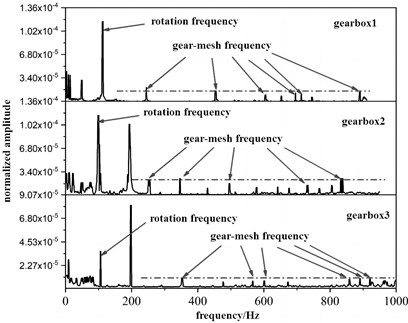
After searching and filtering the vibration signal under the fatigue pitting state of the tooth surface, the results are shown in Fig. 5. Filtering frequencies of 2000, 1000, and 100 were used for low-pass filtering. The position of the rotation frequency can be clearly seen in the figure, because in the gearbox, the input shaft of the gearbox is taken as a reference, and its rotation frequency has the characteristic of high energy. The average rotation frequency corresponds to a frequency of 25.2 Hz, which is converted to a speed of 1512 rpm, which is very close to the actual measured stable speed of the high-speed shaft (1475 rpm). When the filtering frequency is 2000, there is a large amount of data and the calculation time is the longest, but the frequency it finds is 25.3 Hz, which is closest to the actual speed (24.583 Hz). When the filtering frequency is 1000, the calculation time is shorter, and the found rotation frequency is 23.1 Hz, which is closer to the actual speed (24.583 Hz). When the filtering frequency is 100, the calculation time is the shortest, but the difference between the found rotation frequency of 28.5 Hz and the actual speed (24.583 Hz) is significant. Therefore, in order to ensure the resolution of frequency conversion and accurately locate the frequency conversion, it is considered to use the frequency spectrum after low-pass filtering with a filtering frequency of 1000 to calculate the amplitude of frequency conversion. Using the vibration signal under the condition of tooth surface fatigue pitting, the characteristic frequencies (meshing frequency and dual frequency respectively) of three gear boxes with different transmission ratios under this condition can be found, as shown in Fig. 6. When taking the meshing frequency as the characteristic frequency, the meshing frequency corresponding to different gearboxes is not completely the same. This is because the meshing frequency is related to the number of teeth in the gearbox gear and the rotational frequency of the input shaft. When the rotational frequency remains constant, the meshing frequency will change due to changes in the transmission ratio and gear material of the gearbox gears.
Fig. 4Time frequency diagram of tooth surface wear
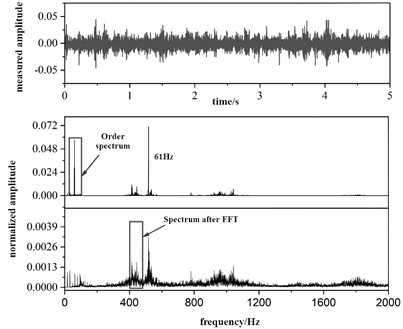
Fig. 5Spectrum after low-pass filtering
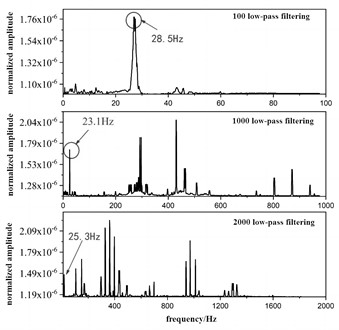
Fig. 6Gearbox rotation and meshing frequency search results
Time frequency analysis only highlights fault information, and the classification and location of faults require rich practical work experience. Therefore, the accuracy of the results of time frequency analysis increases with experience. Classify faults based on standard spectral data and time-frequency analysis. Measure the data ten times and the results obtained through time-frequency analysis comparison are shown in Table 1. According to verification, the accuracy of fault prediction is 90 %. This indicates that gearbox fault diagnosis based on vibration testing has high reliability and can effectively reduce maintenance costs.
Table 1Fault identification results
Number | Normalized amplitude of 1st frequency / 10-3 | Normalized amplitude of 2nd frequency / 10-3 | Normalized amplitude of 3rd frequency / 10-3 | Prediction of fault types |
1 | 0.021 | 0.054 | 0.00 | Normal |
2 | 0.036 | 0.057 | 0.08 | Normal |
3 | 0.068 | 0.009 | 0.04 | Normal |
4 | 0.188 | 0.057 | 0.105 | Normal |
5 | 0.162 | 0.032 | 0.139 | Wear |
6 | 0.084 | 0.349 | 0.244 | Pitting |
7 | 0.091 | 0.307 | 0.114 | Surface bonding |
8 | 0.082 | 0.339 | 0.150 | Surface bonding |
9 | 0.899 | 0.184 | 0.922 | Tooth breakage |
10 | 0.760 | 0.159 | 0.110 | Tooth breakage |
4. Conclusions
Vibration detection and fault diagnosis are playing an increasingly important role in industrial design and manufacturing. The development of vibration related disciplines and technologies cannot be separated from effective vibration detection systems as a solid data foundation. Through the design of the gearbox vibration monitoring system, the following conclusions can be drawn:
1) The collection and processing of acceleration signals generated by vibration is an important basis for determining the working status of gearboxes. In industrial testing, to improve detection efficiency, measurement signals can be processed within nodes, and the processed data can be uploaded to the upper computer through communication modules for further analysis and processing, achieving high integration.
2) Based on the amplitude frequency characteristics of the processed vibration signal, combined with a standardized fault library, the fault type of the gearbox can be effectively determined. Through synchronous testing and verification of ten different gearboxes, it can be seen that the accuracy of the vibration testing system in fault diagnosis is not less than 90 %, which is of great significance for reducing maintenance and repair costs.
References
-
M. H. M. Ghazali and W. Rahiman, “An investigation of the reliability of different types of sensors in the real-time vibration-based anomaly inspection in drone,” Sensors, Vol. 22, No. 16, p. 6015, Aug. 2022, https://doi.org/10.3390/s22166015
-
R. Bouhali, K. Tadjine, H. Bendjama, and M. N. Saadi, “Fault diagnosis of bladed disc using wavelet transform and ensemble empirical mode decomposition,” Australian Journal of Mechanical Engineering, Vol. 18, No. sup1, pp. S165–S175, Jul. 2020, https://doi.org/10.1080/14484846.2018.1499471
-
B. D. Kshirsagar, S. C. Goud, and S. N. Khan, “Vibration analysis of femur bone by using consistent mass matrices and fast fourier transform analyzer,” Materials Today: Proceedings, Vol. 26, No. 2, pp. 2254–2259, 2020, https://doi.org/10.1016/j.matpr.2020.02.489
-
Y. Wang, V. Jagota, M. E. Makhatha, and P. Kumar, “Vibration signal acquisition and computer simulation detection of mechanical equipment failure,” Nonlinear Engineering, Vol. 11, No. 1, pp. 207–214, Jun. 2022, https://doi.org/10.1515/nleng-2022-0026
-
Y. Jia and Y. Hu, “Research on fault signal detection method of mechanical vibration based on Kalman filtering algorithm,” International Journal of Information and Communication Technology, Vol. 1, No. 1, pp. 272–289, 2022, https://doi.org/10.1504/ijict.2022.10044157
-
M. Martincorena-Arraiza, C. A. de La Cruz Blas, A. Lopez-Martin, C. M. Vicuña, and I. R. Matías, “Fault detection of planetary gears based on signal space constellations,” Sensors, Vol. 22, No. 1, p. 366, Jan. 2022, https://doi.org/10.3390/s22010366
-
Y. Huang, Z. Shen, Q. Xie, and F. Jiang, “Vibration fault detection of vehicle transmission gearbox based on time-frequency analysis of non-stationary signals,” International Journal of Vehicle Design, Vol. 89, No. 1/2, p. 145, 2022, https://doi.org/10.1504/ijvd.2022.10053063
-
R. Li, X. Cui, Y. Zhao, X. Feng, and J. Dong, “A detection method of gear micro-cracks based on tuned resonance,” Measurement, Vol. 186, No. 1, p. 110112, Dec. 2021, https://doi.org/10.1016/j.measurement.2021.110112
-
S. Emmanuel, Y. Yihun, Z. Nili Ahmedabadi, and E. Boldsaikhan, “Planetary gear train microcrack detection using vibration data and convolutional neural networks,” Neural Computing and Applications, Vol. 33, No. 24, pp. 17223–17243, Dec. 2021, https://doi.org/10.1007/s00521-021-06314-x
-
S. Maraş, H. Arslan, and B. Birgören, “Detection of gear wear and faults in spur gear systems using statistical parameters and univariate statistical process control charts,” Arabian Journal for Science and Engineering, Vol. 46, No. 12, pp. 12221–12234, Dec. 2021, https://doi.org/10.1007/s13369-021-05930-y
About this article

The authors have not disclosed any funding.
The datasets generated during and/or analyzed during the current study are available from the corresponding author on reasonable request.
The authors declare that they have no conflict of interest.
