Abstract
Human perception of vibration is very subjective parameter which depends among others on age, sex or even nationality. There are three main methods of assessment of human perception of vibration according to national standards which differ from each other. All three methods are clearly described in this paper and their advantages and disadvantages are shown. Evaluation methods are helpful in diagnosis and design of the building when they are used properly. One of interesting aspect of quality of measurements is localization of measurement points. The choice of localization of measurement points could have significant influence on result of evaluation of human response to vibration. International and national standards are compatible in this matter – measurement points should be localized in the place of human vibration perception. It means that should be located in the middle of the floor. Sometimes it is difficult to determine the exact center of the floor, especially when building has irregular construction. In this paper influence of localization of measurement point on human perception of vibration is investigated and center zone in which measurement results are proper is determined. In-situ measurements were made to investigate the problem of localization of human vibration perception in buildings.
1. Introduction
In the recent decades population in the cities has grown. Exposure to vibrations from environmental sources like railways, tramways or roads causes such disturbance like annoyance, sleeping problems or headaches [1-3]. Designers and structural engineers focused mainly on dynamical influence of transport systems on structures [4-6]. Human perception of vibration is often neglected but it could be main parameter that should be considered in diagnosis and design of the building [7].
Human perception of vibration is very complex issue. First is good to distinguish between to definitions “exposure” and “dose”. Exposure is all vibration in the localization which is considered and dose is vibration that occurs only when residents of the building are at the considered location [8]. From design point of view vibration exposure is more useful but it is worth to remember that vibration dose is more realistic. All evaluation methods of human perception take into account vibration exposure. Human activities are considered by defining the time of day when residents are at their properties. Time of day is divided in a different evaluation methods into daytime and night, but some researches show that it should be changed because of human activity in our times [9]. Nowadays people residing in their houses at the afternoons and in the night and of course on weekends, so authors [9] proposed time periods as follow: daytime between 7.00 and 19.00 h, evening between 19.00 h and 23.00 h and nighttime between 23.00 and 7.00 h. Human exposure to vibration should than be measured in the time when people normally residing in their houses but measurement should be performed in the absence of occupies. First because residents can interrupt the signal and second because of additional mass on the floor. Measurements should be done in the room when the residents reported being most affected by vibration, in most cases it is a room located closest to vibration source.
When the time of day and the room of measurement is chosen, measurement points should be located in the point of entry which is the point in the building at which the vibration enters the human body. Location of measurement points of human perception of vibration in buildings seems to be obvious issue. However, requirements on that subject are imprecise. According to ISO standard [10] the primary aim of selection of measurement points should be to establish vibrations level at the point in which they enter to the human body. This sentence gives opportunity of making a mistake in this matter. In British standard [11] measurement point location is described more precisely. Requirements differ for external and internal vibration sources. For external excitation like ground-born vibrations measurement point should be located on the floor, in its central part within one third and two third of length/width. For internal excitation like pedestrian vibrations measurement points should be located according to modal analysis of structure. Polish standard of human exposure to vibrations in buildings [12] recommend to place the measurement point in the middle of the floor in the room located close to excitation source. However sometimes there are problems in identification where the center point of the floor is. Especially when analyzed building has irregular structural system.
The novelty of this study is based on the measurements of the impact of measuring point location on the result of the evaluation of human perception of vibration. The regulations in various countries differ from each other but investigations on that subject weren’t made. There are some papers on this subject, but they are focused on one of the chosen methodology [8, 13-15].
2. Evaluation methods of human perception of vibration
The vibration evaluation according to standard [10] is based on three methods: basic evaluation method using root-mean-square acceleration (RMS method) and two additional methods which should be used when the basic evaluation method is not sufficient. That kind of situation occurs in cases of high crest factor, occasional shocks and transient vibration. There are two additional methods which can be used: the running RMS method with the maximum transient vibration value (MTVV) and the fourth power vibration dose method with vibration dose value (VDV). All three methods of evaluation are shortly described in subsections below.
2.1. Root mean squared method (RMS)
The vibration evaluation according to this method should always include measurements of the weighted acceleration. Frequency weightings are given in [10] as graph function or in one-third octaves which is the best way to visualize results. The weighted acceleration should be calculated according to following equation:
where is the weighted acceleration as a function of time [m/s2]; is the duration of the measurements [s].
RMS method as a basic method can be used for evaluation of human perception of vibrations in any case but for signals with crest factor higher than 9 one of additional methods should be used to compare the results. When crest factor is higher than 9 RMS method can underestimate the discomfort. Crest factor of recorded signals should be checked according to Eq. (2):
Evaluation of human perception of vibrations depends on destination of the room, intensity of vibration during the day and on time of day. In this method two limits are considered: threshold of human perception of vibration below which vibrations are treated as imperceptible and comfort limit above which vibrations could be harmful.
2.2. Maximum transient vibration value method (MTVV)
The MTVV is a parameter of the running RMS method of evaluation which takes into account occasional shocks by use of a short time period and it is defined as maximum transient vibration value:
where is defined by following formula:
The analysis in the MTVV method consists in calculating the square root mean value as in RMS method. The difference is that the analysis is carried out not for the whole duration of the event and for time intervals lasting . A value of 1 s is recommended. Then intervals are summarized. The evaluation in MTVV method is made based on maximum value of the dynamical event.
This method is useful for shocks and transients of longer duration like mining tremors. The differences in results between basic RMS method and MTVV method could be up to 30 % in that kind of situation. MTVV method has small application to shocks of short duration.
2.3. Vibration dose value method (VDV)
The fourth power vibration dose method is more sensitive to peaks than basic evaluation method and MTVV method by using the fourth power instead of second power. The VDV value is in meters per second to the power 1.75 (m/s1.75) it results from the transformations of the formula:
Requirements for this method are described precisely in [11] and are listed in Table 1.
In this article the basic RMS method and additional method VDV is considered because of high crest value of recorded signals.
The analysis in the VDV method is made based on forth power Eq. (5) not like in the RMS and MTVV methods which are based on the second power Eqs. (1) and (4). The VDV method is derived from acoustics and is more associated with sound energy than with vibration energy.
Table 1Thresholds for VDV values
Room destination | Low probability of adverse comments | Adverse comments possible | Adverse comments probable |
Residential buildings – 16 h day | 0.2-0.4 | 0.4-0.8 | 0.8-1.6 |
Residential buildings – 8 h night | 0.1-0.2 | 0.2-0.4 | 0.4-0.8 |
Office buildings – 16 h day | 0.4-0.8 | 0.8-1.6 | 1.6-3.2 |
Workshops – 16 h day | 0.8-1.6 | 1.6-3.2 | 3.2-6.4 |
3. Measurement results
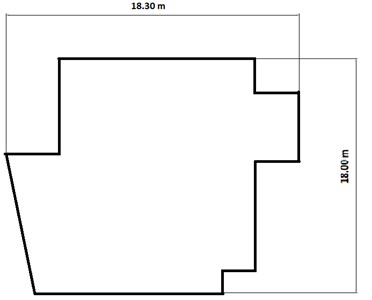
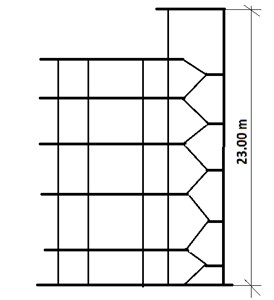
Analysed building is located in Cracow and it has irregular structural system (Fig. 1). It is reinforced concrete frame, five-storey office building. Building dimensions are 17.6 by 17.9 m. The height of the building is 23.2 m and dimensions of structural components are as follows: columns are from 25 by 25 cm up to 35 by 35 cm, floor slabs are 25 cm thick.
Fig. 1Schematic view of plan and cross section of the building
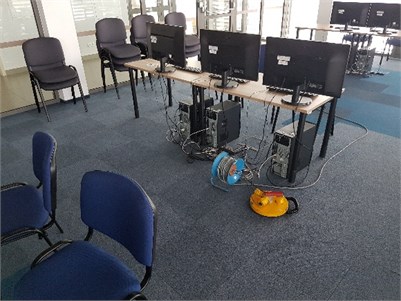
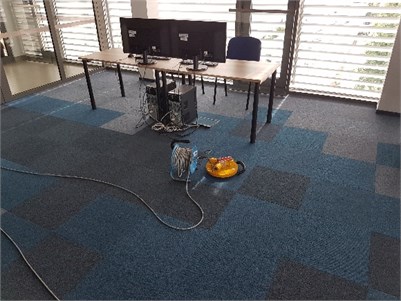
The measurements were taken for a period of 24 hours. The locations of measurements points with accelerometers used to estimate the human vibration perceptivity ratio, are presented in Fig. 2. Two measurement points were taken into consideration, because of difficulties to locate center point of the floor. All chosen points are located according to [11] in the area of 1/3 to 2/3 of length/width of the floor.
Fig. 2Location of measurement points
The examples of waveforms obtained in two measurement points during the same excitation are shown in Fig. 3.
As could be seen from Fig. 3 vibrations obtained in the center of the floor are higher than vibrations from point located in 1/3 from the floor center. However, this is not important, the most important is how the vibrations value influence on the results of evaluation of human perception of vibration.
3.1. RMS results
The RMS procedure were performed to evaluate the vibrational comfort in the room. Over the whole day, 1447 events with over 3 cm/s2 were recorded. Exceedance of perception threshold of vibration and comfort level occurred only in vertical direction. In 53 dynamical events perception threshold of vibration was exceeded at least in one of measurement points. Results for both measurements points for these 53 dynamical events are shown in Fig. 4. In 10 dynamical events comfort level was also exceeded but in point no. 09z which seems to be located closer to center point of the floor, meanwhile for measurement point no. 12z comfort level was exceeded only in 2 dynamical events during whole registration. Results are given in WODL ratio which is the maximum ratio of the acceleration RMS value obtained from the analysis to the acceleration RMS value equivalent to the threshold for the human perception of vibration (in the same 1/3 octave band) chosen from each 1/3 octave band [16]:
Fig. 3Waveforms of vibrations recorded in two points
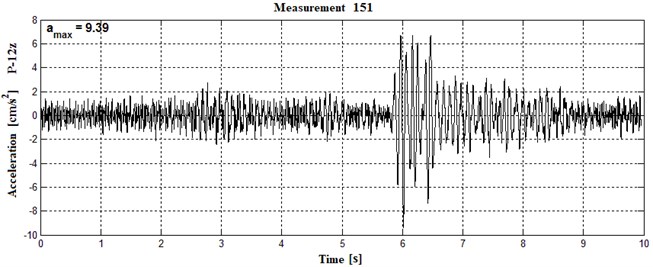
a) In 1/3 distance from the floor center
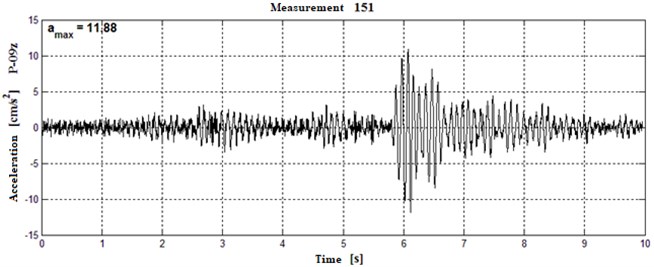
b) In the center of the floor
In Fig. 4 two lines were placed to represent perception threshold of vibration (orange) and comfort level (red). As could be seen only in every dynamical events result are different for both measurement points, in every event values for point no. 12z are much smaller then for point no. 09z. Measurements results obtained from both points influence on evaluation for human perception of vibration. In point no. 12z only two of recorded dynamical events exceed comfort level while in point no. 09z there are ten such events. It is worth noting that measurements last 24 hours and probability that these two very strong dynamical events will be occurred is about 0.0013. Moreover during classical RMS procedure it could be neglected, only in MTVV procedure which extract maximum values from RMS procedure these two dynamical events could be taken into account as the basis of evaluation. It should be noted that results from point 09z are mostly in the range between perception threshold of vibration and comfort level while for the same events in point no. 12z results are below the threshold line.
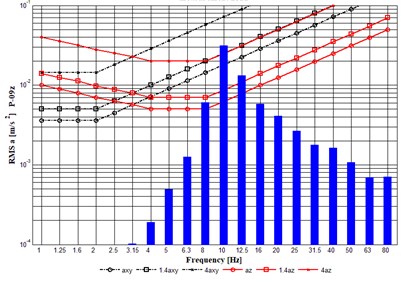
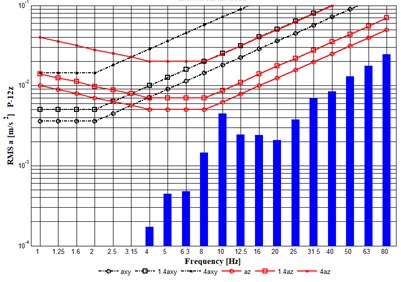
In Fig. 5 one of most spectacular differences in assessment of human response to vibration in analyzed building is shown.
For the same evaluation events results are totally different. In point no. 09z comfort level is exceeded during the day for frequency band equal 12.5 Hz, meanwhile in point no. 12z neither the level of comfort nor the perception threshold of vibration is exceeded in the none of octave bands. This illustrate how important proper location of measurement points is.
Fig. 4WODL results for two measurement points
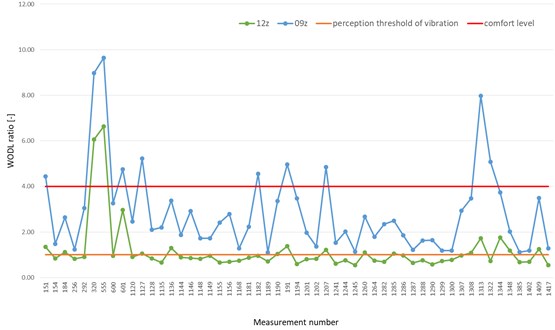
Fig. 5RMS evaluation results for point 09z and 12z
3.2. VDV results
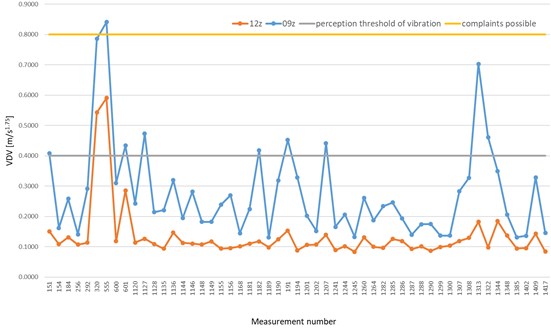
The VDV analysis was made for the same dynamical events as for RMS analysis. Results of the analysis are shown in Fig. 6.
The VDV results obtained for this office building show that in only two cases perception threshold of vibration is exceeded when records from measurement point located in 1/3 of the floor are considered. In the situation when measurement point located in the floor center is taken into account, in 10 dynamical events perception threshold is exceeded, in only one of them the threshold of “low probability of adverse comments” is also considered. Is seems that VDV results are much lower than that obtained from RMS analysis, but VDV should be considered not for single dynamical event but for exposition lasting whole day. When VDV values are different for dynamical events to calculate Eq. (7) should be used:
where: where: – VDV value for single vibration episode, – number of episodes per day/night.
In the case of analyzed building for measurement point located in 1/3 distance from the center of the floor is equal 0.69, which means acc. to Table 1 that there is low probability of adverse comments. Adverse comments are possible when results from measurement point located in the center of the floor are considered. In such a situation it could be a problem for residents of analyzed building.
Fig. 6VDV results for two measurement points
4. Results and discussion
Two main research problems were considered in the articles: the differences in evaluation of human perception of vibration made according RMS and VDV analysis, the differences in results of that evaluation made using waveforms obtained from different measurement points. Summary of results of the first research problem is given in Table 2.
Table 2Differences in evaluation method results
Evaluation method | Number of threshold exceedance | Number of comfort exceedance | Result of evaluation | |
RMS | 1/3 distance from the floor center | 17 | 2 | Room is uncomfortable |
RMS | Center of the floor | 53 | 10 | Room is uncomfortable |
VDV | 1/3 distance from the floor center | 2 | 0 | Room is comfortable |
VDV | Center of the floor | 10 | 1 | Room is uncomfortable |
The results show in three to four analysis that vibrational comfort in analysed room is not ensured. The differences between methods of evaluation taken into account result from measurement analysis. According to Polish standard [12] duration of vibration which should be taken to RMS analysis is the time period in which vibration amplitudes are higher than 0.2 of maximum amplitude. The requirements included in [12] are much restrictive than requirements in [10, 11]. In spite of fourth power used in formula VDV, the results from RMS with duration acc. [12] are higher.
5. Conclusions
Vibrational comfort is one of the most unmeasured values because it depends from personal perception. In the article two methods of evaluation of human perception of vibration were used. The differences between them are significant, but the result of the whole analysis is similar. Location of measurement point has got the main influence on analysis result. Researchers should be careful about the choice of measurement point which is used for evaluation of vibrational comfort. It is recommended to place the measurement point in the middle of the floor, but sometimes geometric center is not equal to structural center of the floor. In such situations, which appeared when stiffening element is below the floor or when there is irregular support system of the floor, it is good to place some additional measurement points. The worse result in such situation should be considered.
References
-
Öhrström E., Skånberg A.-B. A field survey on effects of exposure to noise and vibration from railway traffic, part I: annoyance and activity disturbance effects. Journal of Sound and Vibration, Vol. 193, 1996, p. 39-47.
-
Paulsen R., Kastka J. Effects of combined noise and vibration on annoyance. Journal of Sound and Vibration, Vol. 181, 1995, p. 295-314.
-
Trollé A., Marquis Favre C., Parizet E. Perception and annoyance due to vibrations in dwellings generated from ground transportation: a review. Journal of Low Frequency Noise, Vibration and Active Control, Vol. 34, 2015, p. 413-457.
-
Valašková V., Papán B., Barros R. C. Assessment of the roadway dynamic response due to the Tatra 815 lorry excitation and experimental verification. Communications: Scientific Letters of the University of Žilina, Vol. 18, 2016, p. 49-55.
-
Xia H., Chen J., Wei P., Xia Ch, De Roeck G., Degrande G. Experimental investigation of railway train-induced vibrations of surrounding ground and a nearby multi-story building. Earthquake Engineering and Engineering Vibration, Vol. 8, 2009, p. 137-148.
-
Tatara T. Dynamic effectiveness of „ecological tramway” on building vibration. 2nd International Conference on Dynamics of Civil Engineering and Transport Structures and Wind Engineering, Slovak Republic, 2003, p. 230-233.
-
Kawecki J., Kowalska Koczwara A., Stypula K. Consideration of criteria of vibration comfort of people in diagnosis and design of buildings. World Academy of Science, Engineering and Technology International Journal of Civil and Environmental Engineering, Vol. 5, 2011, p. 582-588.
-
Sica G., Peris E., Woodcock J. S., Moorhouse A. T., Waddington D. C. Design of measurement methodology for the evaluation of human exposure to vibration in residential environments. Science of the Total Environment, Vol. 482, Issue 483, 2014, p. 461-471.
-
Whittle N., Peris E., Condie J., Woodcock J., Brown P., Moorhouse A. T., Waddington D. C., Steele A. Development of a social survey for the study of vibration annoyance in residential environments: good practice guidance. Applied Acoustics, Vol. 87, 2015, p. 83-93.
-
ISO 2631-1, Mechanical Vibration and Shock – Evaluation of Human Exposure to Whole-Body Vibration. Part 1 – General Requirements. International Organization for Standardization, 1997.
-
BS 6472-1:2008, Guide to Evaluation of Human Exposure to Vibration in Buildings, Part 1 – Vibration Sources Other Than Blasting, 2008.
-
PN-B-02171:2017-06, Evaluation of Human Exposure to Vibration in Buildings, 2017, (in Polish).
-
Hunaidi O., Tremblay M. Traffic-induced building vibrations in Montréal. Canadian Journal of Civil Engineering, Vol. 24, Issue 5, 1997, p. 736-753.
-
Turunen Rise I.-H., Brekke A., Hårvik L., Madshus C., Klæboed R. Vibration in dwellings from road and rail traffic – part I: a new Norwegian measurement standard and classification system. Applied Acoustics, Vol. 64, Issue 1, 2003, p. 71-87.
-
Waddington D. C., Moorhouse A. T., Steele A., Woodcock J. S., Condie J. M., Peris E., Sica G., Koziel Z. Human Response to Vibration in Residential Environments (NANR209). University of Salford Manchester, 2011.
-
Kawecki J., Stypuła K. Ensuring the Vibrational Comfort for Humans Exposed to Transport Vibrations. Cracow University of Technology, 2013, (in Polish).
Cited by
About this article

