Abstract
The results of laboratory studies of innovative technology for grinding raw materials are presented. Grinding technology is one of the most energy-intensive industries in the industry. The obtained data confirm the possibility of obtaining breakthrough technical and economic indicators in the implementation of the proposed innovative technology of grinding raw materials in ball mills. The latter is achieved by maintaining in them the optimal trajectories of intra mill loading on the basis of the use of a controlled cascade-waterfall grinding mode, depending on the constantly changing physical and mechanical properties (grind ability, strength) of the ground product. At the same time, the mill effectively implements the most efficient grinding regimes (blow, abrasion, crushing), depending on the current strength of the crushed raw materials. Tests have shown the possibility of reducing the specific energy consumption depending on the strength of the crushed material by 31-44 % with a simultaneous increase in the performance of the mill for raw materials of various strength classes by 22-57 %. For the industrial tests of the proposed technology, two systems of automatic control of the strength of the comminuted material in the mill have been developed.
Highlights
- Innovative technology for grinding raw materials
- Innovative grinding technology
- Technical and economic indicators
- Efficient grinding regimes
1. Introduction
Billions of tons of coal, ore and non-metallic minerals are being crushed in the world. With such a huge production volume, even a small percentage of the increase in the efficiency of these industries offers tremendous economic benefits [1]. The grinding processes are very energy intensive, and therefore the cost of electrical energy in the cost of such processes is more than 22 % with an average value of this indicator for all technological processes of 2.6 % [2]. Therefore, the creation of a new efficient grinding technology, which allows to significantly increase the productivity of grinding aggregates and reduce the specific energy consumption, is certainly an urgent problem [3]. Existing grinding technologies with a constant (uncontrollable) trajectory of intra mill loading are ineffective, since They work at a deliberately lowered productivity, calculated on the most difficult to grind raw materials [4]. Therefore, a new technology of grinding minerals is needed, which instantly adapts to changes in the strength of the raw materials [5]. It is known that the crushing of solid minerals is carried out in three ways: by impact for strong ores, by abrasion for medium-strength ores, and by crushing for soft ores [6]. Thus, the main idea of the work is to maintain in the grinding units the optimal trajectory of the intra mill load (optimal grinding modes) depending on the strength of the material being crushed [7]. For dry grinding (coal preparation at thermal power stations, production of cement, phosphorite ore, etc.), an experimental system of operational measurement of the strength of the material to be milled in ball mills was tested [8]. The results of laboratory tests of the proposed technology are given below. Installation for experimental studies consists of a ball mill laboratory 40 ML with a rotary axis [9]. This mill is designed for periodic fine grinding of both wet and dry material with a grain size of 4 to 6 mm [10]. Ball loading in a laboratory mill was adopted in the same proportions as in the coarse grinding chamber of a two-chamber separator mill of the “Polysius” type with a scale factor by weight of 1:1000.
2. Materials and methods
As a drive for the mill, a P-12 series DC motor was used. The electric motor is connected to the mill through a rigid coupling. Registration and recording of the speed is carried out by a three-phase AC sensor of the D1-3 type with a secondary device T3-3M. The electrical parameters of the engine and the number of revolutions are recorded on panel instruments with simultaneous recording on an oscilloscope. To regulate the angular velocity of rotation, a special engine control circuit was created [1]. The scheme allows you to change the rotational speed with a period of 0-100 sec. The implementation of a variable speed mode in time is made by means of a brush switch type PMT-12. A set of constant resistance breaks the entire selected speed range into eight stages, which correspond to the following speeds of 84, 80, 74, 68, 60, 55, 50, 45 rpm.
Table 1Ratio of ball mills loading
Ball loading mill (Polysius) (factory data) | Laboratory ball loading mills 40 ML | ||||
Ball diameter | Weight | % | Ball diameter | Weight | % |
100-90 mm | 1.5 Ton | 19 | 30 mm | 1.5 kg | 19 |
80 | 2.5 | 29 | 25-22 | 2.5 | 29 |
70 | 2.5 | 29 | 19 | 2.5 | 29 |
60 | 2.0 | 23 | 16 | 2.0 | 23 |
Total | 8.5 Ton | 100 % | Total | 8.5 kg | 100 % |
The first position of the switch corresponds to the purely “waterfall” mode (95 % of the critical speed), the last to the purely “cascade” (50 % of the critical speed), the remaining positions are intermediate high-speed modes [2]. The operating time at any of the eight steps was recorded by a manual stopwatch. In accordance with the pre-selected speed chart, switching is performed manually according to the stopwatch. In all comparative tests, the following standard conditions were adopted: first stage (84 rpm) 2 minutes; the second (80 rpm) 2 min; the third (74 rpm) 2 min; the fourth (68 rpm) 2 min; the fifth (60 rpm) and the sixth (55 rpm) 3 min, the seventh (50 rpm) and the last (eighth) (45 rpm) 5 min. The total time is 24 minutes (the rationale for these conditions is given below). The test is based on the method used for the first time by Fahrenwold, which reproduces a single-stage open cycle of a ball mill (see Table 1). The preliminary stage, which largely determines the reliability of the research results, is the sorting of the initial samples by size and hardness. To prepare the raw material, a large piece of material is taken (oversize), which is destroyed and crushed in a laboratory jaw crusher, and the material that has already been crushed is sifted on the desired sieve. Ore size for testing was taken on the basis of the passport characteristics of the mill 40 ml (no more than 6 mm). For screening material, standard sieves with 1.2, 3, 5 mm round holes were used. Samples were prepared in two types: samples with a wide range of size and samples with a narrow size class.
Samples with a wide range of size:
– The first (“A” series) with a maximum grain size of 2 mm (–2+0);
– The second (“В” series) with a maximum grain size of 3 mm (–3+0);
– The third (“С” series) with a maximum grain size of 5 mm (–5+0).
The initial granulometric composition of the samples of the series “A”, “B”, “C” is given in Table 2. To obtain samples with a narrow size class, the starting material was sieved through two sieves, which have hole sizes corresponding to the largest and smallest size. So, the samples were prepared by classes: (–5+3) mm, (–3+2) mm and (–2+1) mm. By adopting a linear law of distribution of material within a single fraction (–8; 10), corresponding to the obtained grain sizes:
– the fourth (“M” series) is an average grain size of 1.5 mm;
– the fifth (“L” series) is an average grain size of 2.5 mm;
– the sixth (“D” series) is an average grain size of 1.5 mm;
– the seventh (“N” series) is an average grain size of 2.5 mm;
– the eighth (“K” series) is an average grain size of 4 mm.
The sample weight for the experiments was taken equal to the volume of voids between the balls, which was determined by filling it with liquid, and turned out to be equal to 12 % of the working volume of the mill. Next, a series of identical sample weights is prepared using a measure, the volume of which was equal to 850 cm3, i.e. also about 12 % of the working volume of the mill (in the methodology of the Mekhanobor Institute, when carrying out standard tests for grind ability, the weight is also taken equal to 12 % of the working volume of the mill [3]). Samples of the same samples are prepared in the quantity necessary for the experiments. Since the studies were carried out with dry grinding, the humidity of the samples may have a significant impact on the results. Therefore, all the prepared samples were kept at a constant temperature for several days. In all experiments, screen analyzes were performed using the wet-dry method, i.e. before determining the size of the screens, a thin class (–0.074 mm) was washed. The upper class dried and scattered into fractions. In determining the outputs of the classes, the washed product was added to the lower fraction obtained on the same sieve “dry”. Sifting of the crushed product was made on classes +0.4; +0.14; +0.1; +0.074; –0.074; –0.054 mm. The weight of the sample for sieving was taken equal to 100 grams [1].
When obtaining the results of sieve analysis, errors are possible, which are mainly due to subjective factors, since the technical conditions: rotation speed, composition of the ball load, filling factor, lining wear, etc. during the experiments remain almost constant. The main errors in the results fall on the particle size distribution of the starting material and the quality of the sieve analysis. Therefore, to obtain reliable data it is necessary to have a certain amount of experimental data.
The value of this volume, in our case the number of identical experiments, is determined on the basis of the provisions of mathematical statistics [3]. The value of the confidence level is usually accepted. To determine the volume of the experiments, the grinding of twelve identical samples of the “L” series was carried out. The evaluation was made according to the content of the class –0.074 mm in the ground product. It turned out that the class content –0.074 mm is subject to the normal distribution law with standard deviation 1.27 % and mathematical expectation 29.2 %. According to [5] ensure accuracy ±5 %, 4-5 identical experiments are required. In the following, the results of four experiments are given. When grinding material in ball mills of great importance is the choice of the residence time of the material in the mill, i.e. grinding time. Usually, the first grinding period is characterized by uneven output of all the minerals in the original ore, and significant productivity of the finished product per unit of time. This is explained by the fact that the minerals that make up the raw materials and provide maximum resistance to the destructive force will be concentrated in the mill, and the weaker minerals will quickly deteriorate, providing a greater yield of finished product per unit of time. An increase in the grinding time leads to the fact that the mineralogical composition of the product leaving the mill will correspond to the mineralogical composition of the raw material, since previously not destroyed solid minerals begin to grind. In this case, the yield of the finished product per unit of time will decrease due to the fact that easily milled components delay the rate of destruction of solid minerals [6]. It should be borne in mind that the above reasoning is valid for periodic grinding mills. For the same reason, in order to obtain objective experimental results, the grinding time should be correctly determined. For this purpose, experiments on grinding were carried out, with different time intervals: 4, 6, 8, 12 and 24 minutes, to construct the curves of the content of the class “minus” depending on the time of grinding. Experiments were conducted on samples of the series “A”, “B” and “C” at a constant speed of rotation 64 rpm. The resulting curves are shown in Fig. 1(a). Analysis of the curves obtained shows that up to 12 minutes, grinding is very intensive, and after 20 minutes, the grinding intensity decreases. This suggests the stabilization of the grinding process and the fact that further grinding will not give a very significant increase in productivity. Based on the foregoing, the performance of the comparative tests is assumed to be 24 min.
Since the mode with controlled trajectory of intra mill loading is based on changing the speed of rotation of the mill drum, to compare the results obtained with the proposed grinding method, it is necessary to determine some optimal rotation speed that provides the best grinding performance in the mode with a constant intra mill loading path, namely grade content –0.074 mm in the crushed product. Determination of the optimal speed was carried out on samples with a wide range of particle sizes of a series of samples “A”, “B” and “C”. According to the test results, content curves of class –0.074 mm were constructed depending on the speed of rotation on different samples (Fig. 1(b)) (the curves are based on the arithmetic mean values of four experiments). The grinding time was taken 24 min. It turned out that for samples of the “A” series the optimal speed is 60 rpm with a grade of –0.074 mm 47.5 %; sample series “В” 64 rpm, 41 % and series “С” –67.5 rpm, 37 %. Since all tests must be carried out at the same speed, the basic speed is assumed to be equal to 64 rpm, as the arithmetic mean of three values. In this case, the error introduced by the introduction of the basic speed will not exceed ±1.5 %.
From Fig. 1(b) it follows that the dependence of the content of the class –0.074 mm in the crushed product on the speed of rotation has a maximum. The results obtained are consistent with previously obtained data from other authors.
The first stage of research is to test the proposed grinding method, i.e. grinding with periodic short-term changes in the speed of rotation [7]. The main speed, from which the speed jumps were made, was taken to be equal to the optimal speed found experimentally ( 64 rpm). Further experiments are aimed at:
1) Determination amplitude of the jump. The upper limit of the jump amplitude was taken at the level of 100 % of the critical speed. Since the main speed rpm, i.e. 72 % of the critical speed, the possible range of speed changes is therefore equal to 0-28 % (28 rpm). In the experiments it was assumed that the larger the maximum grain size of the initial sample, the greater should be the jump amplitude. In accordance with the maximum size of weights of “A”, “B” and “C” series (2 mm, 3 mm and 5 mm), the possible range of speed rpm variation is divided into three parts, i.e. for samples of series “A” the amplitude of the jump from the main was equal to 9 rpm, samples of series “B” 18-19 rpm, and samples of series “C” 28 rpm;
2) Determination rate of change speed. The identification of the optimal rate of change in speed was made by the search method. As a result of conducting a large number of experiments for a 40 ml mill, the best frequency was found to be equal once per minute, i.e. period is equal to 60 sec;
3) Determination of the magnitude duration of the increased speed.
The operating time at the changed speed should not be excessive, since this will lead to the fact that the mode will actually correspond to the mode at a constant, but at a speed that has already been changed. Based on the foregoing, we adopted in the experiment the duration of work at an increased speed of about 15 % of the period ( 10 sec).
At the second stage of research, the effectiveness of the work of a new type of mills with separately rotating sections having different rotation speeds was tested. At the loading site, the rotational speed should be such as to ensure the “waterfall” mode, in which the destruction occurred due to the impact. As the material moves to the place of unloading, the speed should decrease, since the grain size decreases and more fine grinding is necessary, which is carried out at the “cascade” grinding mode. Since such a mill does not exist, an imitation of such a grinding process was carried out in a laboratory grinding mill. The material of the series, “M”, “L”, “D”, “N” and “K” was loaded into the batch mill, which was crushed at a variable trajectory of the mill loading in time. Eight speed steps were adopted, which would correspond to a continuous mill with eight sections of the same diameter, but with different speed modes. According to the results of sieve analyzes, a total plus size and a partial size characteristic (class distribution curve) were constructed. According to the total characteristic size of the "plus" was made an overall assessment of the crushed product. The convex total characteristic indicates the predominance of coarse material, concave-small. If the characteristic is rectilinear, then this indicates a uniform distribution of classes [7]. The private characteristic of the size of the crushed product gives the answer at the expense of what classes the change in quantitative terms occurs and gives an estimate of the quantity and quality of the finished product by class –0.074 mm. To estimate the rate of formation of the finished class when grinding in the proposed mode, compared to the mode at a constant speed, samples were taken for a class of –0.074 mm for sieve analysis after 6, 12, 18 and 24 minutes of grinding (samples of the “C” series) and based on the results of the analysis performance curve class –0.074 mm, depending on the grinding time.
3. Results and discussion
The evaluation of the obtained results of the new technology [4] was made on the following characteristics of the grinding process:
1) The content of the class is –0.074 mm in the crushed product %, where is the mode index (1-speed constant, 2-speed mode, 3-mode with varying trajectory in time);
2) Absolute increase in grade content –0.074 mm in the output product: , where the content of the class –0.074 mm after grinding; the content of the class –0.074 mm in the original sample;
3) Increasing the grade of –0.074 mm with the new mode compared to the mode at a constant speed: .
4) The specific productivity of the newly formed class –0.074 mm:
where the sample weight, kg, 1.5; grinding time, 24 min; working volume of the mill, 7 L;
5) Absolutely increase in specific performance: , kg/L⋅h;
6) Relative increase in specific productivity: , %.
Fig. 1The dependencies of the content of the class “minus” from the grinding time a) and the content of the class 0.074 mm from the speed of rotation b) of the mill drum
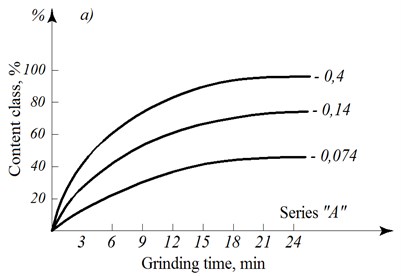
a)
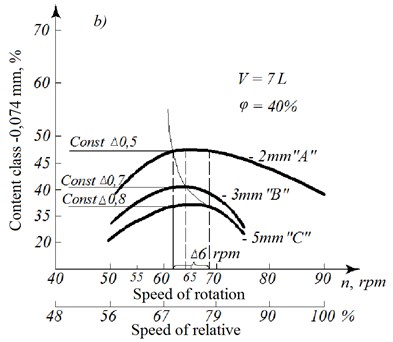
b)
The results of the experiments and calculations are summarized in Table 3. From Table 3 it can be seen that, compared with the mode at a constant speed, the proposed mode on samples of the “A”, “B”, “C” series gives an increase in the percentage of –0.074 mm class by 9.5 %, 13 % and 11.9 %, specific productivity by 0.049, 0.07 and 0.069 kg/L·h, relative increase in productivity by 41.4, 55.5 and 50 %. To assess the content of sludge samples were taken series “B”.
Table 2Characteristics of the size of the original ore
Sample | Size. | Class content | ||||
Series “А” | mm | –2+0.4 | –0.4+0.14 | –0.14+0.1 | –0.1+0.074 | –0.074 |
% | 50.0 % | 17.3 % | 6.6 % | 0.7 % | 25.4 % | |
Series “В” | mm | –3+0.4 | –0.4+0.14 | –0.14+0.1 | –0.1+0.071 | –0.074 |
% | 67.8 % | 9.2 % | 2.8 % | 3.6 % | 17.6 % | |
Series “С” | mm | –5+0.4 | –0.4+0.14 | –0.14+0.1 | –0.1+0.071 | –0.074 |
% | 81 % | 6.2 % | 2.2 % | 1.4 % | 9.4 % | |
Table 3Comparison results of the grinding process at a constant rotation speed (1) and in the two-speed mode (2)
Series | ||||||||
2 | 3 | 4 | 5 | 6 | 7 | 8 | 9 | 10 |
“А” | 1 | 25.4 | 47.0 | 21.6 | 0.116 | 9.5 | 0.049 | 41.4 |
2 | 25.4 | 56.5 | 31.1 | 0.169 | ||||
“В” | 1 | 17.6 | 41.2 | 23.6 | 0.126 | 13.0 | 0.07 | 55.5 |
2 | 17.6 | 54.2 | 36.6 | 0.196 | ||||
“С” | 1 | 9.4 | 36.2 | 25.8 | 0.138 | 11.9 | 0.069 | 50.0 |
2 | 9.4 | 48.1 | 38.7 | 0.207 |
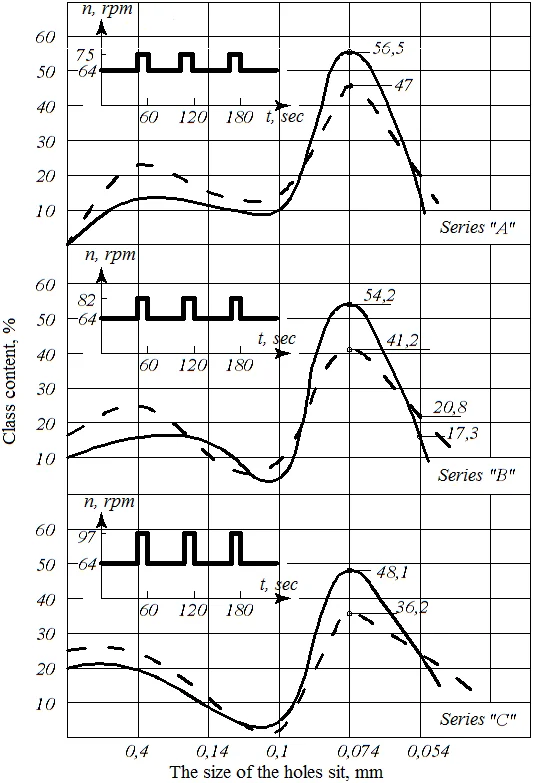
The amount of sludge formation was estimated according to the class of –0.054 mm. It turned out that the amount of sludge decreased by 3.5 %, indicating a narrowing of the size of the finished product in the desired size range. The relative decrease in the amount of sludge in comparison with the regime at a constant speed is 16.8 %. The characteristic of the size of the initial samples and grinding products in different modes is shown in Figs. 2 and 3. The oscillograms of the mill rotation speed are also given there. Analysis of the curves shows that an increase in the content of the class of –0.074 mm in the finished product occurs due to a decrease in the content of larger classes of +0.14 mm and partially due to a decrease in the number of thin classes of –0.054 mm. According to the test results, the energy efficiency of the studied mode was estimated. Power was measured according to the indications of an ammeter and a voltmeter [8]. The energy consumption of one grinding cycle was determined by the product of the engine running time and power consumption Eq. (1) by the formula:
where – the ratio of the operating time at the main speed, 0.84; – the coefficient of work at high speed, 0.16; and developed engine power, respectively at primary and increased speed.
The value of the energy efficiency Eq. (2) of the grinding process was calculated by the formula:
where – performance mill class –0.074 mm.
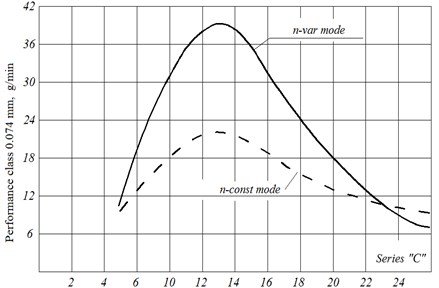
The results of measurements and calculations are given in Table 4. In comparison with the mode of constant trajectory of the movement of intra mill loading, the mode with controlled trajectory on samples of series A, B, C give an absolute increase in energy efficiency and percentages of 31.2-48.4 %. The next stage of the trajectory controlled mode study was to identify the nature of the rate of formation of the finished product [9]. On samples of the series “C” was taken grinding time equal to 12 minutes. The test results are shown in Fig. 4. Analysis of the curves shows that the rate of product formation in the –0.074 mm class rises to 12 min, then drops 24 min and becomes less with the min than with the constant path mode. The rate of increase and decrease in the rate of formation of the product in the mode under study is two times greater than in the mode with a constant path.
Fig. 2The private characteristic of the size of the crushed product. ––––– in trajectory mode, – – – mode with a constant trajectory
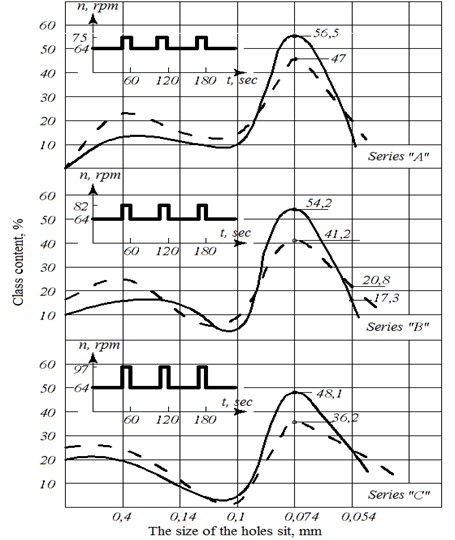
Table 4Results of experiments and calculations in determining the energy efficiency of various grinding technologies
Sample series | Operating mode | Mode index | kg | kWh | kg/kWh | kg/kWh | ⋅ 100 % |
“А” (–2+0) | 1 | 0.812 | 0.095 | 9 | 2.8 | 31.2 | |
2 | 1.169 | 0.098 | 11.8 | ||||
“В” (–3+0) | 1 | 0.882 | 0.095 | 9.3 | 4.5 | 48.4 | |
2 | 1.372 | 0.099 | 13.8 | ||||
“С” (–5+0) | 1 | 0.966 | 0.095 | 10.1 | 4.4 | 43.5 | |
– | – | – | – |
The results of experiments and calculations of the grinding process with varying trajectory of movement over time are shown in Table 5. Rom Table 5 it follows that the relative increase in the content of the class –0.074 mm with a variable rotation speed is greater than at a constant speed, by 6.9-15.5 %. The specific productivity (per unit volume of the mill) increases by 19.7-57.3 % in relation to the performance at a constant speed of rotation [10]. Significant differences in the increase in productivity on the same samples in the composition, but different deposits of 43.7-57.3 % and 19.7-22.3 % indicate that the ores are significantly different in physical and mechanical properties; hence the diagram of changes in rotational speed should be different for different ore. To carry out such experiments on existing industrial installations, the necessary conditions are the availability of a system for operative control of the strength of the crushed raw materials in a ball mill, which makes it possible to control the trajectory of the intra mill load in the optimal mode. For two-chamber separator mills, a variant of such a system has been developed.
Table 5The results of the comparison of the grinding process at a constant speed of rotation Eq. (1) and with varying speed over time Eq. (3)
Series | , % | , % | , kg/L·h | , % | , kg/L·h | , % | |
“D” | 1 | 0 | 27.4 | 0.144 | 15.5 | 0.084 | 57.3 |
3 | 0 | 42.5 | 0.228 | ||||
“L” | 1 | 0 | 30.0 | 0.16 | 10.4 | 0.056 | 35.0 |
3 | 0 | 40.4 | 0.216 | ||||
“K” | 1 | 0 | 22.6 | 0.121 | 9.9 | 0.053 | 43.7 |
3 | 0 | 32.5 | 0.174 | ||||
“М” | 1 | 0 | 35.2 | 0.188 | 6.9 | 0.037 | 19.7 |
3 | 0 | 42.1 | 0.225 | ||||
“N” | 1 | 0 | 28.3 | 0.153 | 6.9 | 0.035 | 22.3 |
3 | 0 | 35.2 | 0.188 |
Fig. 3The total characteristic of the size of the crushed product by "plus". ––––– in trajectory mode, – – – mode with a constant trajectory
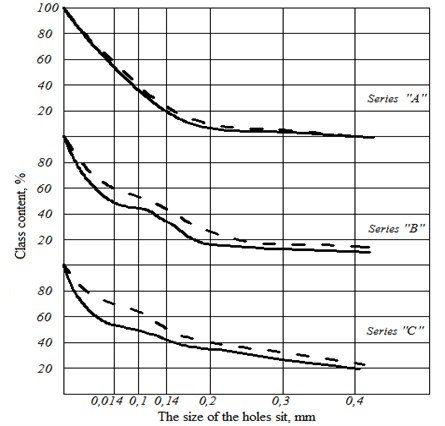
Fig. 4The dependence of the performance of the class 0.074 mm from the grinding time
4. Conclusions
Thus, according to the results of the study, the following conclusions can be drawn:
1) A methodology has been developed for testing the operation mode of ball mills with a controlled trajectory of intra mill loading for comparing the test results obtained with the results of the operation of a mill with a constant trajectory;
2) Laboratory tests of the operation mode of the mill with controlled trajectory of intra mill loading confirmed the theoretical assumptions about improving the efficiency of the destruction process with a variable trajectory of intra mill loading for ball grinding;
3) The mode of operation of the ball laboratory mill with controlled trajectory of intra mill loading significantly improves the performance of the grinding process for the finished product (by class –0.074 mm) in comparison with the mode of operation at a constant trajectory on samples of various sizes: 0.049-0.07 kg/L·h, as percentage it is 41-55 %;
4) When grinding in the proposed mode on samples of the “B” series with a grain size of 3 mm, the assessment of the finished product by class –0.054 showed that the content of this class decreased by 3.5 %, which compared to the mode at a constant speed will be 17 %;
5) An increase in productivity by class –0.074 mm and a decrease in the class content –0.054 mm in the output product indicates a narrowing of the size range of the material;
6) Calculations on the consumption of electricity for grinding showed that the energy consumption per 1 kg of the finished product is reduced by 31-44 %;
7) Tests of the variable speed in time showed an increase in productivity in the class –0.074 mm on samples with a narrow size class of 0.035-0.084 kg/L·h, which is in percentage relative to the mode with a constant speed respectively 22-57 %.
References
-
Adambayev M., Auezova A., Adambayeva A., Zhauyt A. Adequate discrete sampling method of random variables of the two stage dry crushing process and its stochastic equation. Engineering for Rural Development, Vol. 17, 2018, p. 994-1001.
-
Jung H., Lee Y. J., Yoon W. B. Effect of moisture content on the grinding process and powder properties in food: a review. Processes, Vol. 6, Issue 6, 2018, p. 1-16.
-
Ngamnikom P., Songsermpong S. The effects of freeze, dry, and wet grinding processes on rice flour properties and their energy consumption. Journal of Food Engineering, Vol. 104, 2011, p. 632-638.
-
Dziki D. Effect of preliminary grinding of the wheat grain on the pulverizing process. Journal of Food Engineering, Vol. 104, 2011, p. 585-591.
-
Bond F. C. Crushing and grinding calculations. Brazilian Journal of Chemical Engineering, Vol. 6, 1961, p. 378-385.
-
Huck, Makein I., Armstrong B., Willen U., Freeman T. Effect of particle shape and size on flow properties of lactose powders. Particuology, Vol. 10, 2012, p. 203-208.
-
Dziki D. The crushing of wheat kernels and its consequence on the grinding process. Powder Technology, Vol. 185, 2008, p. 181-186.
-
Laskowski J., Iysiak G. Use of compression behavior of legume seeds in view of impact grinding prediction. Powder Technology, Vol. 105, 1999, p. 83-88.
-
Balasubramanian S., Rajkumar R., Singh K. K. Determination of grinding parameters of fenugreek seedJournal of Spices and Aromatic Crops, Vol. 26, 2017, p. 16-26.
-
Dziki D., Tomiło J., Rózyło R., Laskowski J., Gawlik Dziki U. Influence of moisture content on ˙ the mechanical properties and grinding energy requirements of dried quince (cydonia oblonga miller). Teka Commission of Motorization and Power Industry in Agriculture, Vol. 12, 2012, p. 35-39.
About this article

