Abstract
In this study, a comparison of sound radiation characteristic of a clamped free annular circular plate with different parabolically varying thickness with different taper ratios 0.25, 0.50 and 0.75 with different excitation locations are analyzed by keeping the mass of the plate constant. Rayleigh integral is applied to determine the acoustic behavior of the plate. The same problem is also solved by FEM to draw the comparison. It is observed that excitation locations and modes have a significant effect on sound power level in comparison to stiffness variation due to different taper ratios. Further, the variation of peak sound power level is investigated with different taper ratio with different excitation locations. Finally, the design options for peak sound power are suggested for different excitation locations with different taper ratios.
1. Introduction
In engineering applications, annular circular tapered plates with different combinations of arbitrarily varying thickness are widely used in structural components i.e. diaphragms and deck plates in launch vehicles, diaphragms of turbines, telephone industry, aircrafts/missiles, naval structures, constructions of ships, automobiles and other vehicles etc. Several researchers have examined the acoustic response of circular or annular plate with uniform or tapered thickness. Lee and Singh [1] used the thin and thick plate theories to determine the sound radiation from out-of-plane modes of uniform thickness annular circular plate. Levine and Leppington [2] analyzed the sound power generation of a circular plate of uniform thickness using exact integral representation. Rdzanek and Engel [3] determined the acoustic power output of a clamped annular plate using asymptotic formula. Wodtke and Lamancusa [4] minimized the acoustic power of circular plates of uniform thickness using the damping layer placement. Wanyama [5] studied the acoustic radiation from linearly-varying circular plates. Lee and Singh [6] used the flexural and radial modes of a thick annular plate to determine the self and mutual radiation. Lee and Singh [7] investigated the annular disk acoustic radiation using structural modes through analytical formulations. Rdzanek et al. [8] investigated the sound radiation and sound power of a planar annular membrane for axially-symmetric free vibrations. Hasegawa and Yosioka [9] determined the acoustic radiation force used on the solid elastic sphere. Lee and Singh [10] used a simplified disk brake rotor to investigate the acoustic radiation by a semi-analytical method.
2. Mathematical formulation
2.1. Plate free vibration
The natural frequency and modes shape of the plate is given by Eq. (1):
where [] is the stiffness matrix and [] is the mass matrix while is the mode shape of structure and is the corresponding natural frequency of the plate in rad/sec. The non-dimensional frequency parameter is given by Eq. (2):
where is the flexure rigidity , is Young’s modulus of elasticity, is Poisson’s ratio, is thickness of the plate and is density of plate.
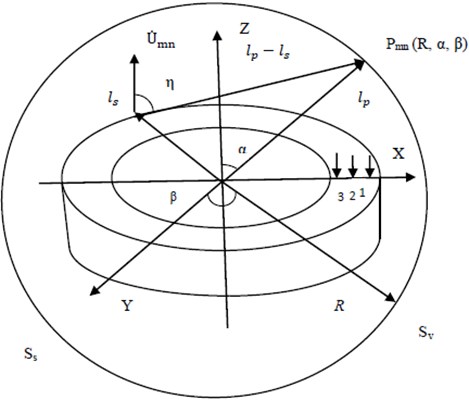
Fig. 1Acoustic radiation due to the vibration modes of unbaffled plate in Z direction enclosed in a sphere
2.2. Analytical and numerical solution for acoustic radiation from annular circular plate
The structure sound radiation obtained by Rayleigh integral [1] is given by Eq. (3):
where, is the sound pressure amplitude, is the surface of the sound source, is the Green function in free field, and is the position vectors of source and receiver and , is the surface normal vector at . If, is the mass density of air, is the speed of sound in air, is the corresponding acoustic wave number, and and are the corresponding vibratory velocity amplitude and spatial dependent vibratory velocity amplitude in the direction at . The sound pressure radiated from non-planar source in far and free field environment based on plane wave approximation can be expressed by Eq. (4):
The modal sound pressure for an annular plate with (, )th mode is obtained from simplifying Eq. (4) with Hankel transform and is expressed by Eqs. (5), (6):
where is Bessel function of order , (, ) are the cone and azimuthal angles of the observation positions, respectively, is the angle between the surface normal vector and the vector from source position to receiver position, and is the Hankel transform. According to the far field condition, in the denominator is approximated by where is considered to be radius of the sphere. If is acoustic intensity and is control surface then the modal sound power for the (, )th mode [1, 6] from the far-field is given by Eq. (7):
The radiation efficiency of the plate [1] is given by Eq. (8):
where, is the spatially average r.m.s velocity for two normal surfaces. Considering the plate thickness () effect, the sum of sound radiations [6] from two normal surfaces of the plate at ( 0.5 and –0.5) will represent the modal sound power which can be given by Eqs. (9)-(11):
where, the corresponding acoustic wave number of the (, )th mode is represented by , and in Eq. (10), (11) represent source side and opposite to source side. For numerical analysis, the plate is modeled in ANSYS with Plane 185 with 8 brick node element. FLUID 30 and FLUID130 elements are used to create the acoustic medium environment around the plate. The numbers of elements and nodes come out to be 11351 and 3091 respectively. A force of 1 N is applied at 1, 2 and 3 as shown in Fig. 1. The position chosen are 0.0069 m, 0.0345 m and 0.0621 m for these excitation locations. The air density 1.21 kg/m3 and at 20 °C, the speed of sound of air is 343 m/s. The structural damping coefficient of the plate is assumed as 0.01.
2.3. Thickness variation of the plate
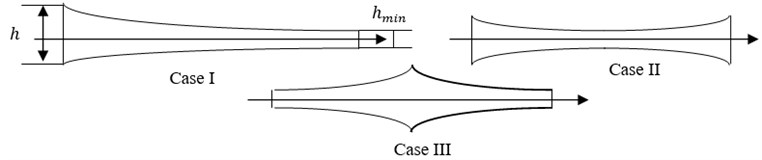
A thick annular circular plate with different parabolically varying thickness is considered for analysis and is reported in Fig. 2. The thickness of the plate is varied in radial direction by keeping the total mass of the plate constant. The plate thickness at radial direction is given by , where is considered to be maximum plate thickness and is considered to be an arbitrary function of ordinate . Where:
The taper parameter or taper ratio () is given by Eq. (13):
The equations for Case I (parabolically decreasing thickness), Case II plate (parabolically decreasing-increasing) and Case III plate (parabolically increasing-decreasing) thickness variation of (Fig. 2) are given by Eq. (14)-(16):
where, 2 for parabolic profile.
The total volume of the plate is kept constant and is given by Eq. (17):
Fig. 2Plate with different parabolic varying thickness variation
3. Results and discussions
3.1. Validation of modal frequency
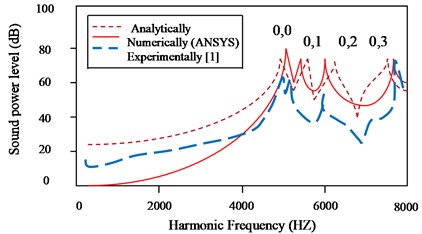
For validation of modal frequency of thick annular isotropic plate, the published result of Lee et al. [1] is taken as reported in Table 2. From Table 2 it is clear that the results obtained in this paper matches well with the published results [1]. For acoustic power calculation the computed analytical, numerical and experimental results [1] are considered as reported in Fig. 3. From Fig. 3, a well and good agreement of computed acoustic results obtained analytically, numerically with published experimental results [1] is seen and matches well with each other.
Table 1The specification and the material properties of the annular circular plate
Dimension of the plate | Isotropic annular circular plate |
Outer radius (m) | 0.1515 |
Inner radius (m) | 0.0825 |
Radii ratio, / | 0.54 |
Thickness ratio, / | 0.21 |
Density, (kg/m3) | 7905.9 |
Young’s modulus, (GPa) | 218 |
Poisson’s ratio, | 0.305 |
Table 2Comparison and validation of frequency parameter λ2 of isotropic annular circular unloaded plate for taper ratio, Tx= 0.00 obtained in present work with that of Lee et al. [1]
Plate | Mode | Non dimensional frequency parameter, | |
H. Lee et al. [1] | Present work | ||
Uniform unloaded plate 0.54 0.21 | (0, 0) | 13.61 | 13.4929 |
(0, 1) | 13.63 | 13.4946 | |
(0, 2) | 14.28 | 14.1185 | |
(0, 3) | 16.81 | 16.6681 | |
Fig. 3Analytical, experimental and numerical comparison of sound power level of unloaded plate having uniform thickness for taper ratio Tx= 0.00
3.2. Acoustic response solution of parabolic tapered plate for different taper ratios
The sound power level (dB, reference = 10-12 watts) of parabolic tapered annular circular plate at different excitation locations are investigated by applying concentrated load under time-varying harmonic excitations. The frequency range of 0-8000 Hz is taken. From Figs. 4(a)-(c) it is observed that for all cases of thickness variation and for excitation frequency up to 1000 Hz, effect of different excitation locations and stiffness variation due to taper ratio 0.75 do not have significant effect on sound paper radiation for clamped-free boundary condition.
Fig. 4Comparison of sound power level (dB) for: a) Case I plate, b) Case II plate, c) Case III plate having different parabolic thickness variation for different excitation locations for taper ratio Tx= 0.7
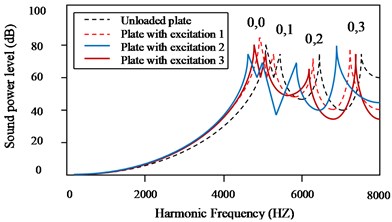
a) Case I plate (parabolic decreasing)
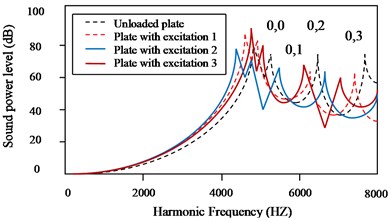
b) Case II plate (parabolic decreasing-increasing)
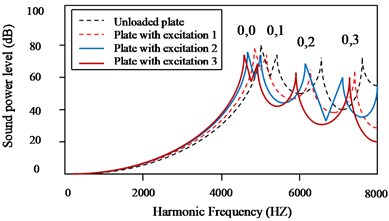
c) Case III plate (parabolic increasing-decreasing)
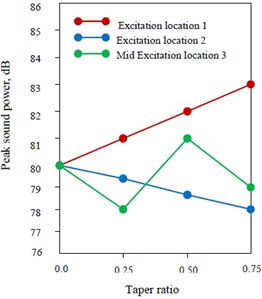
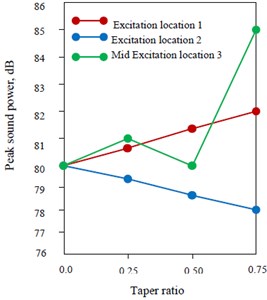
3.3. Peak sound power level variation with different taper ratio for all excitation locations
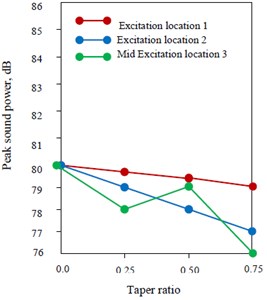
Peak sound power level for plate having different parabolic varying thickness for different taper ratio is shown in Figs. 5(a)-(c). Peak sound power level for all excitation locations is reported at first peak which corresponds to (0, 0) mode of the plate. It is clear that for Case I and Case II plates under excitation location 1 and 2 peak sound power level is maximum as well as minimum at 0.75 and for excitation locations 1 and 2 for Case III plate, peak is always minimum at 0.75. But under excitation 3 i.e. towards mid position, a variation of peak sound power level is observed for all cases of thickness variation. For Case I plate toward mid excitation, peak is minimum at 0.25 and maximum at 0.50. Similarly, for Case II plate, at mid excitation, highest peak sound power level is obtained at 0.75 and minimum at 0.50. Further, for Case III plate, under mid excitation, the lowest peak sound power level is obtained at 0.75 and maximum at 0.50. It is thus quite obvious that excitation location has significant impact on peak sound power level. Further excitation locations with different taper ratio provide us design options for peak sound power level. As for example, for peak sound power reduction, taper ratio 0.75 with excitation location 2 for Case I and II plate and 0.75 with mid excitation location for Case III plate may be the option. Similarly, for sound power actuation, taper ratio 0.75 with excitation location 1 for Case I plate towards outer radius and 0.75 for mid excitation location for Case II plate may be the another form of solution.
Fig. 5Peak sound power level (dB) for: a) Case I, b) Case II, c) Case III plate having different parabolic thickness variation
a)
b)
c)
4. Conclusions
The sound radiation behavior of a parabolic tapered annular circular plate in air medium with different taper ratio is analyzed. It is observed that excitation locations and modes variation have significant impact on sound power level in comparison to the stiffness variation due to taper ratio. It is further investigated that peak sound power level either decreases or increases purely depends on excitation locations and taper ratios. For excitation location 1 peak sound power level increases with taper ratios while for excitation location 2 it decreases with taper ratios for all cases of thickness variations. But for mid excitation, peak sound power level is seen to be fluctuated between maximum and minimum for all cases of thickness variations. Further, excitation locations with different taper ratio provide us design options for peak sound power level. For peak sound power reduction, taper ratio 0.75 with excitation location 2 for Case I and II plate and 0.75 with mid excitation location for Case III plate may be the option. Similarly, for sound power actuation, taper ratio 0.75 with excitation location 1 for Case I plate towards outer radius and 0.75 for mid excitation location for Case II plate may be the other solution.
References
-
Lee H., Singh R. Acoustic radiation from out-of-plane modes of an annular disk using thin and thick plate theories. Journal of Sound and Vibration, Vol. 282, Issues 1-2, 2005, p. 313-339.
-
Levine H., Leppington F. G. A note on the acoustic power output of a circular plate. Journal of Sound and Vibration, Vol. 121, Issue 5, 1988, p. 269-275.
-
Rdzanek Jr W. P., Engel Z. Asymptotic formula for the acoustic power output of a clamped annular plate. Applied Acoustics, Vol. 60, Issue 5, 2000, p. 29-43.
-
Wodtke H. W., Lamancusa J. S. Sound power minimization of circular plates through damping layer placement. Journal of Sound and Vibration, Vol. 215, Issue 5, 1998, p. 1145-1163.
-
Wanyama W. Analytical Investigation of the Acoustic Radiation from Linearly-Varying Circular Plates. Ph.D. Thesis, Texas Tech University, 2000.
-
Lee H., Singh R. Self and mutual radiation from flexural and radial modes of a thick annular disk. Journal of Sound and Vibration, Vol. 286, Issues 4-5, 2005, p. 1032-1040.
-
Lee M. R., Singh R. Analytical formulations for annular disk sound radiation using structural modes. Journal of the Acoustical Society of America, Vol. 95, Issue 6, 1994, p. 3311-3323.
-
Rdzanek W. J., Rdzanek Jr W. P. The real acoustic power of a planar annular membrane radiation for axially-symmetric free vibrations. Archives of Acoustics, Vol. 22, Issue 4, 1997, p. 455-462.
-
Hasegawa T., Yosioka K. Acoustic radiation force on a solid elastic sphere. Journal Acoustical Society of America, Vol. 46, Issue 5, 1969, p. 139-143.
-
Lee H., Singh R. Determination of sound radiation from a simplified disk brake rotor using a semi-analytical method. Noise Control Engineering Journal, Vol. 52, Issue 5, 2000, p. 225-238.
Cited by
About this article

