Abstract
Passive constrained layer damping (PCLD) is nowadays a general method for reducing vibrations. Constrained layer damping (CLD) is a very good technology in terms of reducing vibration energy. This paper deals with optimal damping of first three modes of a thin square cantilever plate by constrained viscoelastic layers which are positioned according to the nodal patterns of the mode. In essence, the CLD patches are cut according to the nodal patterns and then applied on to the bare plate. Thus, this approach uses prior information of the deformation patterns of the plate. The ABAQUS finite element analysis software was used to create viscoelastically damped plate models subjected to forced vibration. The direct steady-state dynamic analysis was used to obtain the frequency response functions from which the resonance frequencies of the models were derived. Vibration control using nodal pattern CLD patches is a better way to apply CLD treatment to a plate. This is because the mode shapes give good predictions of where the maximum strains are in the plate as well as the design and size of the damping patches required. It is believed that the methodology proposed in this research work is capable of providing good results.
1. Introduction
Vibration control is one of most important concern in a number of industries like in aerospace and automobiles. Passive damping technology that is using viscoelastic material (VEMs) and constraining layer (CLD) is usually used for to control the vibration effects. In passive constrained layer damping (PCLD), the viscoelastic material is sandwiched in between two of metallic layers.
The proposed methods so far give a rough idea about size and shape of adding damping material on base structure therefore, a more accurate process is required. Optimal design of applied damping material (ADM) to add on vibrating structures for getting the high damping ratio and loss factor values is always a major concern. So far now, thickness, ply orientation, material and geometric properties were taken in consideration for optimal design, but the exact shape of ADM require for suppressing the vibration energy is not determined. The optimization problem where the ADM material is optimized in terms of shape, size and position for to reduce the vibration levels is discussed in this article.
In Finite Element Analysis (FEA), modal methods are appreciably used in dynamics because for various models it reduces the runtime. Modal methods are significantly more flexible than direct methods when it comes to types of damping supported and the ability to accurately model frequency dependent damping. If damping is critically important for any structure, then the modal method in most of the cases is the preferred method. Mode shapes of vibrating base structure can be obtained by performing modal analysis on that structure. Hence, size and shape of the PCLD is determined by looking at the nodal patterns of these mode shapes. The reason for choosing mode shapes is that a structure LIKES deforming into its mode-shapes, so they end up being a good choice for finding the exact shape and size of ADM. These days, the problem for the design engineer is that ADM’s can be obtained only industrially in limited versions and therefore it is require to find the accurate shape of the applied damping material (ADM) patch. Through this method less amount of ADM is to be use, instead of covering the whole base structure or partially covering the structure via rough estimate. Modal methods are capable of accurate answers in a fraction of the time for models with many timesteps (for transient analysis) or frequency points (for frequency response) calculations relative to the number of shapes (mode shapes + static shapes).
2. Literature overview
Swallow [1] was the first, who introduced the idea of minimizing the structure vibration with constrained layer damping (CLD) treatment in 1939. Nashif A., Jones D., Henderson J. [2] proposed passive damping method approach for to minimize the vibration. It’s one of most common form of damping treatment, in which the energy dissipates in an effective way as the damping layer deforms in shear mode. DiTaranto R. [3] and Mead D., Markus S. [4] suggested that for bending and axial vibration the theoretical work on CLD (constrained layer damping) can easily find out. K Kishore Kumar and P Bangarubabu [5] observed that the beams with constrained viscoelastic layer, give higher loss factors values than unconstrained layer. However, the main problem of finding the optimum size of applied constrained layer damping material was not determined. Although, optimal design of attaching CLD on vibrating structures was one of important topic of research for maximizing the modal loss factor. Such optimal design for CLD can only be achieved by finding the optimal geometric parameters, optimal material and by minimizing the weight. Baz A., Ro J. [6] suggested the optimal design for constrained viscoelastic layer by considering the thickness parameter and the shear modulus. Marcelin J. [7] and Marcelin J., Shakhesi S., Pourroy F. [8] used the size and location as design variable for maximizing the loss factor for partially covered beams. Nokes D., Nelson F. [9] verified the Marcelin and Shahhesi S approach and concluded that their proposed optimization layout is significant in terms of using the amount of material for partial covered beam. Alvelid and Enelund [10] gave an existing (FE) finite-element mesh for the base structure, which is of huge interest to identify where to attach ADM for to reduce the vibration energy of the structure. J. F. A. Madeira and A. L. Araujo [11] used the geometric parameter thickness of CLD and laminates ply orientation as design variable for minimizing the vibration and maximizing the loss factor.
3. Modal method for dynamic analysis
Mode is a deformed shape of the vibrating structure with a corresponding frequency. The structure will deform because it absorbs all the energy which is applied by an excitation. It’s a property of a structure because it can be calculated without applying any type of load.
The purpose of this article is to first perform modal analysis on a base structure for finding those mode shapes and frequencies of the structure.
This analysis tells that at which frequency the vibrating structure will take in the maximum amount of energy applied to it and how the deformed shape of the structure looks like at that frequency.
By adding damping patch at the location where there is high strain energy density will have the large impact on the stiffness of that mode.
The direct steady state dynamic analysis was used to obtain the frequency response functions from which the resonance frequencies of the models were derived. This is used to determine which frequencies cause the most vibration. By adding optimal shaped damping patch at optimal location on those frequencies will suppress the corresponding mode of vibrating structure.
3.1. Finite element formulation
A cantilever square thin Aluminium plate is modeled using finite element (FE) approach in Abaqus Simulia. The plate is discretized using 20-noded solid elements, with three degrees of freedom at each node (i.e. C3D20R). A modal analysis is performed to get the deformed mode shapes and the first three eigen frequency values of the base plate. The shape of damping patches are defined according to the Nodal patterns of the corresponding mode shapes of vibrating base plate.
Number of damped plate models are made by adding optimum shaped PCLD (passive constrained layer damping) patches. These models are designed in such a way that each model consist of all the number of possible damped patches of corresponding mode. Finite element (FE) code is developed in Python for every damped model. After that a steady state dynamic analysis is performed on all damped plate models.
The FE code performed exhaustive search method approach for finding the optimal shape and location of damped patch out of all attached feasible damped patches. Then the FRF data for all damped models was imported into Matlab and graphs were plotted for comparison purposes. The loss factor for each resonance frequency was calculated using half power point method and then compared for each model.
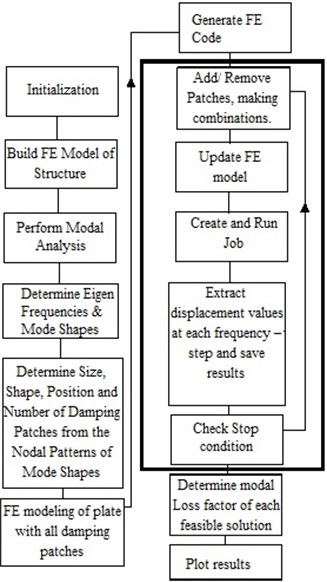
Fig. 1 is the flow chart of the method used in this research for optimization of feasible patches. Design variables are the shape and position of the ADM.
Fig. 1Flow diagram of the proposed method
4. Tables
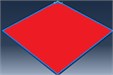
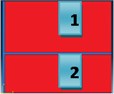
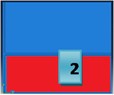
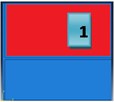
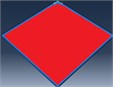
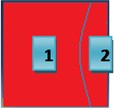
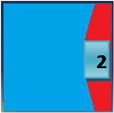
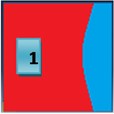
The Table 1 consists of first three natural frequencies of a square cantilevered plate and the corresponding mode shapes. Damping patches are modeled according to the nodal patterns of the mode shapes. It can be seen that first mode is a bending mode but has no nodal patterns, but the consecutive two modes do have nodal patterns. In figures of Table 1, the red color represents the vertical vibration of the plate out of the plane. Similarly, the blue color represents the vertical vibration of the plate into the plane.
Table 1Modal analysis of square plate
Mode | 1 | 2 | 3 |
Frequency (Hz) | 17.6521 | 42.4931 | 107.5883 |
Mode Shapes | 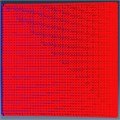 | 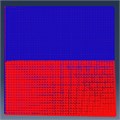 | 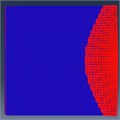 |
Table 2 shows the Loss factor and the frequency values of the plate with attached damping patch. The forced vibration response was predicted for each patch situation over a wide frequency range and then the host plate was fully covered, and the response was predicted.
The main aim was to find out how the mode shapes can be used to obtain the best location for the biggest vibration suppression for the second bending mode. If one looks at the Table 2 and Fig. 1, it can be seen that the highest loss factor is achieved for the second bending mode when plate is fully covered. But the Patch 1 configuration gives loss factor value as 0.0857, frequency deviation as 3 % and covers 50 % of the surface area of the host plate. It can be said that Patch 1 configuration gives good results in terms of less covered area and has frequency closer to that of the bare plate. Patch 1 also has good effect on other bending modes as well.
Table 2Frequency and Loss Factor values of different plate configurations of Mode two
Mode Number | 1 | 2 | 3 | |
 | Loss Factor | 0.0049 | 0.0088 | 0.0015 |
Frequency (Hz) | 17.6521 | 42.4931 | 107.5883 | |
 | Loss Factor | 0.0578 | 0.1445 | 0.0705 |
Frequency (Hz) | 16.5832 | 40.297 | 102.1312 | |
 | Loss Factor | 0.0520 | 0.0612 | 0.0673 |
Frequency (Hz) | 16.5052 | 39.2157 | 101.6222 | |
 | Loss Factor | 0.0255 | 0.0208 | 0.0346 |
Frequency (Hz) | 17.0931 | 40.7878 | 104.5408 | |
 | Loss Factor | 0.0315 | 0.0857 | 0.0423 |
Frequency (Hz) | 16.9463 | 40.9961 | 103.9718 |
Table 3 shows the Loss factor and the frequency values of the plate with attached damping patch. The forced vibration response was predicted for each patch situation over a wide frequency range and then the host plate was fully covered, and the response was predicted.
If one looks at the Table 3 and Fig. 2 it can be seen that the highest loss factor is achieved for the second bending mode when the plate is fully covered. But the Patch 1 configuration gives loss factor value as 0.0426, frequency deviation as 4 % and covers 90 % of the surface area of the host plate. It can be said that Patch 1 configuration gives good results in terms of less covered area and has frequency closer to that of the bare plate. Patch 1 also has good effect on other bending modes as well.
Table 3Calculated frequency and loss factor values of different jobs for Mode 3
Mode Number | 1 | 2 | 3 | |
 | Loss Factor | 0.0049 | 0.0088 | 0.0015 |
Frequency (Hz) | 17.6521 | 42.4931 | 107.5883 | |
 | Loss Factor | 0.0578 | 0.1445 | 0.0705 |
Frequency (Hz) | 16.5832 | 40.297 | 102.1312 | |
 | Loss Factor | 0.0466 | 0.0836 | 0.0446 |
Frequency (Hz) | 16.4432 | 39.8147 | 99.7115 | |
 | Loss Factor | 0.0162 | 0.0161 | 0.0056 |
Frequency (Hz) | 16.3456 | 40.4592 | 104.6022 | |
 | Loss Factor | 0.0453 | 0.0826 | 0.0426 |
Frequency (Hz) | 17.5022 | 41.4732 | 102.8609 |
5. Figures
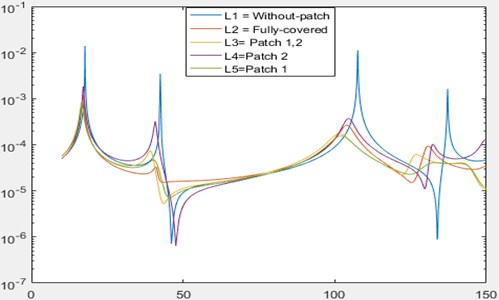
Figs. 2-3 show the comparison of frequency response function (FRF) of damped plate models of corresponding mode. It can be seen in Figure 2 that there are 5 curves in the graph and each curve represents different plate configuration. Optimal models of a Mode 2 and 3 are reducing the vibration level peak of a plate for other modes as well. The curve representing patch 1 shows that it is the best configuration to suppress the vibration s for Mode 2. A very small deviation in frequency from bare plate is observed when compared to other model configurations.
Fig. 2A comparison graph of Mode 2 plate configurations
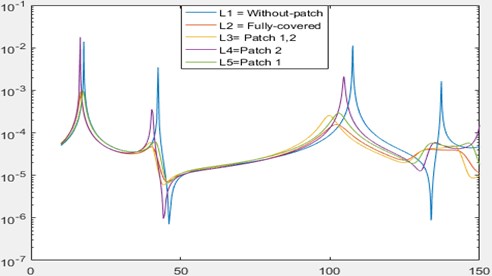
It can be seen in Fig. 3 that there are 5 curves in the graph and each curve represents different plate configuration. The curve representing patch 1 shows that it is the best configuration to suppress the vibrations for Mode 3. A very small deviation in frequency from bare plate is observed when compared to other model configurations.
Fig. 3A comparison graph of Mode 2 plate configurations
6. Conclusions
It is concluded that vibration level of a plate can be minimized by using passive vibration control method. It’s one of a cheaper method to suppress the vibration level peak of a plate. The PCLD approach used in this paper, gives not only the optimum shape of a patch but also gives the optimal location for attaching patch. It can be seen from Comparison tables and corresponding figures that the highest loss factor is achieved when plate is fully covered. But for Mode 2 the Patch 1 configuration gives high loss factor value less frequency deviation from original frequency and covers half of the host plate. Similarly, for Mode 3 the Patch 1 configuration gives higher loss factor value as well as less frequency deviation from the original frequency and covers 90 % of the surface area of the host plate. It can be said that Patch 1 configuration of both modes gives good results in terms of less covered area and has frequency closer to that of the bare plate. Patch 1 configuration of both Modes also has good effect on other bending modes as well. The optimal models have PCLD attached at the location where there is maximum strain energy. Also, less material is required for ADM to increase the model stiffness. The given results show that by covering the square Al plate with damping patch at an optimal location in an optimum shape is increasing the stiffness of the base model.
References
-
Swallow W. An Improved Method of Damping Panel Vibrations. British Patent Specification, 1939.
-
Nashif A., Jones D., Henderson J. Vibration Damping. Wiley-Interscience, 1985, p. 480.
-
DiTaranto R. Theory of vibratory bending for elastic and viscoelastic layered finite-length beams. Journal of Applied Mechanics, Vol. 32, Issue 4, 1965, p. 881-886.
-
Mead D., Markus S. The forced vibration of a three-layer, damped sandwich beam with arbitrary boundary conditions. Journal of Sound and Vibration, Vol. 10, Issue 2, 1969, p. 163-175.
-
Kishore Kumar K., Bangarubabu P. Damping in beams using viscoelastic layers. Proceedings of the Institution of Mechanical Engineers, Part L: Journal of Materials: Design and Applications, Vol. 229, Issue 2, 2015, p. 117-125.
-
Baz A., Ro J. Optimum design and control of active constrained layer damping. Journal of Vibration and Acoustics, Vol. 117, 1995, p. 135-144.
-
Marcelin J., Trompette P., Smati A. Optimal constrained layer damping with partial coverage. Finite Elements in Analysis and Design, Vol. 12, Issues 3-4, 1992, p. 273-280.
-
Marcelin J., Shakhesi S., Pourroy F. Optimal constrained layer damping of beams: experimental numerical studies. Shock and Vibration, Vol. 2, Issue 6, 1995, p. 445-450.
-
Nokes D., Nelson F. Constrained layer damping with partial coverage. Shock Vibration Bull, 1968.
-
Magnus Alvelida Optimal position and shape of applied damping material. Journal of Sound and Vibration, Vol. 310, Issues 4-5, 2008, p. 947-965.
-
Madeira J. F. A., Araujo A. L., Mota Soares C. M., Mota Soares C. A. Multiobjective optimization of viscoelastic laminated sandwich structures using the direct multisearch method. Computers and Structures, Vol. 147, Issue 15, 2015, p. 229-235.
About this article

