Abstract
The use of diesel cylinder head vibration signal for fault diagnosis must eliminate signal interference non-periodic and random components. The periodic components related to the working cycle of the diesel engine are retained, so as to achieve the purpose of fault feature extraction. A time-frequency correlation-based diesel engine fault feature extraction method is proposed in this paper. First, the Wavelet transform is applied to the vibration signals of diesel engines collected in three continuous working cycles to realize the time-frequency distribution of the signals. Then three time-frequency distributions are estimated by cross-correlation, so as to eliminate noise interference and extract periodic transient characteristics. The experimental results of simulation signals and real signals show that this method can effectively extract the periodic transient impact characteristics of diesel engines.
1. Introduction
The quality of diesel combustion state is directly related to power, economy and other performance indicators, and it is of great significance to detect its state in time and effectively. Diesel is a complex mechanical system, and the cylinder head of the impact signal includes a plurality of moving parts and internal combustion superposition of multiple excitation components. Vibration signal is a typical time-varying non-stationary signal. Therefore, it is necessary to adopt appropriate signal processing methods in order to effectively extract combustion characteristics of diesel engines and ensure the accuracy of detection and diagnosis [1].
The traditional Fourier transform is not available for non-stationary signals [2]. The Wigner-Ville distribution is suitable for the analysis of cross-interference in multi-component non-stationary signals [2]. Wavelet transform in non-stationary and time-varying signal has obvious advantages, and can automatically adjust the time window and frequency window size according to the characteristics of the signal to achieve frequency analysis signal, which has been widely applied in the field of fault diagnosis [3-5].
According to the characteristics of the diesel engine, a fault feature extraction method for diesel engine based on time-frequency correlation is proposed in this paper. First, the Wavelet transform is applied to the vibration signals of diesel engines collected in three continuous working cycles to realize the time-frequency distribution of the signals. Then three time-frequency distributions are estimated by cross-correlation. Finally, the time-frequency correlation estimation results are averaged, so as to eliminate noise interference and extract periodic transient characteristics. The experimental results of simulation signals and real signals show that this method can effectively extract the periodic transient impact characteristics of diesel engines.
2. Combustion feature extraction of diesel engine based on time-frequency correlation
2.1. Continuous wavelet transform
The continuous wavelet transform of signal is:
where is scale factor, and is translation factor. The time-frequency correlation of any two continuous working cycle signals and is:
Wavelet transform expands one-dimensional signal in time-frequency domain, and can analyze any details of signal change. The time-frequency correlation estimation of two working cycle signals based on wavelet transform can analyze the distribution of correlation in time-frequency domain. The transform coefficients of time-frequency correlation estimation indicate the correlation between the two signals in time-frequency domain. The larger the correlation value, the closer the correlation degree is.
Morlet wavelet is the most common complex wavelet, which is the single frequency reuse sine function under Gauss envelope and have a good local aggregation in the time domain and frequency domain. Therefore, Morlet function is selected as the basic wavelet function in this paper, whose expressions in time domain and frequency domain are:
Strictly speaking, Morlet wavelet is not finite supported and does not satisfy admissibility conditions. However, as long as the center frequency of the wavelet band pass filter is greater than 5 Hz, the condition is approximately satisfied. Generally, the center frequency is 6 Hz to ensure good local performance in time-frequency distribution. The time-frequency correlation spectrum can be expressed as:
2.2. Extraction of combustion characteristics of diesel engines
The main steps of diesel engine combustion feature extraction are as follows:
(1) According to the speed signal, the vibration signal is segmented according to the working cycle.
(2) Equal angle resampling is performed for each working cycle.
(3) The time-frequency correlation spectra between two consecutive signals of three working cycles are calculated.
(4) By accumulating and averaging the three time-frequency distributions, the combustion characteristic information of diesel engine can be obtained.
The periodic transient shock signal caused by diesel engine combustion exists in every working cycle, but the intensity is different. Through time-frequency correlation estimation, the time-frequency dependent periodic transient impulse components can be extracted. Other aperiodic components and random disturbances will be attenuated.
3. Experimental results
3.1. Simulation
In order to fully illustrate the feasibility of the proposed method, two simulation signals with 512 data lengths are established, as follows:
where is 300 Hz; is 450 Hz; is 700 Hz. The signal sampling frequency is 2000 Hz.
It can be seen from Forms 7 and 8 that both and have 450 Hz frequency components, and the occurrence time is the same. When strong noise is added, the difference between the two signals cannot be distinguished from the time domain waveform, as shown in Fig. 1.
Fig. 1Time domain waveform of simulation signal
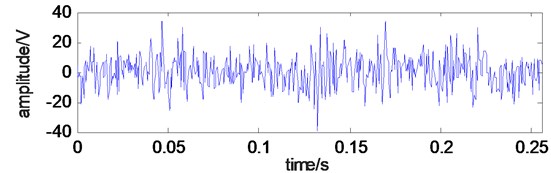
a)
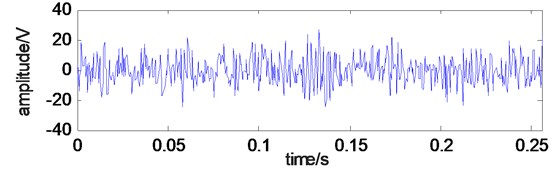
b)
Fourier transform is applied to the two signals, and the frequency components of the two signals are different from each other. However, the frequency composition is so complex that it is impossible to extract the characteristic components from the signal, as shown in Fig. 2.
Fig. 2Frequency domain waveform of simulation signal
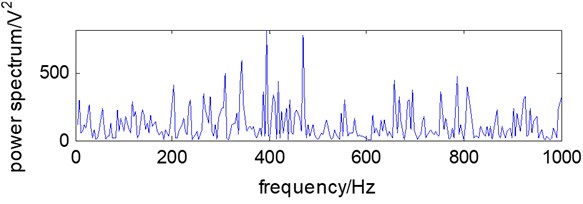
a)
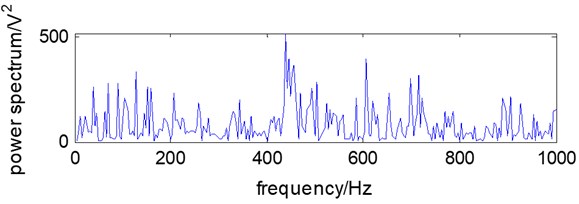
b)
Fig. 3The time-frequency distribution of the simulation signal
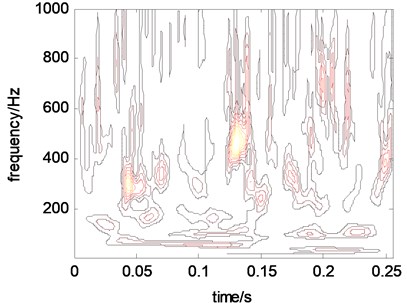
a)
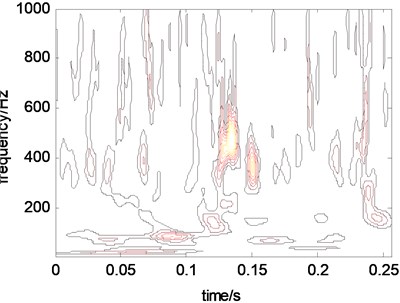
b)
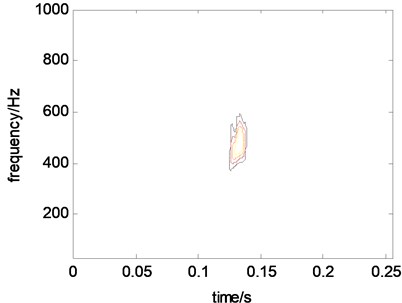
c)
Through the wavelet transform, the noise in the simulation signal is attenuated. Transient signal distribution can be seen in time-frequency diagrams, as shown in Figs. 3(a) and 3(b). However, there is still obvious noise interference in the time-frequency distribution. By estimating the time-frequency correlation between the two signals, the relevant characteristic components are extracted, while the non-related signals are attenuated or even eliminated, as shown in Fig. 3(c).
3.2. Experiment condition
The test object is HJ493 diesel engine. The performance parameters of the diesel engine are shown in Table 1.
Table 1Main performance parameters for HJ493 diesel engine
Number of cylinders | 4 | Total displacement | 2.771L |
Bore / stroke / compression ratio | 93 mm / 102 mm / 18.2 | Rated power / speed | 39 kw / 2500 r.min-1 |
Maximum torque / speed | 165 N.m / 180 r.min-1 | Ignition sequence | 1-3-4-2 |
A 601A01 ICP vibration sensor is installed on the cylinder head between the second cylinder and the third cylinder of the diesel engine. QSY8104 external card type high-pressure tubing pressure sensor is clamped on the first cylinder high-pressure tubing of diesel engine. The speed of the engine is measured by the oil pressure pulse signal of the high-pressure tubing and the position of the first cylinder stop point is measured. The signal sampling frequency is 12.8 kHz and the data sample length is 12288. Five working conditions of diesel engine are simulated by controlling the fuel supply of each cylinder injector: normal combustion state of diesel engine, poor combustion of the first cylinder, poor combustion of the second cylinder, poor combustion of the third cylinder and poor combustion of the fourth cylinder. Vibration signals of cylinder head surface were collected at 700 r/min of diesel engine speed under normal and abnormal conditions.
3.3. Experimental data processing
According to the proposed method, the vibration signals of cylinder head in five states are processed respectively. The results are shown in Fig. 4.
Fig. 4Time-frequency correlation estimation for five states
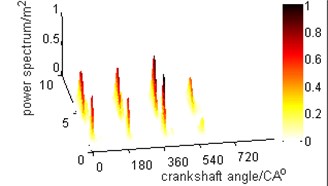
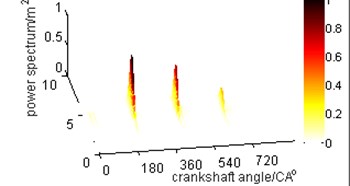
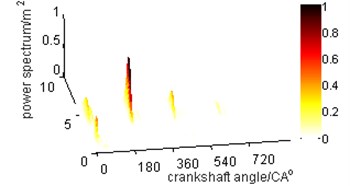
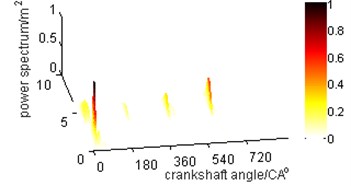
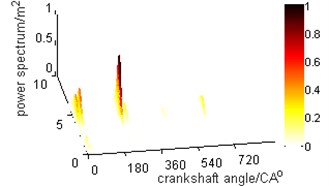
As can be seen from Fig. 4(a), the combustion states of the four cylinders are basically the same. From Fig. 4(b), it can be seen that the combustion state of cylinder 1 is quite different from that of other cylinders. From Fig. 4(c), it can be seen that the combustion state of cylinder 2 is quite different from that of other cylinders. From Fig. 4(d), it can be seen that the combustion state of cylinder 3 is quite different from that of other cylinders. From Fig. 4(e), it can be seen that the combustion state of cylinder 4 is quite different from that of other cylinders. The ratio of the energy of each cylinder to the total energy is calculated to quantitatively analyze the combustion state of each cylinder. The results of quantitative diagnosis of combustion state of each cylinder are shown in Table 2.
Table 2Energy proportion of cylinders in different combustion states
Cylinder number | 1 | 2 | 3 | 4 |
Normal combustion | 30 % | 21 % | 27 % | 22 % |
First cylinder misfire | 8 % | 15 % | 27 % | 50 % |
Second cylinder misfire | 41 % | 6 % | 26 % | 27 % |
Third cylinder misfire | 52 % | 26 % | 5 % | 17 % |
Fourth cylinder misfire | 34 % | 34 % | 25 % | 7 % |
As can be seen from Table 2, when a cylinder burns poorly, its energy will be significantly reduced, which can be used as a basis for fault diagnosis.
4. Conclusions
The feature extraction method of diesel engine combustion state based on time-frequency correlation transforms three continuous working cycle signals into two-dimensional time-frequency distribution through continuous wavelet transform. On this basis, the periodic transient feature of the signal is extracted by cross-correlation estimation of any two time-frequency distributions, and the periodic transient feature of combustion state is extracted. The combustion state of diesel engine is detected by the proposed method. The results show that the method can eliminate the non-periodic component and random interference in the cylinder head vibration signal. The detection and diagnosis of combustion state of diesel engine are realized.
References
-
Payri F., Luján J. M., Martín J., Abbad A. Digital signal processing of in-cylinder pressure for combustion diagnosis of internal combustion engines. Mechanical Systems and Signal Processing, Vol. 24, Issue 6, 2010, p. 1767-1784.
-
Ren G., Jide J., Jianmin M. An improved variational mode decomposition method and its application in diesel engine fault diagnosis. Journal of Vibroengineering, Vol. 20, Issue 6, 2018, p. 2363-2378.
-
Huo Z., Yu Z., Francq P., et al. Incipient fault diagnosis of roller bearing using optimized wavelet transform based multi-speed vibration signatures. IEEE Access, Vol. 5, 2017, p. 19442-19456.
-
Patil A. B., Gaikwad J. A., Kulkarni J. V. Bearing fault diagnosis using discrete wavelet transform and artificial neural network. International Conference on Applied and Theoretical Computing and Communication Technology, 2016.
-
Dong W., Yang Z., Cai Y., et al. Sparsity guided empirical wavelet transform for fault diagnosis of rolling element bearings. Mechanical Systems and Signal Processing, Vol. 101, 2018, p. 292-308.
About this article

