Abstract
Extracting the characteristics of rolling bearings in early weak failure stage before the occurring of complete failure has important safety and economic significance in engineering application. The wavelet transform (WT) is the commonly used and effective time-frequency method for fault feature extraction of rotating machinery due to that it could reflect the fault feature in time and frequency domains synchronously. However, WT would not work effectively when the impulsive fault signal is buried by strong background noise, and the situation is particularly serious in the early weak fault stage of rolling bearing. A frequency slice wavelet transform based on wavelet de-noising using neighboring coefficients method is proposed in the paper by combing frequency slice wavelet transform with wavelet de-noising using neighboring coefficient to solve the above problem: Firstly, the vibration signal of rolling bearing is de-noised by wavelet de-noising using the neighboring coefficients method. Then the frequency slice wavelet transform is applied on the de-noised signal, and satisfactory analysis results could be obtained. The effectiveness of the proposed method is verified by the vibration data of rolling bearing accelerated fatigue test. Besides, the analysis result of the same vibration data of rolling bearing accelerated fatigue test using Kurtogram method is also presented in the paper to verify the advantage of the proposed method.
Highlights
- A frequency slice wavelet transform method based on wavelet de-noising using neighboring coefficients was proposed in the paper.
- The proposed method had the advantage of stronger noise-resistance.
- The effectiveness and advantage of the proposed method were verified by the vibration data of rolling bearing accelerated fatigue test.
1. Introduction
The failure of rolling element bearing represents a high percentage of the breakdowns in rotating machinery [1], and it is meaningful to study effective fault diagnosis method of rolling bearing in ensuring the reliable running of machinery. Vibration analysis has been established as the most common and practical method for detecting the fault of rolling bearing [2], and different fault diagnosis methods basing on signal processing have been proposed in recent years [3-8]. However, most of them are invalid when the fault characteristic signals are buried by strong background noise. The diagnosis of rolling bearing early weak fault is not only difficult, but also is very hot, and the fault diagnosis of rolling bearing early weak fault has been attracted a lot of attention in recent years. Sparse representation [9, 10] is a promising tool for early weak fault feature extraction of the rolling bearing. However, there exist two problems: Firstly, the prior knowledge is needed to construct the predefined dictionary to match the objected signal. Secondly, the self-learning dictionary method of sparse representation is susceptible to interfering factors. To overcome the above two problems, a hierarchical discriminating sparse coding method for weak fault feature extraction of rolling bearings was proposed in paper [11], and the analysis results of simulation and experimental signals using the proposed method showed that the proposed method was robust to strong noise and ambient interferences. Random noise was utilized by vibration resonance also named as stochastic resonance method to detect the feature of the weak fault of rolling bearings in paper [12], and better performance was obtained by the proposed method compared with the other relating stochastic resonance methods. The Hilbert envelope and zero frequency resonator were combined in paper [13] to detect the weak impulse signal immersed in strong background noise. To overcome the shortcomings of variational mode decomposition such as the determination of the number of the decomposed modes, the selection of the balance parameter, a coarse-to-fine decomposing strategy was proposed for weak fault detection of rotating machines in paper [14]. In paper [15], the supervised orthogonal local fisher discriminant analysis was used as the feature reduction method for weak fault diagnosis of rolling bearings, and the diagnosis example demonstrated the advantage of the proposed over the other popular signal processing techniques. The weak feature caused by early fault of rolling bearing would be ignored by the traditional singular value decomposition (SVD) method, and a reweighted SVD method was proposed in paper [16] to overcome the above problem, and the robustness to heavy noise of the proposed method was verified through experiment. The convolutional restricted Boltzmann machine model was used as an unsupervised learning method for detecting the weak transient signals of rolling bearings [17], and the method was validated through two real bearing experiments.
There exists the problem of low computational efficiency in most of the above mentioned rolling bearing early weak fault diagnosis methods. Wavelet transform is a classical and effective time-frequency analysis method and there have been arising a lot of literatures relating to its using in fault diagnosis of rolling bearings. However, the fault feature extraction result of traditional wavelet transform would not be ideal when early weak fault arises in rolling bearings. Besides, the extraction result of traditional wavelet transform is also not intuitive enough. In the paper, an improved wavelet transform method named as frequency slice wavelet transform [FSWT] is proposed and used in fault diagnosis of bearing early weak fault, and the FSWT is based on wavelet de-noising using neighboring coefficients [WDUNC]. Compared with the traditional wavelet transform analysis method, the FSWT has the advantages of more noise resist and more intuitive feature extraction effect. The effectiveness of the proposed method is verified through the vibration data of bearing accelerated fatigue test. Besides, its advantage over the other bearing fault diagnosis method such as spectral kurtosis is also presented.
The paper is organized as follows. Section 2 is dedicated to the basis theory of WDUNC and the simulation verifying the effectiveness of WDUNC. The theory of FSWT is presented in Section 3. In Section 4, experiment and corresponding analysis results are showed. Comparison and conclusion are presented in Section 5 and 6 respectively.
2. WDUNC
The traditional wavelet threshold de-noising method is to determine a global threshold according to the different statistical rules of wavelet coefficients without considering the correlation between the adjacent wavelet coefficients. When wavelet coefficients contain feature information, the wavelet coefficient adjacent to it also contains some feature information. Therefore, the WDUNC method sets the threshold value of several adjacent wavelet coefficients (which are considered to have certain correlation) as a whole, and it can retain the characteristic information of the signal more effectively while filtering the noise compared with the traditional threshold processing methods.
The main steps of WDUNC are as follows:
(1) Apply discrete wavelet transform on the noised signal.
(2) The wavelet coefficients are grouped into blocks for each scale , and the length of each block is .
(3) The new coefficients are estimated and updated by the contraction rule for each block as follows:
The contraction factor is determined by the wavelet coefficients within the block as follows:
where is the parameter being used to adjust the threshold value. is the length of each block . is the standard deviation of , and is determined by using the following equation:
(4) The de-noised signal is obtained by applying inverse wavelet transform on the handled wavelet coefficients.
The correlation among the adjacent wavelet coefficients within the block with size of is taken into account while calculating the contraction factor . The block size is one of the key factors affecting the performance of WDUNC, and the is set as ( represents the length of the signal) in the paper according to the suggestion in literature [18].
The time-domain waveforms of rolling bearing simulated signal and the rolling bearing simulated signal added with noise are presented in Fig. 1(a) and (b) respectively. In Fig. 1(c), the de-noised signal of the signal presented in Fig. 1(b) using WDUNC is given, and it could be seen that satisfactory de-noising effect is obtained.
Fig. 1Rolling bearing simulated signal and noise-added signal: a) bearing simulated signal; b) bearing simulated signal added with noise; c) de-noised signal using WDUNC
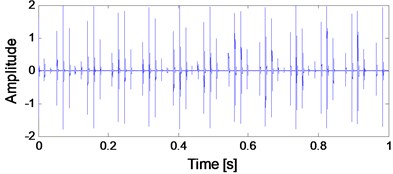
a) Bearing simulated signal
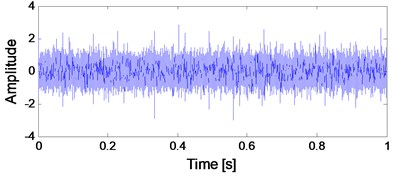
b) Bearing simulated signal added with noise
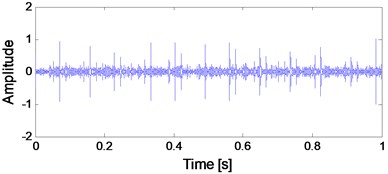
c) De-noised signal using WDUNC
3. The theory of FSWT
3.1. FSWT
Supposing signal , and if the FFT of the generating wavelet function exists which is represented by , and the FSWT of signal could be calculated by Eq. (4):
where and represent the scale factor and energy coefficient respectively, and both of them could be constant or the functions relating toand. represents the frequency domain form of the generating wavelet function , and wavelet function is the scaling and translation result of in the frequency domain. represents the conjugate function of .
Eq. (4) could be transformed into time-domain as shown in Eq. (5) using Parseval equation:
In fact, Eq. (5) is difficult to be defined in the frequency domain even if and are known. So only is focused in the signal processing process and is defined as frequency slice function which satisfies the following conditions:
(1) or .
(2) .
(3) .
(4) , or .
3.2. The selection of scale factor in FSWT
Let 1 and suppose the scale factor , , then there exists the following equation:
Import frequency slice function into and use to adjust the transformation sensitivity to frequency or time, then Eq. (5) is changed into Eq. (7):
It is impossible to obtain high resolution in both time and frequency domain due to the limitation of Heisenberg uncertainty principle. Therefore, a compromise scheme is adopted in the transformation process to estimate and , and two evaluation indexes are introduced to the analyzed signal. One of the evaluation indexes is frequency resolution which could be calculated by Eq. (8):
The other evaluation index is amplitude expected response ratio (), and the value of it could be set as , 0.5, 0.25 and so on.
Suppose and its FSWT satisfies the following relational expression:
Then:
That is:
As for the impulsion function , its FSWT satisfies the following relational expression:
Then:
That is:
where .
When the slice function and the following relational expressions could be obtained:
where and .
Fig. 2Two and three-dimensional FSWT analysis results of the simulation signal presented on Fig. 1(a)
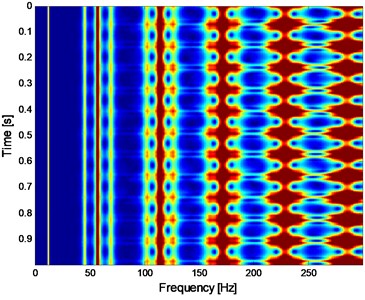
a) Two-dimensional FSWT analysis result of the simulation signal presented on Fig. 1(a)
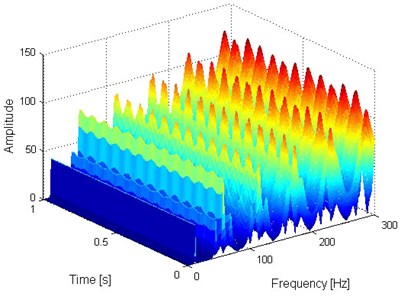
b) Three-dimensional FSWT analysis result of the simulation signal presented on Fig. 1(a)
The FSWT could realize the time and frequency analysis of the signal simultaneously, and the two and three-dimensional FSWT analysis spectrums of the signal shown in Fig. 1(a) are presented in Fig. 2(a) and (b) respectively from which intuitive fault feature extraction results are obtained.
4. Experiment
It is a complicated process from the installation and use of rolling bearings to their failure, and there is great safety and economic significance to study the effective feature extraction method in its early weak fault stage. The vibration signal of rolling bearing life cycle being collected from the ABLT-1A bearing life-cycle strengthening test rig of Hangzhou Bearing Experiment Center is the study object of the paper. The test rig is shown in Fig. 3 and the whole life test data of one of the test bearings is selected as the analysis object. The parameters and fault characteristic frequencies [FCF] of experimental bearings are shown in Tables 1 and 2 respectively: the FCFs in Table 2 are obtained by using the Eqs. (17-21):
Severe pitting failure was found in the inner ring of the test bearing after its complete failure, which is shown in Fig. 4.
Fig. 3The test rig
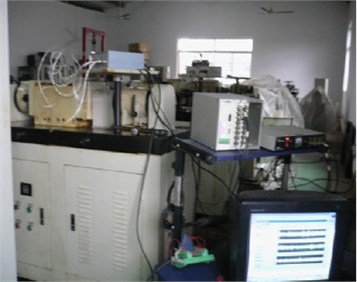
Fig. 4The inner race fault
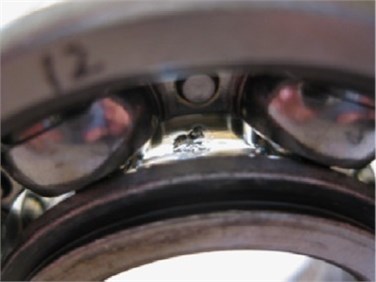
Table 1Parameters of the test bearing
Type | Ball number | Ball diameter (mm) | Pitch diameter (mm) | Contact angle | Motors speed (rpm) | Load (kN) |
6307 | 8 | 13.494 | 58.5 | 0 | 3000 | 12.744 |
Table 2Fault characteristic frequencies of the test bearing
50 Hz | 19 Hz | 102 Hz | 246 Hz | 153 Hz |
In papers [19, 20], the RMS curve over the whole life of the test bearing is given. The kurtosis index curve of the same selected test bearing is shown in Fig. 5 in the paper for the reason that the kurtosis index is more sensitive to the impact characteristic of the rolling bearing when fault occurs.
Fig. 5Kurtosis index of the test bearing over its whole life
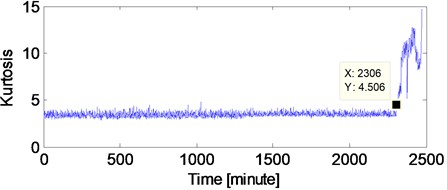
It could be seen that abrupt change of the kurtosis index occurs at 2306th minutes in Fig. 5 which means that 2306th is the very moment of complete failure occurring. Same as paper [23], the set of data at 2297th minute before the occurring of complete failure is analyzed by the proposed method because 2297th minute could be regarded as the early weak fault stage of the selected test bearing. However, the kurtosis value at 2297th minute in Fig. 5 does not change abruptly, so the kurtosis index could not reflect its weak fault characteristics. The time domain diagram and the corresponding envelope demodulation spectrum of the original data at 2297 minutes are shown in Figs. 6.
Fig. 6Time-domain waveform of the selected bearing’ data at 2297th minute with the corresponding envelope demodulation spectral
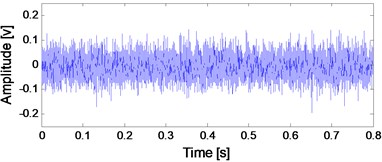
a) Time-domain waveform of the selected bearing’ data at 2297th minute
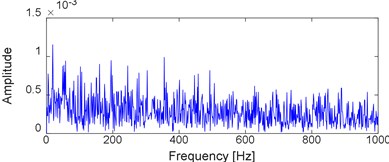
b) Envelope demodulation spectral of the signal shown in Fig. 6(a)
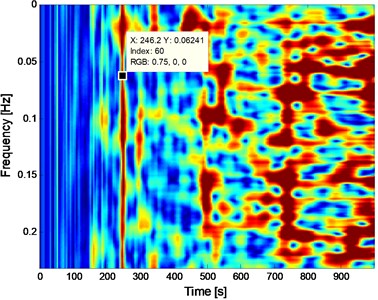
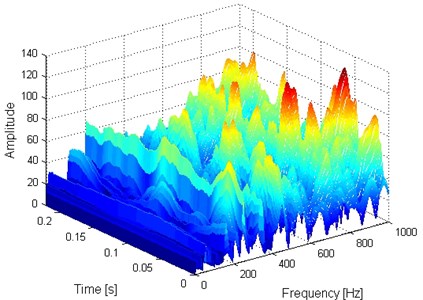
Fig. 7Two and three-dimensional FSWT analysis results of the signal presented on Fig. 6(a)
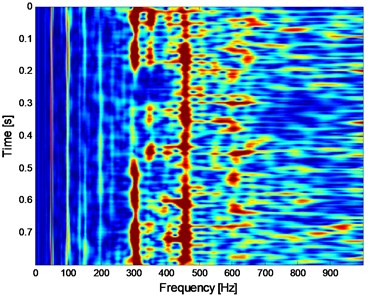
a) Two-dimensional FSWT analysis result of the signal presented on Fig. 6(a)
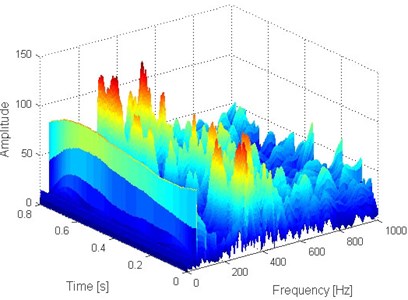
b) Three-dimensional FSWT analysis result of the signal presented on Fig. 6(a)
It is impossible to extract the inner race fault characteristic frequency (FCF) 246 Hz according to Fig. 6(b), which indicates that the early weak fault characteristic frequency of rolling bearing could not be extracted by the traditional envelope demodulation spectrum. Apply FSWT analysis on the signal shown on Fig. 6(a) and the two and three dimensional FSWT spectral are presented in Fig. 7(a) and (b) respectively. Same as envelope demodulation spectral analysis result, the FCF of rolling bearing still could not be extracted based on Fig. 7. Apply the proposed method on the signal shown in Fig. 6(a): Firstly, de-noise the signal shown in Fig. 6(a) using WDUNC method and the de-noised signal is presented in Fig. 8 from which the fault impact characteristics of rolling bearing could be identified. Then apply FSWT on the signal shown in Fig. 8 and the two and three-dimensional FWST spectral analysis result are shown in Fig. 9(a) and (b). The FCF of rolling bearing inner race is extracted successfully based on Fig. 9(a) which illustrates the effectiveness of the proposed method: the frequency of 246.2 Hz as noted in Fig. 9(a) is just right the inner race FCF of the test bearing as shown in Table 2, and the slight difference between 246.2 and 246 is due to the random sliding of rolling elements.
Fig. 8Time-domain waveform of the de-noised signal presented on Fig. 6(a) using WDUNC
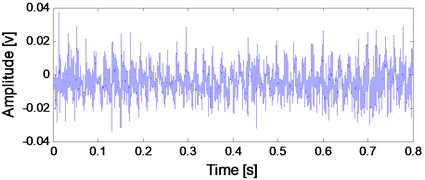
Fig. 9Two and three-dimensional FSWT analysis results of the signal presented on Fig. 8
a) Two-dimensional FSWT analysis result of the signal presented on Fig. 8
b) Three-dimensional FSWT analysis result of the signal presented on Fig. 8
5. Comparison
In the section, the spectral kurtosis method is selected for the comparison purpose to verify the advantage of the proposed method. SK is very suitable for feature extraction of impact signals when rolling bearings fail, and it has been used widely in fault diagnosis of rolling bearings [21]. Apply SK analysis on the signal shown in Fig. 6(a) and the corresponding SK kurtogram is given in Fig. 10. Then, construct a band-pass filter using the optimal parameters obtained by Fig. 10: Band width () = 2133.3 Hz and frequency center () = 1066.6 Hz. Afterwards, filter the signal shown in Fig.6 (a) and the envelope and envelope demodulation spectrum of the filtered signal are shown in Fig. 11(a) and (b) respectively, and it is evident that the SK analysis result is poor compared with the analysis result using the proposed method: the inner race FCF (246 Hz) of the test bearing could not observed in Fig. 11(b).
Fig. 10Kurtogram of SK of the original signal shown on Fig. 6(a)
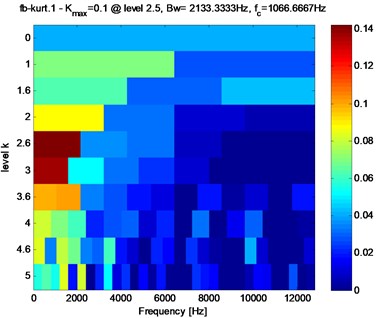
Fig. 11Envelope of the filtered signal and corresponding demodulation spectrum
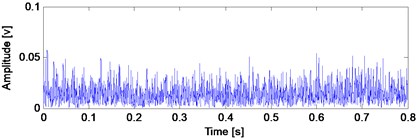
a) The envelope of filtered signal
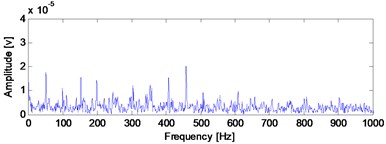
b) The FFT of the envelope of filtered signal
6. Conclusions
To solve the difficulty in extracting the early weak fault features of a rolling bearing and the disadvantage of the worse effect in extracting fault feature under strong noise interference by using FSWT, the paper combines the WDUNC with FSWT to extract the features of the weak fault signal of the rolling bearing. The combined method not only could extract the fault feature of bearing early weak fault successfully, but also could express the fault feature result much more intuitive, and the effectiveness of the proposed method is verified through the rolling bearing whole life cycle fatigue experiment. Besides, its advantage over the other signal rolling bearing signal processing method such as SK is also presented. The proposed method provides a new idea for time-frequency analysis of early weak fault signal of rolling bearing.
Besides, the following conclusions could be summarized:
1) The features of rolling bearing’ early weak fault are hard to extract using the traditional rolling bearing signal processing methods such as envelope demodulation method due to the strong background noise interference. Besides, the relatively new rolling bearing signal processing method such as SK is also ineffective in feature extraction of rolling bearing because the optimal band-pass filter is hard to be constructed by using SK when there exists strong background noise.
2) Time-frequency analysis is a comprehensive rolling bearing signal processing method because it could reflect the fault feature in the time and frequency domains simultaneously. However, it would work effectively when the impulsive characteristic of fault bearing is buried by strong background noise. So, it is better to de-noise the noised signal before applying time-frequency analysis on the vibration signal.
References
-
White G. D. Introduction to Machine Vibration. DLI Engineering Corporation, 1997.
-
Tandon N., Choudhury A. A review of vibration and acoustic measurement methods for the detection of defects in rolling element bearings. Tribology International, Vol. 32, 1999, p. 469-480.
-
Mcfadden P. D., Smith J. D. An explanation for the asymmetry of the modulation sidebands about the tooth meshing frequency in epicyclic gear vibration. Proceedings of the Institution of Mechanical Engineers Part C Mechanical Engineering Science, Vol. 199, 1985, p. 65-70.
-
Wang W. J., Mcfadden P. D. Early detection of gear failure by vibration analysis I. Calculation of the time-frequency distribution. Mechanical Systems and Signal Processing, Vol. 7, 1993, p. 193-203.
-
Baydar N., Ball A. A comparative study of acoustic and vibration signals in detection of gear failures using Wigner-Ville distribution. Mechanical Systems and Signal Processing, Vol. 15, 2001, p. 1091-107.
-
Antoni J., Bonnardot F., Raad A., et al. Cyclostationary modelling of rotating machine vibration signals. Mechanical Systems and Signal Processing, Vol. 18, 2004, p. 1285-1314.
-
Inalpolat M., Kahraman A. A theoretical and experimental investigation of modulation sidebands of planetary gear sets. Journal of Sound and Vibration, Vol. 323, 2009, p. 677-696.
-
Antoni J. Cyclic spectral analysis of rolling-element bearing signals: facts and fictions. Journal of Sound and Vibration, Vol. 304, Issues 3-5, 2007, p. 497-529.
-
Huang W. T., Sun H. J., Luo J. N., et al. Periodic feature oriented adapted dictionary free OMP for rolling element bearing incipient fault diagnosis. Mechanical Systems and Signal Processing, Vol. 126, 2019, p. 137-160.
-
Sun R. B., Yang Z. B., Zhai Z., et al. Sparse representation based on parametric impulsive dictionary design for bearing fault diagnosis. Mechanical Systems and Signal Processing, Vol. 122, 2019, p. 737-753.
-
Jiao J. Y., Zhao M., Lin J., et al. Hierarchical discriminating sparse coding for weak fault feature extraction of rolling bearings. Reliability Engineering and System Safety, Vol. 184, 2019, p. 41-54.
-
Xiao L., Zhang X. H., Lu S. L., et al. A novel weak-fault detection technique for rolling element bearing based on vibrational resonance. Journal of Sound and Vibration, Vol. 438, 2019, p. 490-505.
-
Kumar K., Shukla S., Singh S. K. A combined approach for weak fault signature extraction of rolling element bearing using Hilbert envelope and zero frequency resonator. Journal of Sound and Vibration, Vol. 419, 2018, p. 436-451.
-
Jiang X. X., Wang J., Shi J. J., et al. A coarse-to-fine decomposing strategy of VMD for extraction of weak repetitive transients in fault diagnosis of rotating machines. Mechanical Systems and Signal Processing, Vol. 116, 2019, p. 668-692.
-
Li F., Wang J. X., Chyu M. K., et al. Weak fault diagnosis of rotating machinery based on feature reduction with supervised orthogonal local fisher discriminant analysis. Neurocomputing, Vol. 168, 2015, p. 505-519.
-
Zhao M., Jia X. D. A novel strategy for signal denoising using reweighted SVD and its applications to weak fault feature enhancement of rotating machinery. Mechanical Systems and Signal Processing, Vol. 94, 2017, p. 129-147.
-
Chen L. T., Xu G. H., Wang Y., et al. Detection of weak transient signals based on unsupervised learning for bearing fault diagnosis. Neurocomputing, Vol. 314, 2018, p. 445-457.
-
Qu W. W., Gao F. Study on wavelet threshold denoising algorithm based on estimation of noise variance. Journal of Mechanical Engineering, Vol. 46, Issue 2, 2010, p. 28-33.
-
Wang Z. Y., Chen J., Dong G. M., et al. Constrained independent component analysis and its application to machine fault diagnosis. Mechanical Systems and Signal Processing, Vol. 25, 2011, p. 2501-2512.
-
Ming Y., Chen J., Dong G. M. Weak fault feature extraction of rolling bearing based on cyclic Wiener filter and envelope spectrum. Mechanical System and Signal Processing, Vol. 25, 2011, p. 1773-1785.
About this article

This work was supported by the National Nature Science Foundation of China (U1804141), and the Key Scientific and Technology Research Projects of Henan Province (192102210105).
