Abstract
The fault detection of rotating electrical machines has become very attractive field of research from vibrational aspect, because these machines are susceptible to failure due to thermal, electrical, mechanical or environmental stresses. Therefore, the vibrational analysis of generators as rotating machines will be beneficial for the generator design in the initial stage and also for online monitoring and faults diagnostics during generator operation. This paper presents a novel methodology for hammer impact testing („bump-test“) of stators end-winding vibrations with an accent on the influence of the physical parameters such as temperature. Introductory, a brief survey of recent research in the area is presented. Furthermore, a detailed description of the used instrumentation and conducted testing methodology according to established standards is systematically exposed. The measurement methodology is implemented on two generators, a cold one in its‘ repairing phase and second identical, generator in a warm condition in order to detect the damaged elements and to investigate the influence of the temperature on the dynamic characteristics (natural frequencies and rigidity) of the structures. A year later, series of same measurements on one of the generators during a process of its’ cooling were conducted. This work provides graphical, as well as numerical results for the dynamical behaviour of the structures under different thermal conditions. Ultimately, a conclusion for the dependence between the temperature and the dynamics parameters of the generator is drawn.
Highlights
- This paper presents a novel methodology for hammer impact testing („bump-test“) of stators' end-winding vibrations with an accent on the influence of the physical parameters such as temperature.
- The aim of this measurement is to provide values for the natural frequencies of the same phase leads from the two theoretically identical generators which are in a different temperature state.
- The natural frequencies of the phase leads increase with the reduction of temperature due to the increase of their rigidity.
- The connection between the natural frequency as dynamical and the temperature as a physical one, will lead to a more aware and accurate monitoring of the rotating machines.
1. Introduction
The operating electrical machines often are very liable to be harmed by processes from vibrational nature caused by thermal, electrical, mechanical or environmental stresses which are in details discussed in [1, 2]. Having in mind the fact that the amount of electrical generators in the world is around 16 billion, extensive research in new and modern techniques in condition monitoring and fault diagnostics for the electrical machines are very beneficial [3, 4]. The most complex part of a generator to design, but also to fabricate and sustain is the end-winding region of the stator which is very submissive to failure due to vibrations [5-7]. The end-winding provides safe electrical connections between bars and prevents insulation failure between the connection points. The dynamic response of stator end-winding bars resulting in vibration can be caused by the electromagnetic frequency at twice power frequency (100 Hz) [7, 8]. The complete stator end windings system can be considered as a mechanical spring-mass-damper system, and therefore they all have specific natural frequencies that depend on their rigidity and mass. The rigidity of the windings largely determines the value of the natural frequency of the structure and during a longer period of time, the insulation and supports can become loose and their rigidity can become weaker [9]. Stator windings that show natural frequencies in the resonant region around 100 Hz will behave with enlarged amplitudes, if not properly damped or braced. Another aspect that affects generators safe operation is the heating and cooling process. The heating produced in the generator influences its’ electromagnetism performance and electrical insulation which may result in a short circuit between the wires and serious damages during long-term operation [10]. Detailed and extensive research work on the stator temperature field in a generator has been done in [11]. In [12] the measurement procedure, measurement system and some conclusions that occurred during the temperature measurement in order to determine the influence of excitation winding on armature windings during different operation points is described. In some cases, high levels of vibration can be detected by visual inspection, with observance of dusting and greasing. For all other situations, many experimental, analytical, and numerical methods have been utilized in order to inspect the dynamic behaviour of the stator end windings [13]. During the last two decades, the sensor technology and supporting software has entered the industry by offering various problem monitoring and detecting methods. The two primary experimental methods to detect end-winding vibration are the hammer impact testing or also known as “bump test” and on-line monitoring [14, 17]. The instrumentation required and the procedure for hammer impact testing of a structure are explained in detail in [15, 16]. On the other hand, the online monitoring method is based on using fiber-optic accelerometers which are profoundly explained in [15, 17].
In Section 2 of this paper a description of the considered problem in the hydro-generator will be described, followed by Section 3 and 4 where the methodology and description of a used instrumentation for a conducted impact hammer testing of end-winding vibrations are explained. In Section 5, the results from the measurements and a discussion will be presented. At the end, concluding remarks and intentions for future work in the field will be pointed out.
2. Problem identification
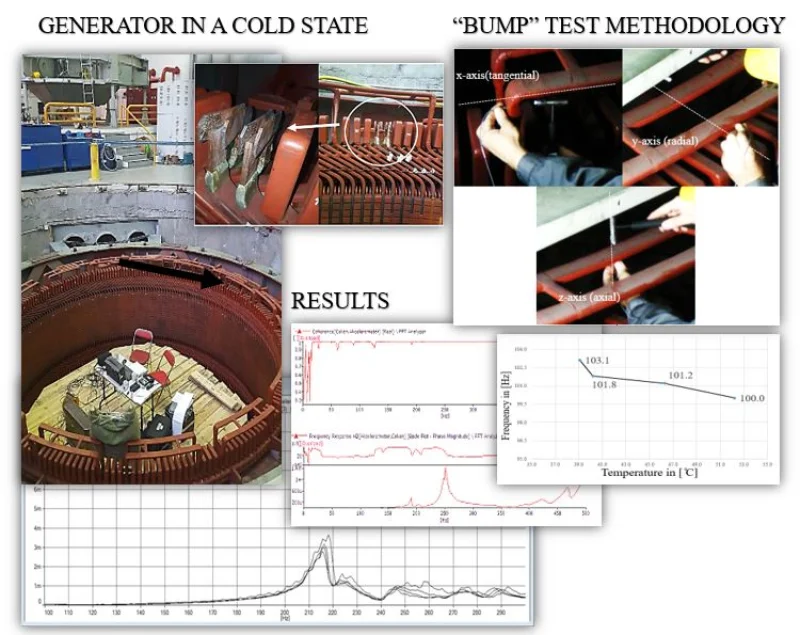
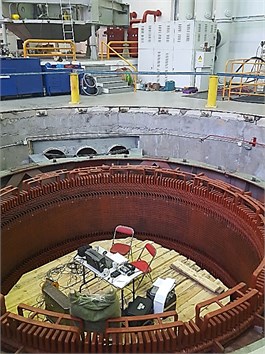
In one of the two synchronous hydro-electrical generators in a hydro powerplant in the country, an insulation problem with the series loop caps of the stator occured. Immediately after this problem was noticed, the repairing phase of generator started (Fig. 1).
Fig. 1View of the generator stator in a repairing phase
Since a lot of the problems in generators occur in the stator electrical connections, for insulating each bar from another and preventing insulation failure, an insulating material is used. Each bar is covered with a wedge slot (Fig. 2) which provides insulation, tightness and higher rigidity by preventing movement of the parallel phase leads in radial direction.
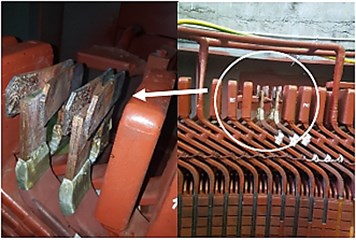
The vibrations of the bars generally may occur due to the main external exciting force which is the electromagnetic frequency (100 Hz). Very often as in this case can come to insulation damage because of enlarged vibration of the parallel phase leads and series loop caps in the resonant region of 100 Hz (Fig. 3).
There are several developed diagnostic methods to examine the status of the end-winding vibration. This is made so that the natural frequency of each parallel phase lead and series loop cap is controlled by performing an impact hammer testing. The essence is that if the rigidity of the bars is deteriorated, the bar is vibrating with a lower frequency since the mass remains the same. If the natural frequency of the measured phase lead or cap is very close to the electromagnetic frequency (100 Hz), typically that means that there might occur a resonance problem.
Fig. 2Slot wedges between the bars
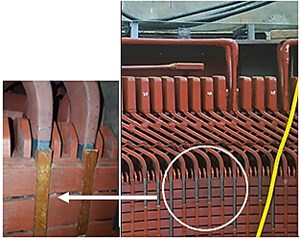
Fig. 3Failure of caps and hoop strengths in the generator during the repairing phase
3. Measurement instrumentation
The impact hammer test also known as “bump test” involves striking the end-winding with an impact hammer and measuring the response of the end-winding with an accelerometer at several predefined locations on the structure. Also, the instrumentation for impact hammer testing involves a data acquisition unit for receiving and processing the signal information from the hammer and the accelerometer and a lap-top for visually displaying the results. The used equipment used for this test is specified in the following Table 1.
Table 1Used equipment for the bump testing
Type | Quantity | |
Impact hammer | 8206, Brüel & Kjær | 1 |
Accelerometer | 4526, Brüel & Kjær | 1 |
FFT analyzer of the dynamic signal | 3560-B-040, Brüel & Kjær | 1 |
PULSE 5.0 software | Brüel & Kjær | 1 |
Cable | BNC-BNC type AO-0087-D | 2 |
A calibrated hammer is needed in order to “bump” the structure with an impulse excitation and measure the normalized magnitude of the impact force with a transducer mounted in the hammer. For this measurement Brüel & Kjær type 8206 is used. The manufacturer provides three changeable tips for the hammer, all made from different materials (steel, plastic and silicone) and also an additional mass of 40 grams. Criteria upon which tip of the hammer is chosen or when the additional mass is used are explained in details in ISO 7626:1. For this measurement was chosen the plastic tip and the additional mass was not used.
The uni-axial accelerometer is Brüel & Kjær type 4526 which is bonded by hand to the parallel phase leads/series loop caps while the hammer impacting is conducted. In order to process the information received from the hammer and the accelerometer, a Brüel & Kjær, type 3560-B-040 Fast Fourier Transform (FFT) data acquisition unit is used. This analyser of dynamic signal can respond to frequencies up to about 25.6 kHz to simultaneously capture the real-time force input and the accelerometer response producing frequency response transfer functions, coherence and phase spectra for analysis.
The results are visualized and can be processed by using the PULSE 5.0 software by Brüel&Kjær. PULSE is a platform for noise and vibration analysis. It can conduct real-time measurements on over 200 channels and recordings and post-analysis on over 300. The connection between the hammer and the accelerometer with the acquisition unit is provided by two cables BNC-BNC type AO-0087-D.
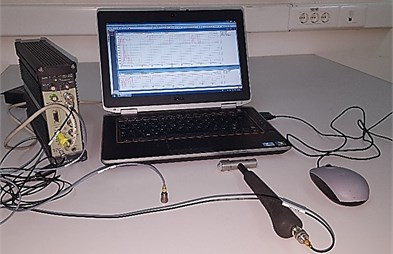
The instrumentation setup in a laboratory conditions is shown in Fig. 4.
Fig. 4Instrumentation setup consisting of impact hammer, accelerometer, data acquisition unit and lap-top
4. Measurement methodology
As before mentioned, an impact hammer testing is conducted to measure the natural frequencies of the parallel phase leads and series loop caps in order to check if they behave in the resonant region of around 100 Hz. The measurement methodology was defined and created in accordance with ISO 7626 which defines the basic terms and specifies the impedance heads, force transducers and motion response transducers for use in measuring mechanical mobility. It provides guidelines for the selection, calibration and evaluation of instruments for their suitability in making mobility measurements. Procedures for carrying out mobility measurements in various circumstances are discussed in subsequent parts of the standard. ISO 7626-5:2011 specifies procedures for measuring mechanical mobility, acceleration or dynamic compliance of structures excited by means of a translational impulsive force generated by an exciter which is not attached to the tested structure. The signal analysis methods covered are all based on the discrete Fourier transform.
The aim of this measurement was to provide values for the natural frequencies of the same phase leads from the two theoretically identical generators which are in a different temperature state, compare them and then come up with a dependence of the dynamic parameters (natural frequency and rigidity) from the temperature. The considered hydro power plant contains two synchronous hydro-electrical generators where the first generator has been in a working state, because the methodology can be implemented during the generators operating phase in order to maintain the high temperature of the generator. The second one was in a repairing phase which and on a lower temperature than the first one [18]. The main external exciting force that effects on the dynamic response of stators parallel phase leads which results in vibration is the electromagnetic frequency at twice power frequency (100 Hz). The measured temperatures of the two generators are given in Table 2.
Table 2Measured temperature of the generators
Generator temperature | G1 | G2 | ||
Loop cap | Phase leads | Loop cap | Phase leads | |
Before the measurement | 9,0° | 8,4° | 50,8° | 49,2° |
After the measurement | 8,9° | 8,2° | 43,4° | 42,6° |
Furthermore, the points where the impact with the hammer are implemented and the accelerometer will be placed were defined. The measurement points need to provide information about the natural frequencies in three directions: tangential (-axis), radial (-axis) and axial (-axis) as shown in the Fig. 5 [18].
Fig. 5Directions of measurement of parallel phase leads from [18]
![Directions of measurement of parallel phase leads from [18]](https://static-01.extrica.com/articles/20996/20996-img5.jpg)
In Fig. 6 [18] are shown the measurement points on the parallel phase leads (white) and loop caps (blue) where the impact with the hammer was made and where the accelerometer was positioned.
Fig. 6Measurement points of parallel phase lead from [18]
![Measurement points of parallel phase lead from [18]](https://static-01.extrica.com/articles/20996/20996-img6.jpg)
5. Measurement results
According to ISO 7626:1 and ISO 7626:5, the three main criteria for defining the natural frequency values for the parallel phase leads are the coherence spectra, phase and frequency response function graphs. Firstly, the validity of the signal is decided on the value of the coherence function. The coherence function based on averaging three hammer “bumps” on a same measurement point and in same direction controls the repeatability of the measurement and the measurement is considered relevant if the value of the coherence is from 0,90 to 1. The phase graph is used for identification of the characteristic natural frequencies in the frequency response spectra. The phase is within 10 % of 90° at a natural frequency as a stimulus frequency approaches the non-damped natural frequency. The natural frequency is recognized by the dominant peak in magnitude of the frequency response function where the above two conditions for the coherence and phase spectra are fulfilled.
The results from the measurements of the natural frequencies of the series loop caps are given in Table 3.
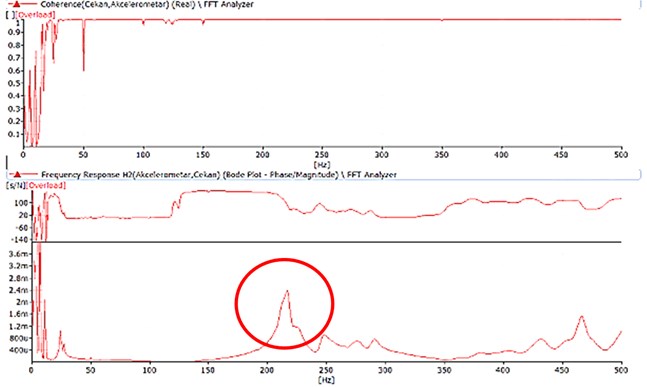
From the results can be noticed that some of the bars vibrate with a natural frequency which belongs to the resonant region of 100 Hz and it is recommended to be replaced. Additionally, has been noticed that there exists a difference in the values for the natural frequencies in same direction and same measurement points on the two generators. The natural frequency is the resonant frequency of the element and it is excited by the hammer impact. The natural frequency can be read out from the frequency response function (FRF) obtained from the measurement in a form of a dominant peak as it is shown in Fig. 7 and Fig. 8. It is evident that the natural frequency value is represented by the most prominent peak in the graph followed by phase shift of approximately 90° and high coherence. For example, the natural frequency of the phase leads belonging to the cold generator in y-direction which is marked with the red circle is 251,25 Hz (Fig. 7), while the natural frequency of the phase leads belonging to the warm generator is 216,25 Hz (Fig. 8) which is significantly lower. This lead to a possible conclusion that the difference in temperature implies on a difference in the natural frequency.
Fig. 7Coherence, phase spectra and the frequency response function (FRF) with the natural frequency value for G1-MP11-y
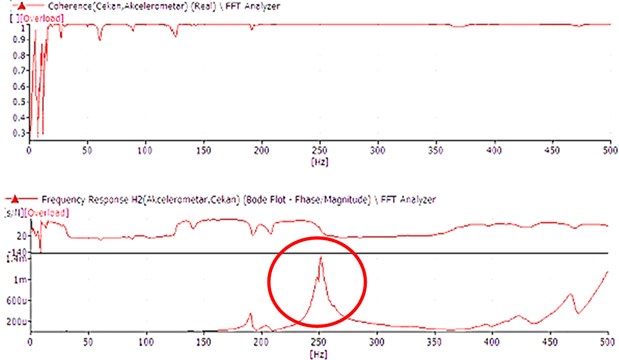
Fig. 8Coherence, phase spectra and the frequency response function (FRF) with the natural frequency value for G2-MP11-y
Nevertheless, the two generators even though theoretically and manufactured as identical, are still different constructions which behave uniquely and vibrate with their own natural frequencies. Therefore, the comparison of the results for the influence of the temperature on their natural frequencies can be an indicator, but further measurements should be conducted. It was decided that for precise results on how the temperature changes impact the changes in the natural frequency, a repeatable measurements of the parallel phase lead on a single generator should be done during a process of its’ cooling.
Table 3Measured natural frequencies of the parallel phase leads
Measurement point | |||
Generator 2 | Generator 1 | ||
phase leads | [Hz] | phase leads | [Hz] |
G2-МP11- | 216,25 | G1-МP11- | 251,25 |
G2-MP33- | 216,25 | G1-MP33- | 251,25 |
G2-MP13- | 216,9 | G1-MP13- | 251 |
G2-MP22- | 102 | G1-MP22- | 94,4 |
G2-MP44- | 101,9 | G1-MP44- | 95 |
G2-MP25- | 105,5 | G1-MP25- | 95 |
G2-MP11- | 85 | G1-MP11- | 85 |
G2-MP33- | 85 | G1-MP33- | 85 |
G2-MP13- | 85 | G1-MP13- | 85 |
A year later, the measurement of the natural frequencies during a process of cooling was conducted on the second generator. In order to obtain results for the changes in the natural frequency from the temperature gradient, the hammer impact testing was implemented on four different temperature states after the generator was disconnected from network. The results from the measurements of the natural frequencies of the parallel phase lead of the generator for different temperature states are shown in Table 4.
Figs. 9, 11 and 13 show the frequency response functions in the three directions (, and ) for the four different temperatures. On graphs in Figs. 10 ,12 and 14, the dependence of the natural frequency with the temperature in the same three directions is given.
Fig. 9Frequency response functions in y-direction for the four different temperatures
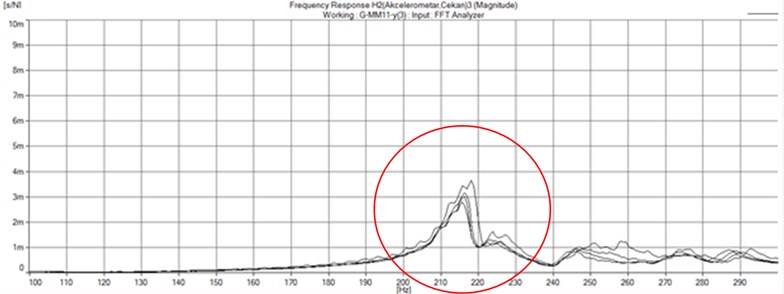
Fig. 10Changes in the natural frequency depending on the temperature changes in y-direction
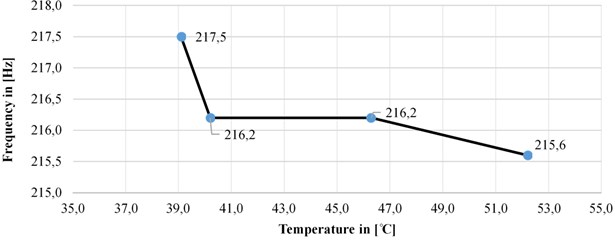
Table 4Natural frequencies of a parallel phase lead of generator 2
Temperature in [°C] | Measured natural frequency (in [Hz] | ||
G2-MM1- | G2-MM1- | G2-MM2- | |
52.2 | 215.6 | 85 | 100 |
46.3 | 216.2 | 85.6 | 101.2 |
40.2 | 216.2 | 85.6 | 101.8 |
39.1 | 217.5 | 86.2 | 103.1 |
Fig. 11Frequency response functions in z-direction for the four different temperatures
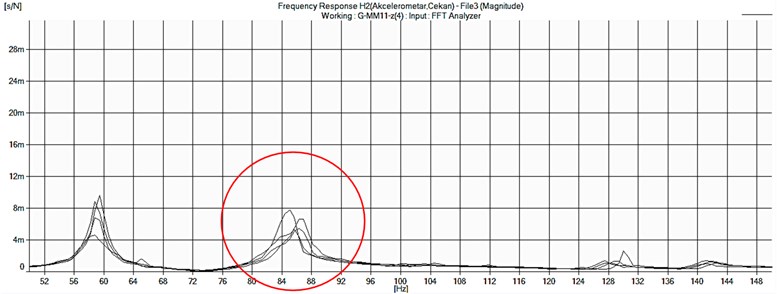
Fig. 12Changes in the natural frequency depending on the temperature changes in z-direction
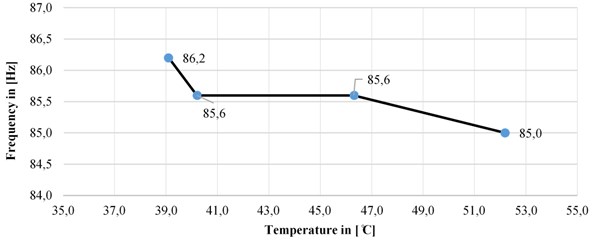
Fig. 13Frequency response functions in z-direction for the four different temperatures
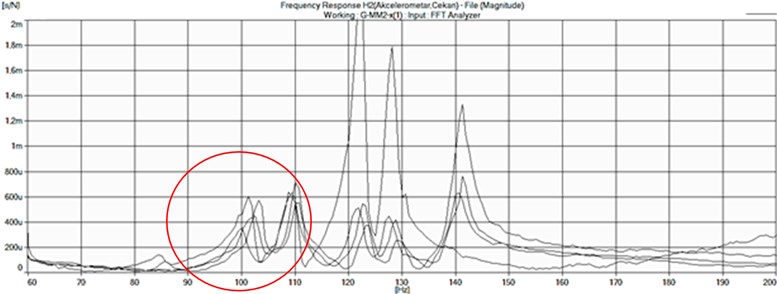
The parallel phase lead was tested on the same measurement point during every repeated measurement. The temperature was decreasing fast immediately after disconnecting the generator from the network, so the first two measurements were conducted in a very short interval of time. Afterwards, the changes in temperature became minor and because of the slow process of cooling, the generator measurements were made in relatively short range of temperature gradient and only four different measurements were conducted. Therefore, the changes in the natural frequencies are not drastically big, but are still noticeable.
Fig. 14Changes in the natural frequency depending on the temperature changes in x-direction
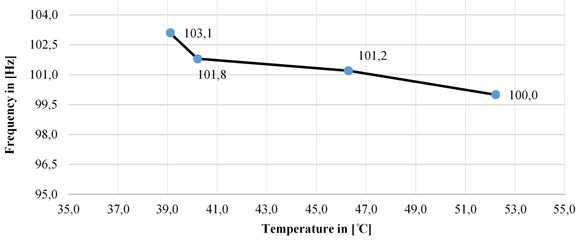
Given the values and the frequency response functions, can be perceived that the natural frequencies in all three directions of measurement increases with the reduction of temperature. This effect may occur due to the increase of the rigidity as a physical phenomenon of the material (steel) out of which the parallel phase leads are made with the decrease in their temperature. This proportionally affects to increasing of the natural frequency when the mass is unchanged.
6. Conclusions
This paper provides a new, modern approach of inspecting the vibration state of machines by analyzing the easily controllable physical parameters such as temperature. In this work, a novel methodology and technical set-up for an implemented hammer impact testing and the results thereof were described. The hammer impact testing was conducted on a generator in a repairing phase in order to determine whether some of the parallel phase leads show natural frequencies in the resonant region which is around 100 Hz. The same measurement methodology was conducted on the same parallel phase lead on an identical generator in the same hydro power plant that was in a warm state (disconnected from network shortly before the measurement) in order to determine a possible impact of the temperature on the natural frequencies of the elements. This measurement indicated a possible relation between these two parameters (the temperature and the natural frequency), but it was not enough to make a strong statement about this dependence. The same measurement methodology was conducted on the same generator in four different temperature states as it was cooling down after its’ disconnection from the network.
As concluding remarks can be pointed out that after the first testing of the generator in a repairing phase, the critical parallel phase leads were detected and their replacement was suggested. The results at the end of the second and the third measurements have brought to a conclusion that by decreasing the temperature, the natural frequency of the parallel phase lead is slightly increasing in all three directions of measurement due to the increase of its’ rigidity, which was an initial research aim of this work. The connection between these two parameters, the natural frequency as dynamical and the temperature as a physical one, will lead to a more aware and accurate monitoring and detection of the rotating machine elements natural frequency problems and avoiding damages thereof.
References
-
Stone G. C. Condition monitoring and diagnostics of motor and stator windings – a review. IEEE Transactions on Dielectrics and Electrical Insulation, Vol. 20, Issue 6, 2013, p. 2073-2080.
-
Maughan P. E. Monitoring of generator condition and some limitations thereof. Electrical Insulation Conference and Electrical Manufacturing Expo, 2005.
-
Henao H., Capolino G. A., Fernandez Cabanas M., Filippetti F., Bruzzese C., et al. Trends in fault diagnosis for electrical machines: A review of diagnostic techniques. IEEE Industrial Electronics Magazine, Vol. 8, Issue 2, 2014, p. 31-42.
-
Tavner P. J. Review of condition monitoring of rotating electrical machines. IET Electric Power Applications, Vol. 2, Issue 4, 2008, p. 215-247.
-
Lin R., Laiho A. N., Haavisto A., Arkkio A. End-winding vibrations caused by steady-state magnetic forces in an induction machine. IEEE Transactions on Magnetics, Vol. 46, Issue 7, 2010, p. 2665-2674.
-
Letal J., Warren V., Power Q. I. Optimize stator endwinding vibration monitoring with impact testing. The Premier Electrical Maintenance and Safety Event, 2017.
-
Kapler J., Letal J., Sasic M., Stone G. C. Recent endwinding vibration problems in air-cooled turbine generators. CIGRE, 2014.
-
Letal J., Teixeira M. End-Winding Vibration Monitoring of Turbo-Generators. Iris Power, 2016.
-
Ellis M., Kraijesteijn J. Assessing the integrity of generator stator end windings. 20th International Conference on Nuclear Engineering and the ASME Power Conference, 2012.
-
Li W., Ding S., Zhou F. Diagnostic numerical simulation of large hydro-generator with insulation aging. Heat Transfer Engineering, Vol. 29, Issue 10, 2008, p. 902-909.
-
Ding S., Li W., Jin H., Xiong B. Cooling air state inside generator effect on stator temperature fields. Proceedings-Chinese Society of Electrical Engineering, Vol. 26, Issue 3, 2006, p. 131.
-
Vrazic M., Gasparac I., Pavlica M. Some problems of synchronous hydro-generator temperature measurement. 18th International Conference on Electrical Machines, 2008.
-
Zhao Y., Yan B., Chen C., Deng J., Zhou Q. Parametric study on dynamic characteristics of turbogenerator stator end winding. IEEE Transactions on Energy Conversion, Vol. 29, Issue 1, 2014, p. 129-137.
-
Moore B., Maughan C. Generator stator end winding resonance: problems and solutions. ASME Power Conference, 2013.
-
Shally D., Farrell M., Sullivan K. Generator end winding vibration monitoring. 43rd International Universities Power Engineering Conference, 2008.
-
Maughan C. V. Vibration detection instrumentation for turbine-generator stator endwindings. Electrical Insulation Conference, 2009.
-
Sasic M., Jiang H., Stone G. C. Requirements for fiber optic sensors for stator endwinding vibration monitoring. International Conference on Condition Monitoring and Diagnosis, 2012.
-
Anachkova M., Jovanova J., Petreski Z. Impact testing of end-winding in two hydro generators in different temperature state. Vibroengineering Procedia, Vol. 18, 2018, p. 27-30.
About this article

