Abstract
Unstable vibrations in rotating machinery can stem from various causes, making it challenging to determine their origins. This research introduces the operational transfer path analysis method (OTPA) as a means to identify the causes of turbo generator vibrations. The model takes operational parameters, such as power and current, as input, and the vibration amplitude as output, to establish the source analysis model. To address the ill-conditioned input matrix, the singular value decomposition method is employed. By solving the transmissibility matrix and analyzing parameter contributions, the primary factors influencing vibration are identified. This method is applied to analyze the vibration sources in a 660 MW turbine generator unit. The generator experienced unstable vibration of unknown origin for a certain period. Operational transfer path analysis revealed that hydrogen pressure, hydrogen temperature, and bearing temperature significantly impacted the vibrations. Thermal imbalances and shaft misalignment in the generator rotor were inferred as the likely causes. Through adjustments to hydrogen pressure and temperature, the generator vibration was controlled until the next overhaul. Subsequent maintenance revealed partial blockage of the hydrogen ventilation holes, leading to rotor thermal imbalances. The feasibility of this method was confirmed. The objective of this study is to present an effective data-driven model for identifying the main influential parameters among numerous variables. This model can be applied to intelligent fault diagnosis in power generation units.
1. Introduction
Vibration is a critical factor that influences the safe and stable operation of rotating machinery, such as turbine generator units. Therefore, it is essential to develop advanced and efficient vibration fault diagnosis techniques. The causes of vibration can be diverse, and analyzing unstable vibrations poses a greater challenge compared to stable vibrations. Understanding the variation pattern of vibration and identifying its influencing factors are crucial initial steps in fault analysis.
Two methods are commonly employed to analyze the causes of unstable vibration. One approach involves integrating vibration signals with physical models. For instance, Pankaj Charan Jena combined a finite element model with vibration signals to identify and assess crack faults in Silicon Carbide-particulate-composite-polymer-beams [1]. Deviations in dynamic natural frequencies and mode shapes between two states were used to identify the faults. The impact of fiber orientations on beam dynamics was observed by employing analytical, finite element, and neural network techniques, highlighting their effects on crack location and depth [2-5]. It has been concluded that the natural frequencies and mode shapes can be used for identifying crack location and crack depth for different fiber orientation in beam.
Another method is to combine vibration signals with process parameters and faults are identified based on their correlation. Correlation coefficient is a sensitive parameter to changes of mechanical properties of real structures [6]. When the system is complex and the physical model is difficult to accurately establish, this method is widely used [7]. A correlation matrix analysis is provided to demonstrate that variation in the fluid-temperature difference between the pump intake and discharge is related to the vibration amplitude variation in a pump with a fault [8]. Kundu [9] presents a correlation coefficient based parameter for detecting the natural progression of pitting fault in spur gear. Modern power plants have installed plant level monitoring information system (SIS). The SIS system stores a large amount of historical data, which provides feasibility for finding unstable vibration sources.
Correlation analysis primarily examines the relationship between two variables, and the correlation between process parameters significantly affects the analysis results. It is essential that variables change independently, yet parameters often change simultaneously. To address this, partial correlation analysis technology can analyze the linear correlation between two variables while controlling the linear influence of other variables, improving the net correlation between them. Krishnan [7] employed multiscale detrended partial cross-correlation analysis to evaluate the interdependencies and cross-correlation structure between various thermomechanical variables and tracked order vibration across multiple time scales. Principal component analysis (PCA) is a commonly utilized feature reduction method. It transforms complex, multidimensional data into uncorrelated, low-dimensional data through linear transformations, eliminating information redundancy in multidimensional fault feature vectors and reducing the complexity of data analysis [10-11]. Geng [12] proposed an adaptive sparse principal component analysis algorithm fused with improved variation mode decomposition for fault detection in chemical processes. This method adaptively selects principal components based on the data, enabling real-time property in chemical processes.
Operational transfer path analysis (OTPA) finds widespread application in vehicle vibration and noise analysis [13-18]. By measuring vibrations under operating conditions, this method establishes a transmission rate matrix between different vibration points, enabling the analysis of vibration sources. Klerk explained the principle of OTPA and highlighted the use of singular value decomposition technology to solve the transfer rate function matrix between the excitation source and the target point [19]. Janssens et al. investigated the combination of OTPA with the concept of transmissibility, noting the limitations of this method during application [20]. Lee et al. proposed an OTPA method based on deep neural network technology, validating its accuracy through finite element models [21]. Tatlow et al. considered interior noise and floor vibration in motor cars as target points, with each bogie component serving as the excitation point. OTPA analysis revealed that bogie structure vibrations were the primary sources of interior noise and floor vibration [22]. Yoshida et al. combined OTPA with principal component analysis and CAE simulation to analyze the impact of vehicle body vibrations in all directions on vehicle interior noise [23].
OTPA is an effective method for analyzing the transitive relationship of vibrations between different points. In this paper, OTPA is further employed to analyze the transitive relationship between vibrations and process parameters. The process parameters are treated as independent variables, while vibration amplitude is considered the dependent variable. Modeling data from the SIS, collected under various operating conditions, are used for analysis. By applying this method, the unstable vibration source in a 660 MW generator is identified as thermal imbalance and misalignment.
2. Vibration source analysis based on operation transfer path analysis
The operational transfer path analysis (OTPA) method builds upon the fundamental principles discussed in detail in [19]. Considering a multi-input and multi-output system, it is recognized that input signals can exhibit a certain degree of coherence. As practical applications of OTPA may involve higher coherence levels, the method is extended by incorporating the singular value decomposition technique to mitigate the influence of noise.
The vibration amplitude at the target point is influenced by multiple process parameters simultaneously. Assuming a linear time-invariant system, the relationship between the input and output can be expressed as:
where is the input matrix of process parameters, is the output matrix of vibration amplitude at the target point, and is the transfer rate matrix. By utilizing data obtained under different operating conditions, the transfer rate matrix can be determined as:
where is the number of operating conditions, is the number of vibration points, represents the output at the th vibration point under the th operating condition, and denotes the th input process parameter under the th operating condition. Eq. (2) can be solved when the number of operating conditions is equal to or greater than the number of system inputs.
Significant cross-talk between process parameters exists under different operating conditions, and the ill-conditioned problem of the input matrix becomes prominent. To address this, the singular value decomposition technique is employed to process the input process parameter matrix :
where and are the left and right singular matrices, respectively. These matrices are unitary matrices. is the singular value matrix of , which is a diagonal matrix with its values denoted as singular values . The larger singular values correspond to the primary components of the input signal.
The cumulative contribution rate is set as:
Typically, the cumulative contribution rate is set to be above 95 %. The cross-talk signal can be eliminated by reasonably rounding off the smaller singular values. The processed singular value matrix is represented as:
Combining Eqs. (1), (3), and (5), we obtain:
The synthesized output signal can be expressed as:
The contribution of process parameter to the target vibration amplitude can be determined as:
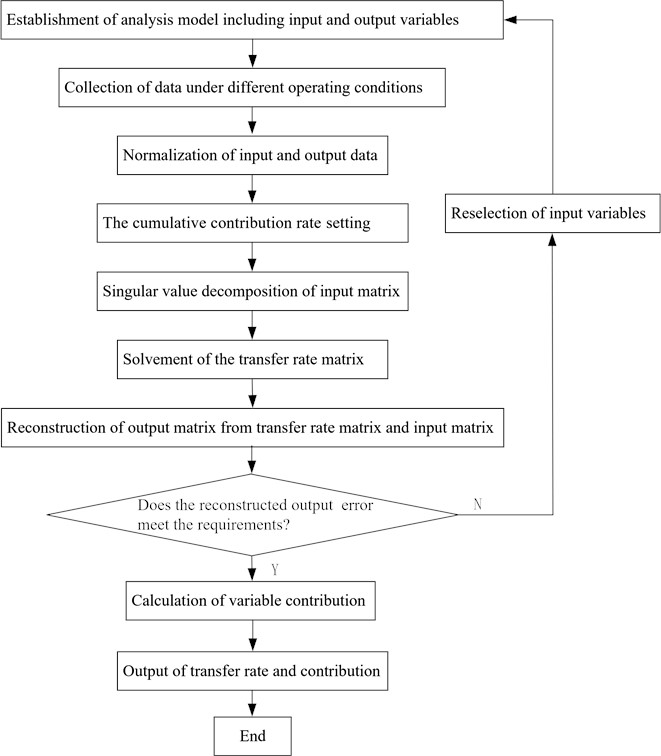
By utilizing the transfer rate matrix , the sensitivity of process parameters to vibration amplitude can be calculated. Analyzing the contributions of process parameters allows for the identification of the main factors influencing vibration amplitude. Fig. 1 illustrates the flowchart of the OTPA method.
Fig. 1The flowchart of OTPA
3. Vibration source analysis model based on OTPA for a 660 MW turbine generator
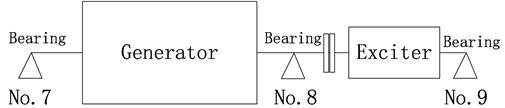
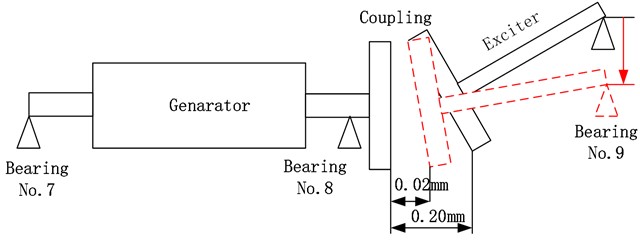
The vibration source analysis model based on OTPA is applied to a 660 MW turbine generator, consisting of a generator and an exciter, as depicted in Fig. 2. The generator has three bearings, namely No. 7, No. 8, and No. 9. A total of 32 monitoring process parameters, excluding vibration, are considered as inputs for the fault source analysis model, as shown in Table 1.
Table 1Generator monitoring parameters
No | Process parameter | No | Process parameter |
1 | Power | 12 | Lubricating oil pressure |
2 | Reactive power | 13 | Sealing oil temperature |
3 | Temperature of bearing No.7 | 14 | Hydrogen pressure |
4 | Temperature of bearing No.8 | 15 | Oil pressure at air side |
5 | Temperature of bearing No. 9 | 16 | Oil pressure at hydrogen side |
6 | Oil discharge temperature of bearing No.7 | 17 | Hydrogen temperature at turbine end |
7 | Oil discharge temperature of bearing No.8 | 18 | Hydrogen temperature at exciter end |
8 | Oil discharge temperature of bearing No.9 | 19 | Hydrogen temperature |
9 | Excitation current | 20-23 | Stator coil temperature |
10 | Excitation voltage | 24-31 | Core temperature |
11 | Lubricating oil temperature | 32 | Axial displacement |
Based on the generator’s principle, these process parameters can be categorized as follows:
1) Heat source parameters: These include active power, reactive power, excitation current, and excitation voltage.
2) Cold source parameters: This category comprises hydrogen temperature, hydrogen pressure, hydrogen temperature of turbine end, and exciter end.
3) Thermal state parameters: It includes the temperatures of the generator stator coil and core.
4) Sealing system parameters: This category encompasses sealing oil temperature, air side oil pressure, and hydrogen side oil pressure.
5) Mechanical system parameters: This category involves the temperature of the three bearings and their oil discharge temperatures, oil temperature at the oil cooler outlet, lubricating oil pressure, and axial displacement.
The source analysis model considers six shaft vibration points (7x, 7y, 8x, 8y, 9x, 9y) and three case vibration points on the generator and exciter bearings as outputs. These points serve as the basis for analyzing the vibration sources.
Once the transfer rate matrix is obtained from Eq. (6), the resultant vibration can be calculated using Eq. (7). The accuracy of the established model is evaluated by comparing the synthetic vibration with the measured vibration. Furthermore, the contribution of each process parameter is calculated using Eq. (8).
Fig. 2Model of a 660 MW generator. The generator and exciter are supported by three bearings
4. Vibration source analysis of turbine generator
4.1. Unstable vibration phenomenon
Fig. 3 illustrates the variation in turbine generator vibration, with prominent instability observed in bearing No. 8 and bearing No. 9. The maximum amplitude fluctuation reaches 100 μm. Fig. 4 depicts the trends of heat source, cold source, sealing, and mechanical parameters. These parameters exhibit changes as the operating conditions vary, and a strong correlation exists among them. Directly identifying the main influencing factors becomes challenging.
Fig. 3Variation of vibration during operation. The unstable vibration phenomenon is highlighted on bearing No. 8 and No. 9
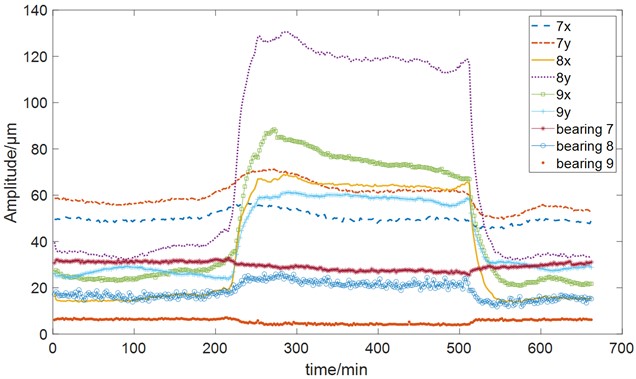
Fig. 4Trend of process parameters. The parameters in the figure have been normalized
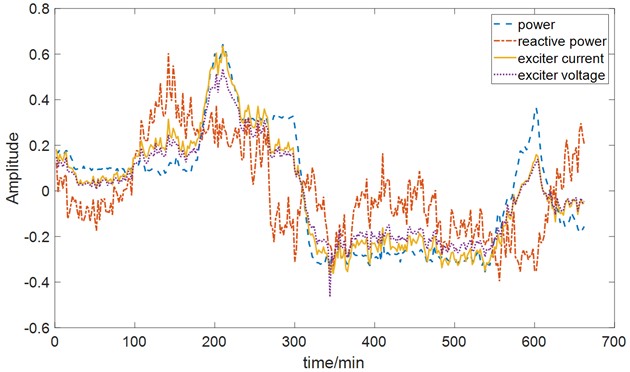
a) Heat source parameters
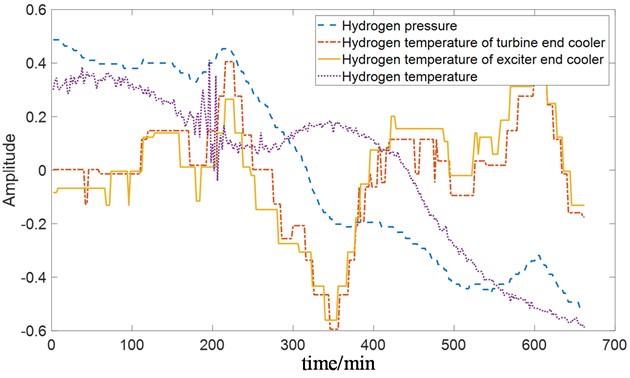
b) Cold source parameters
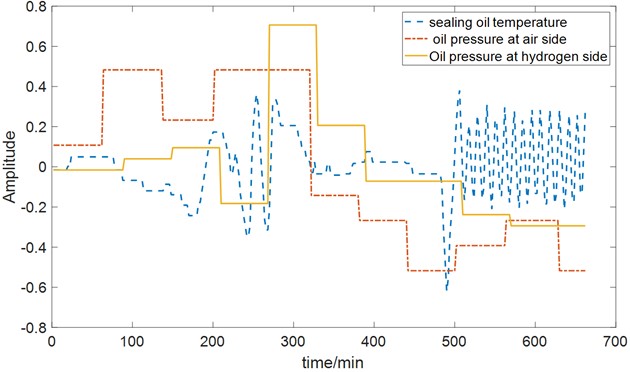
c) Sealing system parameters
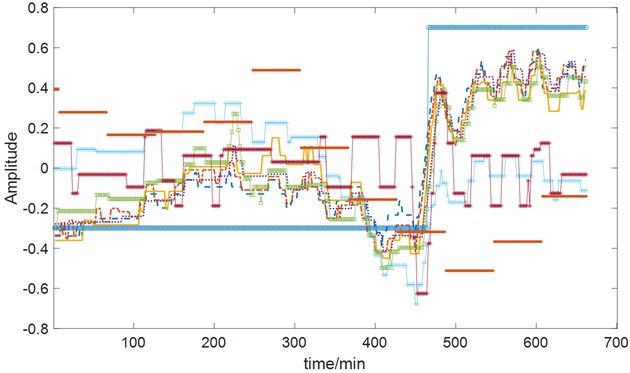
d) Mechanical system parameters

4.2. Accuracy evaluation of the vibration source analysis model
Continuous monitoring data spanning 11 hours is used for evaluation. The data consists of 331 groups, sampled at 2-minute intervals. Prior to vibration source analysis, the data is processed through mean removal and normalization. A cumulative contribution rate of 95 % is set. Fig. 5 compares the trends of synthetic vibration and actual vibration at each point, demonstrating small differences. The established source analysis model accurately reflects the vibration characteristics.
4.3. Analysis of the influence of process variables on vibration
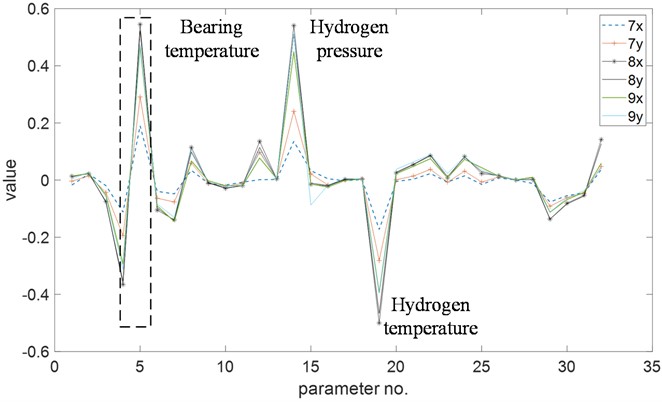
Fig. 6 presents the distribution of transfer rates for parameters affecting vibration amplitude. Notably, bearing temperature, hydrogen temperature, and hydrogen pressure exhibit significant transfer rates. The temperature of bearing No. 8 and bearing No. 9 have opposite effects on vibration amplitude. The impact of hydrogen temperature and pressure on vibration amplitude is also reversed.
Fig. 5Comparison between synthetic and actual vibration. The vibration in the figure have been normalized
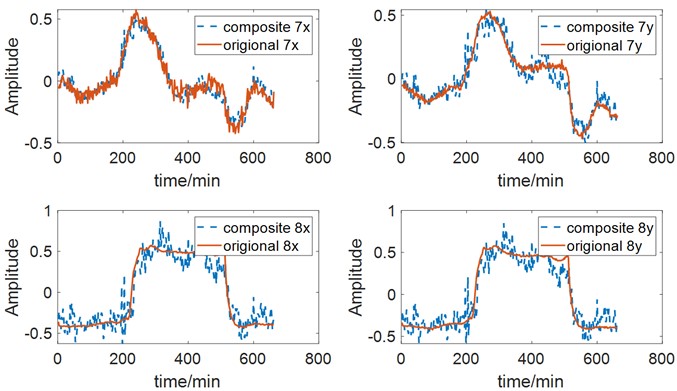
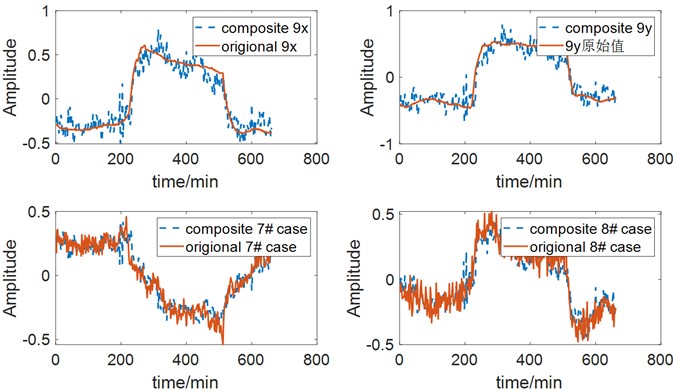
Fig. 6Transfer rate distribution of parameters on shaft vibration. The transfer rate of bearing temperature, hydrogen pressure and temperature are significant
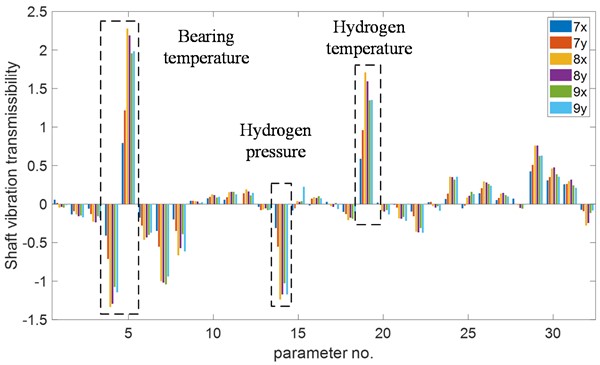
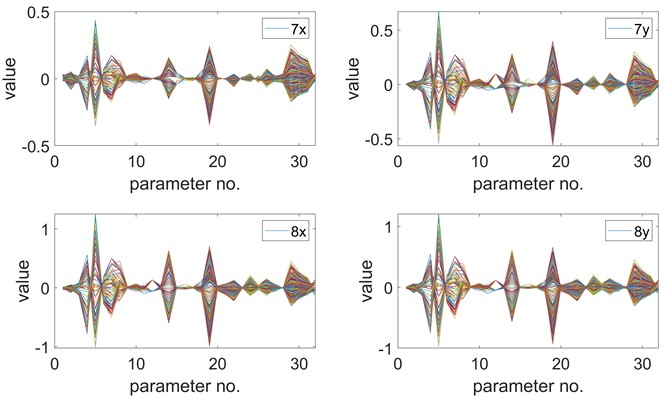
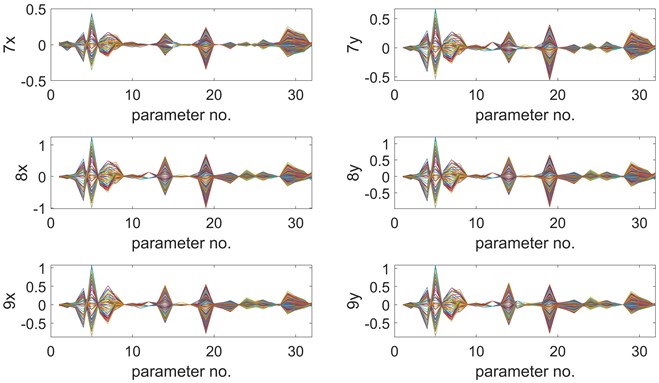
Fig. 7 illustrates the contribution distribution of process parameters across 331 operating conditions. To facilitate analysis, Fig. 8 focuses on the contribution distribution under conditions with large vibration amplitude. To reduce vibration amplitude, it is necessary to decrease the contribution of bearing temperature, hydrogen temperature, and hydrogen pressure. This can be achieved by increasing the temperature of bearing No. 8 or decreasing the temperature of bearing No. 9, increasing hydrogen pressure, and decreasing hydrogen temperature.
Fig. 7Contribution of parameters to vibration under 331 conditions. Among process parameters, the bearing temperature, hydrogen pressure and temperature have a greater impact on the vibration
4.4. Identification of unstable vibration source of the generator
From Fig. 6, it is evident that various process parameters exhibit similar influences on the vibration of the three bearings, indicating a strong correlation between their vibrations. Based on the OTPA analysis results, it can be concluded that the generator's vibration is caused by two factors: shaft misalignment and rotor thermal bow.
(1) Shaft misalignment.
Fig. 8 highlights the significant impact of bearing temperature on vibration amplitude, while lubricating oil temperature has a minimal effect. Changes in lubricating oil temperature primarily impact oil viscosity. Influence of oil viscosity can be disregarded. In this case, bearing temperature is mainly related to bearing load. It means that bearing load is an important parameter influencing vibration amplitude.
The generator and exciter’s shaft system, comprising three bearings, represents a typical statically indeterminate system. If the elevation of bearing No. 9 is high, it leads to an increased load on bearing No. 9, resulting in elevated temperature. Simultaneously, the load on bearing No. 8 decreases, leading to a decrease in its temperature. This indicates that the shaft system's alignment is compromised, with bearing No. 9 exhibiting high elevation. To reduce vibration, it is necessary to lower the elevation of bearing No. 9.
Fig. 8Contribution distribution of parameters to vibration under large amplitude conditions. The bearing temperature, hydrogen pressure and temperature have a greater impact on the vibration
(2) Rotor thermal bow.
Fig. 6 and Fig. 8 demonstrate the significant impact of hydrogen temperature and pressure on vibration. This indicates a relationship between vibration and the rotor's thermal state. Partial blockage of the generator’s vents leads to uneven cooling of the rotor, causing temperature variations and rotor bow. The resulting rotor thermal bow induces an imbalance that manifests as generator vibration. This type of vibration is associated with thermal imbalance and is influenced by the rotor’s temperature state. Enhancing cooling by increasing hydrogen pressure and decreasing hydrogen temperature intensifies the uneven cooling of rotor sections, resulting in increased temperature difference and vibration amplitude.
The generator is still some time away from the next overhaul. The power plant did not have the opportunity to carry out bearing elevation adjustment and uneven rotor cooling inspection. The unit operation has to be maintained by monitoring the vibration trend. Control measures as reducing the hydrogen pressure and increasing the hydrogen temperature shall be taken when the vibration increases.
In the next major overhaul of the generator, the power plant carried out maintenance and inspection. It was discovered that 28 ventilation holes out of the generator rotor’s 32 cooling vents were partially blocked due to the sliding of the damping strip, as depicted in Fig. 9. This partial blockage caused uneven cooling of the rotor section.
As the thermal expansion coefficients of rotor and damping strip materials are different, a certain gap needs to be set between them. During machining, the damping bar and rotor also need a certain amount of allowable machining error. There is space for axial displacement of the damping bar. If the relative movement between the two is large, the ventilation hole will be blocked locally. In the case, the maximum slip of the damping strip reaches 8 mm.
Fig. 9The locally blocked ventilation hole. The vent hole is partially blocked due to thermal expansion different of rotor and damping strip materials

During the unit’s overhaul, shaft alignment was also adjusted. Fig. 10 shows that the downward opening value of the coupling between the generator and the exciter was adjusted from 0.20 mm to 0.02 mm, reducing the elevation of bearing No. 9.
After the overhaul, when the turbine generator was started up, the vibration remained relatively stable and was not influenced by parameters such as hydrogen temperature and pressure. The adjustments made during the maintenance effectively addressed the issues of shaft misalignment and rotor thermal bow, resulting in improved stability and reduced vibration in the generator.
By utilizing the OTPA analysis, the main causes of the generator's unstable vibration were identified and successfully resolved through maintenance and corrective measures. The analysis provided valuable insights into the relationship between process variables and vibration, enabling the power plant to maintain stable operation and mitigate potential damage to the turbine generator.
Fig. 10Shaft alignment adjustment. The elevation of bearing No. 9 was lowered
5. Conclusions
In this study, a method for identifying vibration sources in turbine generators based on operational transfer path analysis (OTPA) was proposed. The model takes process parameters such as generator power and current under operating conditions as inputs and vibration amplitude as the output. The singular value decomposition technique was utilized to address the ill-conditioning of the input matrix. The transfer rate matrix and the contribution of process parameters to vibration were determined, enabling the identification of the main factors influencing vibration.
The proposed method was applied to analyze the vibration sources in a 660 MW turbine generator unit. It was revealed that hydrogen pressure, hydrogen temperature, and bearing temperature had a significant impact on vibration. During the unit’s overhaul, the local blockage of the generator’s ventilation holes was confirmed, and adjustments were made to the elevation of bearing No. 9. These measures successfully resolved the vibration issues.
OTPA proved to be an effective tool for analyzing the transfer path of vibrations between different points. By applying OTPA to analyze the relationship between vibration and process parameters, the method demonstrated its efficacy as a data-driven approach suitable for intelligent analysis and diagnosis of turbine generator units.
References
-
P. Charan Jena, “Identification of crack in SiC composite polymer beam using vibration signature,” Materials Today: Proceedings, Vol. 5, No. 9, pp. 19693–19702, 2018, https://doi.org/10.1016/j.matpr.2018.06.331
-
P. C. Jena, D. R. Parhi, and G. Pohit, “Dynamic investigation of FRP cracked beam using neural network technique,” Journal of Vibration Engineering and Technologies, Vol. 7, No. 6, pp. 647–661, Dec. 2019, https://doi.org/10.1007/s42417-019-00158-5
-
P. C. Jena, D. R. Parhi, and G. Pohit, “Fault measurement in composite structure by fuzzy-neuro hybrid technique from the natural frequency and fibre orientation,” Journal of Vibration Engineering and Technologies, Vol. 5, No. 2, pp. 123–136, 2017.
-
P. C. Jena, D. R. Parhi, and G. Pohit, “Dynamic study of composite cracked beam by changing the angle of bidirectional fibres,” Iranian Journal of Science and Technology, Transactions A: Science, Vol. 40, No. 1, pp. 27–37, Mar. 2016, https://doi.org/10.1007/s40995-016-0006-y
-
P. C. Jena, D. R. Parhi, and G. Pohit, “Theoretical, numerical (FEM) and experimental analysis of composite cracked beams of different boundary conditions using vibration mode shape curvatures,” International Journal of Engi-neering and Technology, Vol. 6, No. 2, pp. 509–518, 2014.
-
N. K. Ngo, T. Q. Nguyen, T. V. Vu, and H. Nguyen-Xuan, “An fast Fourier transform-based correlation coefficient approach for structural damage diagnosis,” Structural Health Monitoring, Vol. 20, No. 5, pp. 2360–2375, Sep. 2021, https://doi.org/10.1177/1475921720949561
-
M. Krishnan, I. A. Sever, and P. Tarazaga, “Data-driven modeling of vibrations in turbofan engines under different operating conditions,” AIAA Journal, Vol. 60, No. 10, pp. 6005–6019, Oct. 2022, https://doi.org/10.2514/1.j061539
-
G. Reges et al., “Electric submersible pump vibration analysis under several operational conditions for vibration fault differential diagnosis,” Ocean Engineering, Vol. 219, p. 108249, Jan. 2021, https://doi.org/10.1016/j.oceaneng.2020.108249
-
P. Kundu, A. K. Darpe, and M. S. Kulkarni, “A correlation coefficient based vibration indicator for detecting natural pitting progression in spur gears,” Mechanical Systems and Signal Processing, Vol. 129, pp. 741–763, Aug. 2019, https://doi.org/10.1016/j.ymssp.2019.04.058
-
L. Li, J. Zhao, C. Wang, and C. Yan, “Comprehensive evaluation of robotic global performance based on modified principal component analysis,” International Journal of Advanced Robotic Systems, Vol. 17, No. 4, pp. 1–11, 2020.
-
F. Badakhshan Farahabadi, K. Fathi Vajargah, and R. Farnoosh, “dimension reduction big data using recognition of data features based on copula function and principal component analysis,” Advances in Mathematical Physics, Vol. 2021, pp. 1–8, Jul. 2021, https://doi.org/10.1155/2021/9967368
-
Z. Geng, X. Duan, Y. Han, F. Liu, and W. Xu, “Novel variation mode decomposition integrated adaptive sparse principal component analysis and it application in fault diagnosis,” ISA Transactions, Vol. 128, pp. 21–31, Sep. 2022, https://doi.org/10.1016/j.isatra.2021.11.002
-
M. V. van der Seijs, D. de Klerk, and D. J. Rixen, “General framework for transfer path analysis: History, theory and classification of techniques,” Mechanical Systems and Signal Processing, Vol. 68-69, pp. 217–244, Feb. 2016, https://doi.org/10.1016/j.ymssp.2015.08.004
-
A. Diez-Ibarbia et al., “Comparison between transfer path analysis methods on an electric vehicle,” Applied Acoustics, Vol. 118, pp. 83–101, Mar. 2017, https://doi.org/10.1016/j.apacoust.2016.11.015
-
G. Cervantes-Madrid, R. Peral-Orts, N. Campillo-Davo, and H. Campello-Vicente, “Inverse transfer path analysis, a different approach to shorten time in NVH assessments,” Applied Acoustics, Vol. 181, p. 108178, Oct. 2021, https://doi.org/10.1016/j.apacoust.2021.108178
-
P. Gajdatsy, K. Janssens, W. Desmet, and H. van der Auweraer, “Application of the transmissibility concept in transfer path analysis,” Mechanical Systems and Signal Processing, Vol. 24, No. 7, pp. 1963–1976, Oct. 2010, https://doi.org/10.1016/j.ymssp.2010.05.008
-
A. Buccini, M. Pasha, and L. Reichel, “Generalized singular value decomposition with iterated Tikhonov regularization,” Journal of Computational and Applied Mathematics, Vol. 373, p. 112276, Aug. 2020, https://doi.org/10.1016/j.cam.2019.05.024
-
D. Vaitkus, D. Tcherniak, and J. Brunskog, “Application of vibro-acoustic operational transfer path analysis,” Applied Acoustics, Vol. 154, pp. 201–212, Nov. 2019, https://doi.org/10.1016/j.apacoust.2019.04.033
-
D. de Klerk and A. Ossipov, “Operational transfer path analysis: Theory, guidelines and tire noise application,” Mechanical Systems and Signal Processing, Vol. 24, No. 7, pp. 1950–1962, Oct. 2010, https://doi.org/10.1016/j.ymssp.2010.05.009
-
K. Janssens et al., “OPAX: A new transfer path analysis method based on parametric load models,” Mechanical Systems and Signal Processing, Vol. 25, No. 4, pp. 1321–1338, May 2011, https://doi.org/10.1016/j.ymssp.2010.10.014
-
D. Lee and J. W. Lee, “Operational transfer path analysis based on deep neural network: Numerical validation,” Journal of Mechanical Science and Technology, Vol. 34, No. 3, pp. 1023–1033, Mar. 2020, https://doi.org/10.1007/s12206-020-0205-5
-
J. Tatlow and M. Ballatore, “Road noise input identification for vehicle interior noise by multi-reference transfer path analysis,” Procedia Engineering, Vol. 199, pp. 3296–3301, 2017, https://doi.org/10.1016/j.proeng.2017.09.412
-
J. Yoshida and K. Tanaka, “Contribution analysis of vibration mode utilizing operational TPA,” Mechanical Engineering Journal, Vol. 3, No. 1, pp. 15–589-15-00589, 2016, https://doi.org/10.1299/mej.15-00589
Cited by
About this article

This research work was supported by the NR Scientific and Technological Projects (20210801).
The datasets generated during and/or analyzed during the current study are available from the corresponding author on reasonable request.
Wei Yan: conceptualization, funding acquisition, project administration. Shouping Zhong: data curation, formal analysis. Huazhong Li: investigation, supervision. Jiangang Yang: methodology, validation, writing-original draft preparation, writing-review and editing. Jun Chen: resources, software, visualization.
The authors declare that they have no conflict of interest.
