Abstract
Failure diagnostics and general decrease of accident rate at power plants is a major task of energy generation industry, and solution of it provides reliable energy supply country wide and technological progress in mechanical engineering. Along with some other crucial means, the task could be solved by means of teaching the maintenance staff based on accidents that have already occurred. That is no secret that everywhere in the world due to indecision or misinterpretation a huge number of accidents have happened merely because the personnel were not aware of similar cases at other power plants. Nevertheless with the development of computational technologies and mathematical algorithms the role of personnel in some cases has been reduced to observation and action in critical situation, while the rest is performed by machines: various types of diagnostics and prediction of failure systems based on artificial neural networks are widely applied and developed. However, in order to train these systems, it is absolutely required to know the reasons that could lead to and consequences that could follow some deterioration in turbo generator sets performance. The aim of the present paper is to give statistical analysis of turbo generator sets failure reasons based on open source data presented by Russian and foreign researchers and analysts in the field. The statistical data could be used to perform classification and ranking of failure reasons in terms of frequency of occurrence, possibility to identify or detect, etc. and the paper also gives brief listing of possible ways of detection or identification of failure modes and possible consequences for the main units of a turbo generator.
1. Introduction
Turbo generator sets with nominal power starting at only 6 MV and low rotation speeds of 100-600 RPM at hydraulic turbines up to 800 MV and speeds of around 3000 RPM for steam turbines are used in different variations in configuration all around the world to generate electricity and supply citizens of both small villages and huge cities [1]. Reliability of turbo generator sets is a major concern as black outs could have irreversible consequences. Moreover, damage that a failing turbine could cause to its direct surroundings could well be disastrous. In the light of this analysis of cause of failure seems to be a reasonable issue to address. This could be done only by means of already failed machines, but the problem here is the fact that most of the time power plant personnel does not share this kind of information, there is no such database of particular failure examples, there are however some case studies, some of them will be shown below. Most of the time such information is kept classified until some years later it could be analysed. One of the best examples of a huge number of case studies and analysis is presented in the book by Yuri Samorodov [2], which consists of analysis of failure cases for steam and gas turbines with hydrogen, hydrogen-water, water, water-oil types of cooling, ranking from 100 MV up to 800 MV. This book shall be referred to throughout the present paper along with some additional information from [3-6] and open source presentations from our foreign colleagues [7], as it is believed that, however different model marking could be, design features are still very similar and the following more general analysis of cause of failure applies to the majority of turbo generator sets around the world.
2. Turbo generator set components predisposed to failure
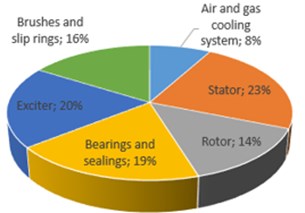
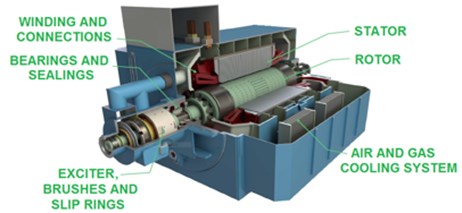
In the Fig. 1(a) critical components of a turbo generator are shown that are most predisposed to failure. These are: stator and rotor, air and gas cooling system, stator winding and connections, bearings and sealings, exciter and brushes and slip rings. These elements will be focused on below, although, of course, a list of critical and important elements that should be considered is not limited to them. However, facts suggest, that the majority of failure happens in these components, and Fig. 1(b) shows that the majority of the failures tend to happen in the rotor-stator system and the exciter: 37 % and 35 %. Given that bearings and sealings are crucial parts of the stator-rotor system, that adds up to 56 % of all cases [2].
Fig. 1Critical components of a turbo generator and distribution of failure
a)
b)
[7] shows the data from the Allianz Insurance Company that states that the causes of failing are distributed as follows: operation – 40 %; design – 43 %; ageing – 14 %; other – 3 %; and [2] suggests that the causes of failure are distributed as follows: operation (rather non-compliance with maintenance regulations) – 58.3 %; reparation faults – 28.2 %; design – 13.5 %. Although given from different perspectives, this distribution shows that a huge number of failures occurred during operation. It could be also noted at this point that there is quite a difference between design flaws impact on performance in which different design approaches manifest themselves in old turbo generator sets. The data that was collected in the references used for the present statistical analysis was acquired from turbo generators that were manufactured in 1960s and 1970s mostly. Since then they all have been repaired and many parts have been replaced with modern ones, that is why there is a tendency that a number of failures decreases dramatically: for some types of generators the number decreased by 10 times, for some – at least by 1.5 [2]. Nevertheless, design approaches could well be different, and here it is believed that everyone could benefit from this analysis and learn from each other’s mistakes.
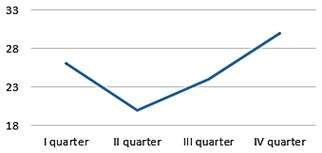
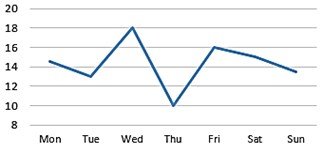
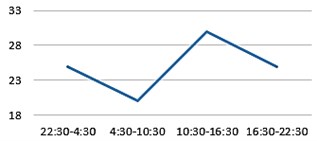
It has also been determined that there is specific relationship between time of the day, days and season when most of the failures occur [2] (Fig. 2).
3. Detectability of failures
Electrical tests performed to identify short circuits in stator core, breakage in rotor and stator windings, condition of the main insulation in rotor and stator winding, defects in contact between stator bars and stator slots and short circuits in the rotor winding [7] along with visual inspection provide personnel of a turbo generator set of a power plant with enough information about some crucial conditions. However, some signs of failure cannot possibly be identified using ‘trained eye’ or simple electrical tests. In that case, some other methods or techniques could be required.
During maintenance of a turbo generator, there are three essential inspection levels [7]: major overhaul (MO), where bearings, coolers and the rotor are disassembled; limited inspection (LI), where parts of bearings and some winding covers are removed; and safety check (SC) where only inspection hatches are opened. Major overhaul allows identification of 85 % of failure modes, detect another 10 %, leaving the rest to be identified during operation only. Fig. 3 presents comparison between these three types of inspection in terms of number of detected and identified failure modes.
Fig. 2Statistical data on distribution of number of turbo generator failures that occurred during: a) a year, b) a week, c) a day (since 2001 until 2005)
a)
b)
c)
Fig. 3Detectability of failure modes with different types of inspection
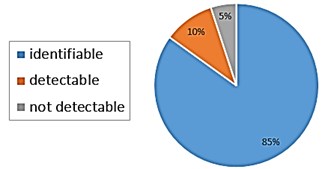
a) Major overhaul
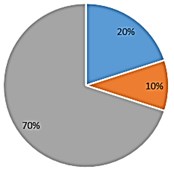
b) Limited inspection
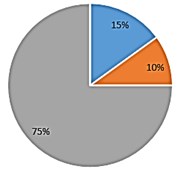
c) Safety check
Table 1Basic fault modes and detectability
Fault mode | Detectability |
Decrease/increase in pressure of hydrogen/oil | I during MO, visual |
Leakage of hydrogen/oil/water | I during MO, LI and SF, visual |
Increase/decrease in the concentration of hydrogen/oil/water in conductors/generator housing | I during MO, LI and SF, visual |
Fluid in the generator housing | I during MO and LI, visual |
Earth fault | D during MO, LI and SF, Visual and basic electric tests, RSO |
Reduced insulation resistance | D during MO, visual, PD and Basic electric tests |
Increased temperature of oil/Babbitt/etc | I during MO; D during MO, LI and SF with basic electric tests |
Short circuit | I and D during MO, RSO |
Sparking of the brushes | I during MO, LI and SF, visual |
Noise in the bearings/rotor | I during MO, LI and SF, visual |
Vibration in the bearings/rotor | I or D during MO and LI, visual |
Although more than a hundred different failure modes could be distinguished [7], analysis of more than 550 different cases in [2] suggests that the majority of them repeat from generator to generator and could be divided into the following main groups (Table 1). Along with possible causes of failure a comment based on analysis from [7] is given regarding its detectability (I stands for identifiable, D – detectable) and way to detect or identify a mode during a specific type of inspection (visual, basic electric test, repetitive surge oscilloscope tests (RSO), partial discharge (PD) tests).
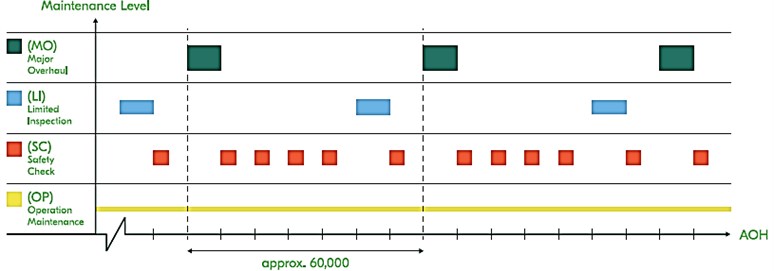
Results shown in Table 1 show that major overhaul is the most effective way of prevention of failure as most of the faults could be detected and/or identified during this type of maintenance. However, this procedure cannot possibly be executed frequently as it requires disassembly of the most parts of the generator which results in temporary operation interruption. A generalised maintenance plan of a turbo generator is presented in Fig. 4.
It could be seen from this plan, that the most effective checks are performed less often, so the growth phase of a failure might fall right in between them [7]. As the vast majority of failures occur and develop rapidly, it is absolutely necessary to be able to identify or detect possible failures or even predict future behaviour of a machine based on its present state. Such means are provided by various diagnostics tools and specialised tools based on application of artificial neural networks, as described in high detail, for instance in [8-11].
Despite the fact that there are many tools available presently used to detect and predict failure modes in turbine generators, personnel of power plants working directly with rotating machinery should be able to act based on their experience, and this paper gives some statistic information below based on analysis of some characteristic cases.
Fig. 4Generalised maintenance plan of a turbo generator
4. Results and discussion
The reasons for the stators malfunctioning were defects in terminals (35.6 %), winding rods and connecting bus bars (24.6 %), winding of cooling systems (10.2 %), winding of fastening systems (6.9 %), cores (6.9 %), as well as improper personnel actions (1.1 %). The main causes of the defects in the findings were use of sealing elements made of low quality rubber; improper installation of rubber sealing elements during repairs; weakening of the mounting of the output flange to the generator housing; humidification of isolation of outputs.
The main causes of rod defects were: technological defects in case insulation; abrasion of insulation and hollow conductors; wet insulation; cracks of case insulation; violation of the tightness of the stator winding water cooling system. These led to the following typical consequences: breakdown of insulation to the ground – 22.9 %; interphase short circuit – 16.9 %; flow of distillate – 19.8 %; hydrogen leak – 34.2 %; the rest (melting of contact compounds, decrease in insulation resistance, etc.) – 6.2 %.
The causes of rotor failures were defects in winding coils (33.8 %), slip rings (27.0 %), current leads (25.7 %), retaining rings (5.4 %), and the rest (8.1 %). These led to the following typical consequences: melting of current leads – 20.2 %; decrease in insulation resistance and short circuit to the housing – 18.6 %; increase in vibration – 13.6 %; coil closure with local melting – 8.5 %; melting or rupture of the turns – 8.5%; damage to slip rings – 6.8 %; damage to retaining rings – 5.1 %; flow of distillate – 10.2 %; hydrogen leakage – 5.1 %. The share of other consequences (insulation damage, circular fire, etc.) amounted to 3.4 %.
The causes of malfunction in the operation of the sealings and bearings were the defects and poor quality of the liners (29.9 %), sealing elements (23.4 %), oil systems, oil coolers, damper tanks (17.8 %), oil pressure regulators (9.3 %), buildings (5.6 %), thermal and vibration control systems (1.9 %), water supply and its fittings (0.9 %). The reasons were also: high vibration of the pillow block bearing (7.5 %), poor oil quality (1.9 %), as well as improper personnel actions (0.9 %). Other reasons account for 0.8 %. The most typical consequences of these were: temperature increase – 21.6 %; hydrogen leak – 18.6 %; oil leak – 12.7 %; decrease in oil level in the damper tank – 12.7 %; increased bearing vibration – 10.8 %; the rest is 20.7 %.
The causes of malfunction in the operation of the brushes and slip rings units were defects in the brushes (38.4 %), brush holders (17.8 %), contamination of brushes (11.0 %), objects getting into the brushes and slip rings units (9.6 %), improper personnel actions (8.2 %), improper adjustment of the units (4.1 %). In 2.7 % of cases, the cause was not determined. These led to the following typical consequences: sparking – 37.8 %; circular fire – 35.1 %; short circuit – 5.4 %; transition of the generator to asynchronous mode – 4.1 %; the rest is 17.6 %.
Defective assembly units (68.3 %), poor material quality of sealing elements (26.8%), as well as improper personnel actions (4.9 %) were the causes of malfunction of air and gas cooling systems. Tube defects account for 36.6 %. The most typical consequences of these: water leak – 61.5 %; hydrogen leak – 30.8 %; the rest is 7.7 %.
The main causes of malfunction in the work of pathogens were defects in the armature (42.5%), collector (10.0 %), coupling and torsion shaft (12.5 %), as well as improper personnel actions (2.5 %). These led to the following typical consequences: collector damage – 20.0 %; sparking – 11.4 %; breakdown to the ground – 8.6 %; increase in vibration level – 19.8 %; the rest is 40.2 %.
References
-
Mittel V. N., Mittal A. Basic Electrical Engineering. Tata McGrawl-Hill Publishing Company Limited, New Dehli, 2009.
-
Samorodov Y. N. Turbo Generators: Accidents and Incidents. ELEKS-KM, Moscow, 2008, (in Russian).
-
Rostik G. V. Assessment of the Technical Condition of Turbogenerators: a Training Manual. IPKgosluzhby, Moscow, 2008, (in Russian).
-
Samorodov Y. N. Defective Generators. CJSC Energy Technologies, Moscow, 2005, (in Russian).
-
Samorodov Y. N. Turbine Generator Crashes Due to Personnel Errors. LLC Elektroservis-NTTsG, Moscow, 2016, (in Russian).
-
Puzakov S. E., et al. Handbook for Repair of Turbogenerators. IPKgosluzhby, VIPKenergo, 2006, (in Russian).
-
Csaba G. Generator diagnostics: from failure modes to risk for forced outage. International Risk Management Conference, Long Beach, 2018.
-
Zhao R., et al. Machine health monitoring using local feature-based gated recurrent unit networks. IEEE Transactions on Industrial Electronics, Vol. 65, Issue 2, 2018, p. 1539-1548.
-
Liu R., et al. Artificial intelligence for fault diagnosis of rotating machinery: a review. Mechanical Systems and Signal Processing, Vol. 108, 2018, p. 33-47.
-
Saidi L., et al. Wind turbine high-speed shaft bearings health prognosis through a spectral kurtosis-derived indices and SVR. Applied Acoustics, Vol. 120, 2017, p. 1-8.
-
Diez Olivan A., et al. Data fusion and machine learning for industrial prognosis: Trends and perspectives towards Industry 4.0. Information Fusion, Vol. 50, 2019, p. 92-111.
Cited by
About this article

The work has been carried out within the project No. 05.607.21.0303 “Development of an intelligent monitoring technology and a prototype of the hardware and software complex for safety of energy complex facilities” supported by the Federal Target Program “Research and development in priority areas for the development of the scientific and technological complex of Russia for 2014 – 2020” by the Ministry of Science and Higher Education of Russian Federation (unique identifier of the research RFMEFI60719X0303).
