Abstract
Through equipment monitoring, the uptimes of machines are enhanced in the industrial applications. The unpredicted failures risks are minimized by the proper equipment monitoring. The machine vibrations are increased caused by the failure modes. The vibration data requires effective analysis by the accurate assessment of the machine equipment. For fault feature selection and detection of faults in rotating equipment, the empirical knowledge is required. Low efficiency of the methods and motor speed control are the main drawbacks of the existing techniques. So the basic aim of this paper is the detection of rotating equipment faults by utilizing the vibration analysis. The motor vibration is analyzed and monitored using spectrum analysis. The spectral content are extracted and fed into the classifier like k-Nearest neighbors (KNN), back-propagation neural network BPNN, Sparse Representation Classifier (SRC), Support vector machine (SVM) and Random Forest (RF) for the type of failure prediction and analyze the unbalance condition (UNB), bearing faults (BDF), and broken rotor bars (BRB) faults. The RF classifier is better as compared to other classifiers in terms of accuracy, precision and recalls values by approximately 10.92 %, 11.03 % and 20.13 % respectively.
Highlights
- In rotating machinery, faults may develop due to the high service load. The whole system is shutdown if the fault is not diagnosed in a timely way.
- The faults should be detected as early as possible to ensure the safe machinery operation safely. The rotating part of machine is highly prone to defects and commonly in non-linear and non-stationary rotating machines.
- The machine vibrations are increased caused by the failure modes. The vibration data requires effective analysis by the accurate assessment of the machine equipment.
- For fault feature selection and detection of faults in rotating equipment, the empirical knowledge is required.
- Low efficiency of the methods and motor speed control are the main drawbacks of the existing techniques.
- The motor vibration is analyzed and monitored using spectrum analysis.
1. Introduction
In modern industry, rotating machinery is the most used machine like compressors, industrial fans, and aircraft engines [1]. In rotating machinery, faults may develop due to the high service load. The whole system is shutdown if the fault is not diagnosed in a timely way. Therefore, faults should be detected as early as possible to ensure the safe machinery operation safely. The rotating part of machine is highly prone to defects and commonly in non-linear and non-stationary rotating machines [2, 3]. The defect in the machine is due to the surface roughness, dents, pits, etc., and it may be imminent.
Typical rotating machinery systems such as water turbine are critical equipment support of the national economy. The performance of rotating machinery is the main concern so there is great significance of rotating machinery fault diagnosis [4]. The sensor readings relationships are nondeterministic, e.g., for accurate condition monitoring, a single sensor is incapable of collecting enough data, so there is need of multiple data. The machinery fault simulator (MFS) is shown in Fig. 1. Most of the faults can simulate that commonly occur in rotating machinery like gearbox defects.
To detect the health of the machine, transformation, segregation and classification algorithms are utilized. The transforms are used for extraction of vibration signal features which are obtained from the rotating machine [5]. It is concluded by the authors after analytic comparison that entire data set and predict the health of the machine, only Decision Trees are fitted [6, 7]. Due to prevailing variance, decision tree algorithm suffers from the malice of over-fitting of data.
The electrical equipment diversity like motors, electric vehicles, and energy transmission etc. are increasing from the past few years. The reason behind this exponential growth is the need for the various activities performance like cell phone battery charging or starting the car etc. [8, 9].
The components failure can generate:
1) High economic losses.
2) Degradation on its performance.
3) Outages in the production process.
Fig. 1The machinery fault simulator
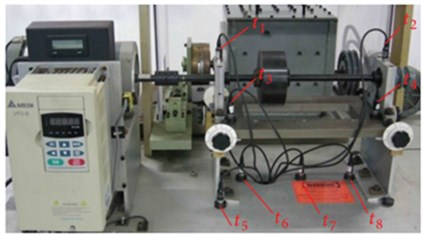
a) The front view
b) The side view
The condition monitoring strategy consists different steps.
1) Collection of data through different sensors.
2) Feature extraction and data processing.
3) Data analysis for condition valuation.
The origin of vibration is from different sources like fluid flow and rotating elements etc. The structural properties and boundary conditions may change with time and the large statistical deviations are showed by the vibration response [10-12].
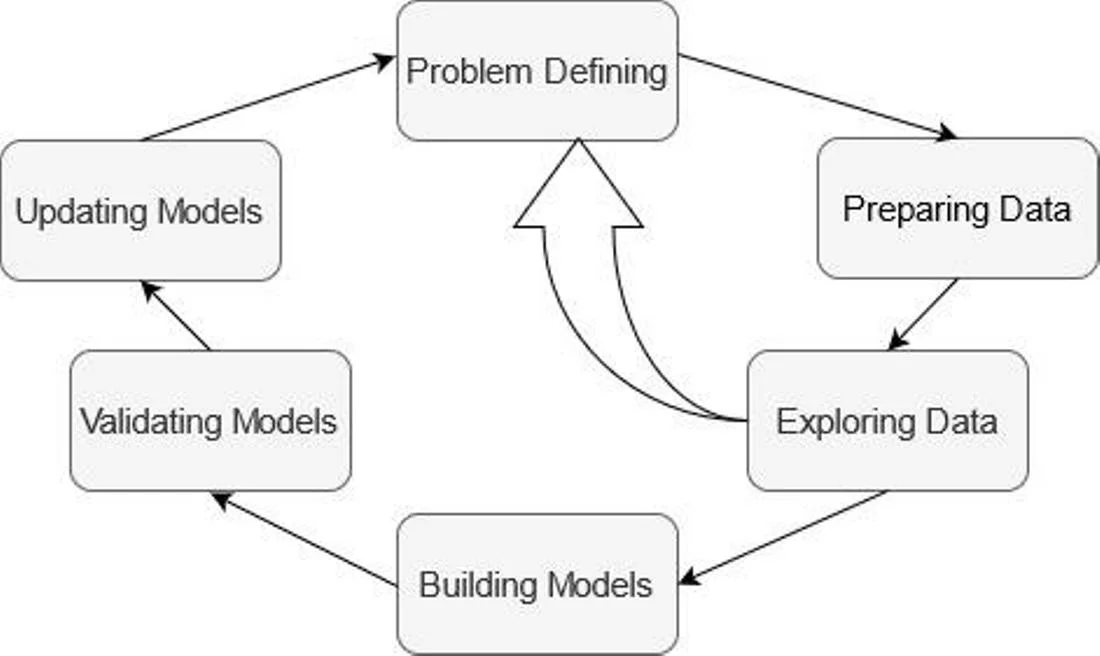
The pattern extraction process from the data is the data mining as given in Fig. 2. The hidden patterns are generally searched that may exist in large databases. The patterns and correlations between patterns are discovered by the data mining scans through large datasets. The statistical models and machine learning methods are the different tools [13, 14]. The data analysis and prediction is included in the data mining along with the collection and managing the data. The data is represented in quantitative, textual, or multimedia forms that can be performed on data mining. The data is examined by the variety of parameters used by the data mining applications [15]. Defining the problem, data preparation and exploration, building models, model exploration and validation are the basic steps that can be defined.
Fig. 2Pattern extraction process

The business problem, business requirements, defining the problem scope, evaluation of the model is included in the first step. The second step includes the consolidation and cleaning of the data. The mean and standard deviations calculation are included in the third step. The prepared data is randomly separated into separate training and testing datasets before building the model [16]. The data mining process for model exploration is included in fifth step to test the effectiveness of model.
For all the ML methods, data is the foundation and the collection is required for effective ML algorithms. The data collected by most of the researchers and conduct the experiment by utilizing induced faults, or with accelerated life testing techniques in recent research papers. The 15 number of audios, 6 number of bearing faults motor audio, 5 numbers of unbalanced condition motor audio and 4 numbers of broken rotor audio are collected as an input [17]. Case Western Reserve University (CWRU) dataset obliges as a fundamental dataset for the validation of various algorithm validation purposes. The other dataset Paderborn University Dataset is utilized which includes the motor vibration signals measurement. High sampling rate is utilized for measuring the vibration signals.
The machine vibrations are increased by all the failure modes and is the most widely technique for equipment condition determination. An AC motor drive is utilized to control the operational speed of the motor and set up the motor condition monitoring experiment. The motor’s vibration is measured and monitored which is then analyzed the measured vibration data by using the spectrum analysis [18]. The comparison of vibration severity level is done with the standard severity table after overall monitoring the vibration level. It is then utilized for the condition of motor vibration determination. The kind of fault or failure mode in the motor vibration is identified by the specific natural frequency. Low efficiency of the methods and motor speed control are the main drawbacks of the existing methods.
The rest of the paper is organized as follows. Section 2 provides an overview of the exhaustive literature survey followed by the different methods detail for engine vibration in Section 3. The Performance analysis and parameters are detailed in the Section 4. The comparative analysis of different methods is detailed in Section 5. Finally, concluding remarks are provided in Section 6.
2. Related work
To the operational reliability, the basis for condition-based maintenance is provided by the diagnosis of machine fault and the remaining service life prognosis [19]. By examining the change in frequency components, effective analysis of vibration data is required for the accurate assessment of machine health. The empirical knowledge for fault is the limitation of these methods from which “visual word” features are extracted for fault related patterns recognition which are then classified by fed into sparse representation-based classifier. The effectiveness of the developed method is evaluated by the experimental bearing data with 99.7 % accuracy. The work on bearing fault diagnostics with deep learning (DL) algorithms is summarized by the author [20]. The conventional ML methods are briefly reviewed for bearing fault applications into the existing DL algorithms. The fault feature extraction and classification performances are analyzed by the DL based methods. By utilizing the open source Case Western Reserve University (CWRU) bearing dataset, different algorithms classification accuracy are done by the comparative study. The various algorithms are applied to the fault diagnostics and for specific application conditions, the detailed recommendations and suggestions are provided. In industrial environments, the severe damage of infrastructure is prevented by the diagnosis (FDD) with rotating machinery (RM) and condition monitoring (CM) [21]. As the induction motor (IM) is cheap and robust, it has been used in various industries. There is a serious breakdown of IM by the failure of this basic component. In the every field of the digital technology, there is great significance of Artificial intelligence (AI) techniques. In this paper, the authors presented the extensive literature review of CM and FDD of the IM. The merits and demerits of each method are highlighted in this study and then finally challenges are detailed. For the significant cost benefits to the industry, the useful and the reliable information is provided by the vibration method in the machine condition monitoring. There is possibility of detection of the defected journal bearings by comparing the machine running signals in both normal and faulty condition [22]. By using statistical and vibration parameters, 30 features were extracted which are then input to the classifiers. From the obtained results, it is demonstrated that the SVM performance is better as compared to the FLD and KNN. Authors in this paper details the data mining which has been gaining importance in many areas and attracting the all over the world’s researchers [23]. It has many benefits such as large database exploitation and the extracted information usage through the analysis. The data mining techniques are reviewed and provided in this paper for faults in electric equipment diagnosis and detection. For the diagnosis of electric equipment, for the classification and egression, different methods are used from the year 2000 to the present. For vibration-based structural health monitoring, there is a rapid growth in the deep learning technology [24]. For system diagnosis, features are extracting from the vibration and the measures signals are correlated to the structure’s current status. The large deviation is showed in the measured vibration and monitored the system’s transient characteristics. The influence of surrounding environments is discarded by the vibration which requires the complete understanding of the extracted features. Due to flexibility and robustness, increasing application in these complex problems is found by the deep-learning-based algorithms. The machine learning algorithms are applied for fault monitoring and the review is provided in the summary. Authors describe the data mining methods for steam turbine fault diagnostics which is based on continuous data measurements [25]. The standardized vibration frequency data based classification rules are used for steam turbines and field experts’ analyses of turbine vibration problems. The steam turbine fault diagnosis system is enabled by the expert knowledge which is more accurate and powerful. The twenty types of standard steam turbine faults are identified by the system. The 2000 simulated data sets are utilized by the system and 20 explicit rules are identified by the data mining methods for the turbine faults. The data mining can be effectively applied to diagnosis of rotating machinery as it is indicated by the results by giving useful rules for data interpretation. In the various industrial applications, rotating machinery is applied and is a promising field [26]. From industry, the early fault diagnosis (EFD) techniques have attracted increasing attention. To reduce financial losses and to prevent severe failures, appropriate information is provided for taking necessary maintenance actions. In this paper, author review and summarize the gears and bearings EFD. The fault frequency-based methods and artificial intelligence-based methods are the two aspects which are reviewed in the EFD applications. Author details the different classification algorithms for the vibration signal classification as a healthy or faulty method [27]. Identification is a task of fitting classification algorithm which is done at the problem statement identification. The Probabilistic Neural Network (PNN), decision tree (DT), and Radial Basis Network (RBN) are the machine learning techniques which are utilized as a classification algorithms. The Bootstrap Aggregation methods are the used to improve prediction and the decision tree algorithm which are assembled parallel [28].
Various methods for vibration fault analysis with their merits and demerits are shown in Table 1.
3. Fault detection method
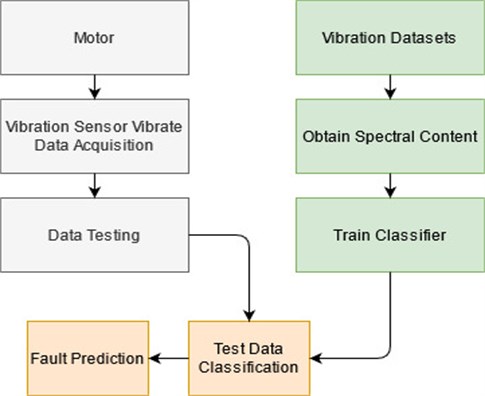
Based on vibration signals analysis, the method is utilized for the detection of faults in steady state operation of motors. The flowchart is shown in Fig. 3. The decomposition of vibration signal is done in numerous intrinsic mode functions (IMF). Subsequently, the spectral content of the IMF is obtained in the frequency domain by calculating the frequency marginal of the Gabor representation. The type of failure occurred in the motor is predicted by SVM or RF. The number of samples is used to train the classifier before prediction. Advantages of the proposed method:
1) Maintenance cost is reduced.
2) Fault detection ability is increased.
3) Reduction of noise and interference.
The audios are initially input into the filter which is utilized to filter the input audios. The 15 number of audios, 6 number of bearing faults motor audio, 5 numbers of unbalanced condition motor audio and 4 numbers of broken rotor audio are collected as an input.
Table 1Methods for vibration fault analysis
Methods | Merits | Demerits | Reference |
Text mining and data mining | From the warranty database, valuable information is retrieved Rather than error-correction learning, SOM is employed | Not cost effective | [29] |
Transfer learning for gear fault diagnosis | Highly accurate gear fault diagnosis The subjective preprocessing techniques are not involved Viable and robust | The input and output relationship is not linear | [30] |
Audio and vibration-based techniques | The improved distance evaluation. Exploit the nonlinear nature of faulty signals | Lack of large databases in fault diagnosis | [31] |
Multi-sensor vibration signal monitoring | Encourages development of vibrational fault detection systems for control of engine. Various faults detection. Higher specificity | Much more expensive since they may lead to higher cost | [32] |
Audio data for detection and faults diagnosis in railway condition | Cost-effective, automatic detection and diagnosis of railway faults through the analysis of audio data | Failure to uncover faults. | [33] |
Gear transmission systems failure utilizing vibration sensor signal | Improvement on its slew rate | Suitable noise cancellations are crucial to be incorporated. | [34] |
Swarm intelligence optimized multiclass multi-kernel relevant vector machine | Improving budgeting/forecasting Enabling just-in-time maintenance | Limits performance in failure identification/ | [35] |
Health state classification based hierarchical convolutional network | Effective and reliable High-level feature representations | Generalization ability limited. | [36] |
Wireless sensor network | Less transmission time Reduce the data volume | Limited resources | [37] |
The frequency spectrum of the rotor system’s vibration signal | High accuracy Obtain better classification | Fail to distinguish sample classes | [38] |
First of all the spectral content is extracted from the vibration dataset and then classifier is utilized for classification of test data which is acquired by the vibration sensor. After data testing, test data is classified which results in prediction of machine faults.
3.1. Fault classification by different classifiers
3.1.1. Support vector machine (SVM)
The linear separating hyper plane is utilized for training sample division into the classes in the SVM classifier. To achieve this task, there are two suitable methods: first method is to find out the optimal decision hyper plane [39, 40]. The second method is optimal decision hyper-plane which makes the boundary between the two parallel planes. The optimal hyperplane and the support points are produced by these two methods. Computing the SVM classifier amounts for minimizing an expression of the form as given in Eq. (1):
Various real world problems are solved by the SVM.
1) It is helpful in categorization of text and hypertext
2) It can also perform the image classification with higher accuracy.
3) Satellite data classification is done using supervised SVM.
Fig. 3The presented model
3.2. Random forest (RF)
For classification and regression, the RF is utilized based on the trees grouping. This method is Tree type based classifier and named as a component predictor. The RF is made from a large number tree and this RF tool is used classifiers in data mining techniques due to its accuracy [41, 42]. This is the most suitable method for ensemble building by the random vectors which are generated via random selection procedure from integrated training set.
The unseen samples x' predictions can be made by the predictions from all the individual regression trees averages on as shown in Eq. (2):
3.2.1. Sparse representation classifier (SRC)
The SRC is the pattern classification technique [43]. The setup is simple and the classification by this technique is highly accurate. Using truncation way, the SRC classification criterion is from the residuals. The demerit of SRC is if the th residual is the smallest then the SRC judges that the test sample belongs to the th class. There are variations to the sparse approximation problem.
1) Structured sparsity.
2) Collaborative (joint) sparse coding.
3) Other structures.
3.2.2. k-Nearest neighbors (KNN)
The simplest data mining classification method is KNN. Representing the texting sample in the same space and its nearest neighbors obtained [44, 45]. The neighbors class is counted and the “votes’’ class is classified of the testing samples. The Euclidean distance is computed by the nearest neighbors and each of the training samples [46, 47]. The Euclidean distance between the -th training sample and the testing sample Tests is defined in Eq. (3):
where 1, 2,…, , 1, 2,…, , where, number of features, training samples.
The fault classification of rotating machinery is easily done by the KNN method.
3.2.3. Back propagation neural network (BPNN)
The complex decision boundaries in the feature space are generated by the BPNN classifier. A BPNN can approximate Bayesian posterior probabilities at its outputs. For a feature data, the best performance is provided by the Bayesian classifier [48]. The performance of a BPNN is not priori possible as with other non-parametric method to pattern classification [49, 50]. The BPNN chooses several parameters including training samples, the hidden nodes, and the learning rate. Back-propagation generalizes the gradient in the delta rule, which is the single-layer version of back-propagation.
4. Performance analysis and parameters
Fault diagnose is methods are based on SVM which regard the problem of diagnosis as a classification one. Training of classifiers and fault prediction is done by utilizing the vibration dataset for run time faults.
4.1. Accuracy
The system’s accuracy of actual class and predicted class outcome values is defined as shown in Eq. (4):
where, TP = True Positive, TN = True Negative, FP = False Positive, FN = False Negative.
4.2. Precision
The fraction of accurate predicted results from the input is defined as the Precision as shown in the Eq. (5):
4.3. Recall
The positive cases percentage was identified accurately is known as recall. It is also called as true positive rate (TP). It is calculated by using the equation as given in Eq. (6):
5. Comparative performance analysis study
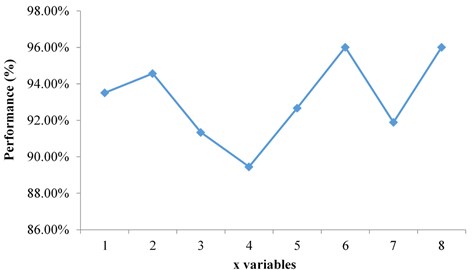
The different classifiers performance is demonstrated in this section. The results obtained by different classifiers such as SVM, RF, SRC, -Nearest neighbors (KNN) and BPNN compared for the effectiveness of the proposed technique. Tables 2 list the results of RF classifier under variable parameter. The RF classifier performance is calculated and analyzed which is then compared with the other classifiers also. By examining Table 2, it is obtained that the best accuracy of 96.01 % is observed, which belonged to 6 and 8. As the computation time for variable 8 is less as compared to variable 6 so the best accuracy is obtained by variable 8.
Table 2Performance of RF classifier
variables | Performance (%) | Time (S) |
1 | 93.51 % | 0.0051 |
2 | 94.57 % | 0.0044 |
3 | 91.34 % | 0.0039 |
4 | 89.45 % | 0.0041 |
5 | 92.67 % | 0.0042 |
6 | 96.01 % | 0.0037 |
7 | 91.89 % | 0.0043 |
8 | 96.01 % | 0.0032 |
The graphical representation is also shown in Fig. 4 which illustrates the accuracy rate difference for the different values of . The redundant features are removed by proper feature selection method from the original feature set and it lead to decrease in accuracy rate by reducing the features.
Fig. 4RF classifier performance
Evaluation of the classifiers is done in terms of precision, accuracy and recall. The different classifiers are compared in terms of accuracy, precision and recall values. The parameter values obtained by different classifiers are tabulated in Table 3. For better visualization, the different parametric values are also represented graphically in Figs. 5-7.
The graphical representation of accuracy values obtained from different classifiers shows that the high accuracy is obtained by the RF classifier as shown in Fig. 5. The values obtained by different classifiers such as KNN, BPNN, SRC, SVM and RF are 86.56 %, 89.21 %, 95.89 %, 94.34 % and 96.01 % respectively. The obtained results show that the RF classifier is more accurate and efficient in terms of accuracy values.
Table 3Comparison of accuracy, precision and recall values from the different classifiers
Classifier | Accuracy | Precision | Recall |
KNN | 86.56 % | 74.24 % | 83.24 % |
BPNN | 89.21 % | 76.57 % | 87.52 % |
SRC | 95.89 % | 76.95 % | 92.65 % |
SVM | 94.34 % | 78.41 % | 97.41 % |
RF | 96.01 % | 82.43 % | 100 % |
After analyzing the accuracy values of different classifiers, precision values are visualized and shown graphically in Fig. 6. The obtained precision values are 74.24 %, 76.57 %. 76.95 %, 78.41 % and 82.43 % by the KNN, BPNN, SRC, SVM and RF classifiers respectively. The obtained precision values result shows that the RF classifier is best in terms of precision value.
Fig. 5Accuracy values obtained from different classifiers
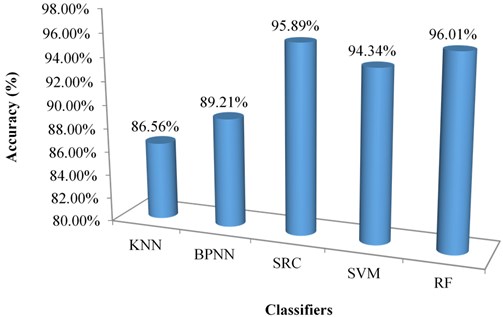
Fig. 6Precision values obtained from different classifiers
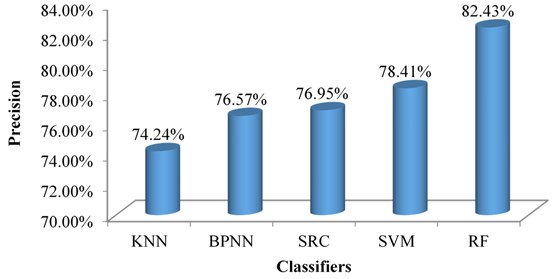
Fig. 7Recall values obtained from different classifiers
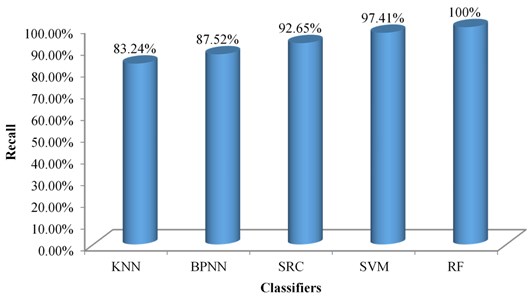
The recall value is also analyze for different classifiers and visualized by presenting the values in the graphical form in Fig. 7. The results obtained in terms of recall values are 83.24 %, 87.52 %, 92.65 %, 97.41 % and 100 % from the KNN, BPNN, SRC, SVM and RF respectively.
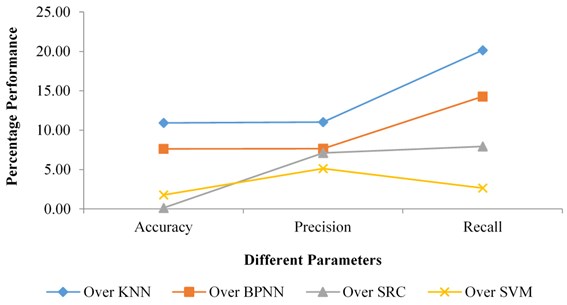
It is clear from the graph that the recall value obtained by the RF is 100 % and highest from all other classifiers. From the results of the different classifiers, it is obtained that the best results are provided by the RF classifier in terms of all the three parameters that are accuracy, precision and recall values. The percentage improvement of the RF classifier is calculated and tabulated in Table 4. The table shows the improvement of the RF classier over KNN, BPNN, SRC and SVM classifiers.
Table 4Percentage improvement of RF classifier over other classifiers
Classifier | Over KNN | Over BPNN | Over SRC | Over SVM |
Accuracy | 10.92 % | 7.62 % | 0.13 % | 1.77 % |
Precision | 11.03 % | 7.65 % | 7.12 % | 5.13 % |
Recall | 20.13 % | 14.26 % | 7.93 % | 2.66 % |
Better analysis of percentage improvement is done by visualizing the values graphically as shown in Fig. 8.
The accuracy improvement of RF classifier over KNN, BPNN, SRC and SVM are 10.92 %, 7.62 %, 0.13 % and 1.77 % respectively. In terms of precision values, the RF classifier is better than the KNN, BPNN, SRC and SVM by 11.03 %, 7.65 %, 7.12 % and 5.13 % respectively. When we see the improvement of RF classier in terms of recall values then the improvement of RF is shown over KNN, BPNN, SRC and SVM is 20.13 %, 14.26 %, 7.93 % and 2.66 % respectively.
Fig. 8Percentage improvement of RF classifier
6. Conclusions
The machine vibrations are increased by all the failure modes and is the most widely technique for equipment condition determination. An AC motor drive is utilized to control the operational speed of the motor and set up the motor condition monitoring experiment. The motor’s vibration is measured and monitored which is then analyzed the measured vibration data by using the spectrum analysis. By analyzing acoustic sound signals, the detection of faults in the induction motors such as broken rotor bars, defects in bearings is demonstrated by the presented technique. The preprocessing of the signal is done by utilizing the preprocessing stage and then the spectrum estimation is improved. The spectral content are extracted and fed into the classifier like KNN, BPNN, SRC, SVM and RF for the type of failure prediction. The classifiers are trained with various numbers of samples before prediction. In this paper, UNB, BDF and BRB faults are analyzed. The classifiers utilized in this work are compared in terms of accuracy, precision and recall values and it is obtained that the best performance is obtained by the RF classifier. The accuracy improvement of RF classifier over KNN, BPNN, SRC and SVM are 10.92 %, 7.62 %, 0.13 % and 1.77 % respectively. The improvement of RF classier in terms of recall values is better than the KNN, BPNN, SRC and SVM is 20.13 %, 14.26 %, 7.93 % and 2.66 % respectively. The method’s application on machines and the different bearing positions vibrations signatures are fields for the future concern. Future direction of the work is for implementation of the novel and the hybrid classifier for better results.
References
-
R. X. Gao and P. Wang, “Through life analysis for machine tools: from design to remanufacture,” Procedia CIRP, Vol. 59, pp. 2–7, 2017, https://doi.org/10.1016/j.procir.2016.09.027
-
J. Wang, S. Liu, R. X. Gao, and R. Yan, “Current envelope analysis for defect identification and diagnosis in induction motors,” Journal of Manufacturing Systems, Vol. 31, No. 4, pp. 380–387, Oct. 2012, https://doi.org/10.1016/j.jmsy.2012.06.005
-
G. E. Hinton, “To recognize shapes, first learn to generate images,” in Progress in Brain Research, Vol. 165, Elsevier, 2007, pp. 535–547, https://doi.org/10.1016/s0079-6123(06)65034-6
-
R.-V. Sanchez, Z. Chen, X. Chen, C. Li, and H. Qin, “Vibration-based gearbox fault diagnosis using deep neural networks,” Journal of Vibroengineering, Vol. 19, No. 4, pp. 2475–2496, Jun. 2017, https://doi.org/10.21595/jve.2016.17267
-
R. Yan, R. X. Gao, and X. Chen, “Wavelets for fault diagnosis of rotary machines: A review with applications,” Signal Processing, Vol. 96, pp. 1–15, Mar. 2014, https://doi.org/10.1016/j.sigpro.2013.04.015
-
F. Immovilli and M. Cocconcelli, “Experimental investigation of shaft radial load effect on bearing fault signatures detection,” IEEE Transactions on Industry Applications, Vol. 53, No. 3, pp. 2721–2729, May 2017, https://doi.org/10.1109/tia.2016.2633236
-
T. Ince, S. Kiranyaz, L. Eren, M. Askar, and M. Gabbouj, “Real-time motor fault detection by 1-D convolutional neural networks,” IEEE Transactions on Industrial Electronics, Vol. 63, No. 11, pp. 7067–7075, Nov. 2016, https://doi.org/10.1109/tie.2016.2582729
-
S. F. Rabbi, M. L. Little, S. A. Saleh, and M. A. Rahman, “A novel technique using multiresolution wavelet packet decomposition for real time diagnosis of hunting in line start IPM motor drives,” IEEE Transactions on Industry Applications, Vol. 53, No. 3, pp. 3005–3019, May 2017, https://doi.org/10.1109/tia.2016.2633541
-
M. Wolkiewicz, G. Tarchala, T. Orlowska-Kowalska, and C. T. Kowalski, “Online stator interturn short circuits monitoring in the DFOC induction-motor drive,” IEEE Transactions on Industrial Electronics, Vol. 63, No. 4, pp. 2517–2528, Apr. 2016, https://doi.org/10.1109/tie.2016.2520902
-
J. Zhao, M. Mathieu, and Y. Lecun, “Energy-based generative adversarial network,” arXiv:1609.03126, Mar. 2017.
-
K. Simonyan and A. Zisserman, “Very deep convolutional networks for large-scale image recognition,” arXiv:1409.1556v6, Dec. 2014.
-
K. Yu, Y. Liu, and A. Sharma, “Analyze the effectiveness of the algorithm for agricultural product delivery vehicle routing problem based on mathematical model,” International Journal of Agricultural and Environmental Information Systems, Vol. 12, No. 3, pp. 26–38, Jul. 2021, https://doi.org/10.4018/ijaeis.2021070103
-
C. Lu, Z.-Y. Wang, W.-L. Qin, and J. Ma, “Fault diagnosis of rotary machinery components using a stacked denoising autoencoder-based health state identification,” Signal Processing, Vol. 130, pp. 377–388, Jan. 2017, https://doi.org/10.1016/j.sigpro.2016.07.028
-
B. Luo, H. Wang, H. Liu, B. Li, and F. Peng, “Early fault detection of machine tools based on deep learning and dynamic identification,” IEEE Transactions on Industrial Electronics, Vol. 66, No. 1, pp. 509–518, Jan. 2019, https://doi.org/10.1109/tie.2018.2807414
-
K. H. Jin, M. T. Mccann, E. Froustey, and M. Unser, “Deep convolutional neural network for inverse problems in imaging,” IEEE Transactions on Image Processing, Vol. 26, No. 9, pp. 4509–4522, Sep. 2017, https://doi.org/10.1109/tip.2017.2713099
-
D. J. Hand and N. M. Adams, Wiley StatsRef: Statistics Reference Online. Wiley, 2015, pp. 1–7, https://doi.org/10.1002/9781118445112.stat06466.pub2
-
G. Zhao, D. X. Jiang, K. Li, and J. H. Diao, “Data mining for fault diagnosis and machine learning for rotating machinery,” Key Engineering Materials, Vol. 293-294, pp. 175–182, Sep. 2005, https://doi.org/10.4028/www.scientific.net/kem.293-294.175
-
X. Li, W. Zhang, Q. Ding, and X. Li, “Diagnosing rotating machines with weakly supervised data using deep transfer learning,” IEEE Transactions on Industrial Informatics, Vol. 16, No. 3, pp. 1688–1697, Mar. 2020, https://doi.org/10.1109/tii.2019.2927590
-
J. Zhang, P. Wang, R. X. Gao, and R. Yan, “An image processing approach to machine fault diagnosis based on visual words representation,” Procedia Manufacturing, Vol. 19, pp. 42–49, 2018, https://doi.org/10.1016/j.promfg.2018.01.007
-
S. Zhang, S. Zhang, B. Wang, and T. G. Habetler, “Deep learning algorithms for bearing fault diagnostics-a comprehensive review,” IEEE Access, Vol. 8, pp. 29857–29881, 2020, https://doi.org/10.1109/access.2020.2972859
-
O. Alshorman et al., “A review of artificial intelligence methods for condition monitoring and fault diagnosis of rolling element bearings for induction motor,” Shock and Vibration, Vol. 2020, pp. 1–20, Nov. 2020, https://doi.org/10.1155/2020/8843759
-
A. Sharma and N. Kumar, “Third eye: an intelligent and secure route planning scheme for critical services provisions in internet of vehicles environment,” IEEE Systems Journal, pp. 1–12, 2021, https://doi.org/10.1109/jsyst.2021.3052072
-
A. Contreras-Valdes, J. P. Amezquita-Sanchez, D. Granados-Lieberman, and M. Valtierra-Rodriguez, “Predictive data mining techniques for fault diagnosis of electric equipment: a review,” Applied Sciences, Vol. 10, No. 3, p. 950, Feb. 2020, https://doi.org/10.3390/app10030950
-
G. Toh and J. Park, “Review of vibration-based structural health monitoring using deep learning,” Applied Sciences, Vol. 10, No. 5, p. 1680, Mar. 2020, https://doi.org/10.3390/app10051680
-
Wei, Li, Xu, and Huang, “A review of early fault diagnosis approaches and their applications in rotating machinery,” Entropy, Vol. 21, No. 4, p. 409, Apr. 2019, https://doi.org/10.3390/e21040409
-
R. Liu, B. Yang, E. Zio, and X. Chen, “Artificial intelligence for fault diagnosis of rotating machinery: A review,” Mechanical Systems and Signal Processing, Vol. 108, pp. 33–47, Aug. 2018, https://doi.org/10.1016/j.ymssp.2018.02.016
-
R. Megala and V. Eswaramoorthy, “Faults detection and failures prediction using vibration analysis,” in International Research Journal of Engineering and Technology (IRJET), Vol. 5, No. 6, 2018.
-
N. K. Verma, R. K. Sevakula, S. Dixit, and A. Salour, “Intelligent condition based monitoring using acoustic signals for air compressors,” IEEE Transactions on Reliability, Vol. 65, No. 1, pp. 291–309, Mar. 2016, https://doi.org/10.1109/tr.2015.2459684
-
M. Alkahtani, A. Choudhary, A. De, and J. A. Harding, “A decision support system based on ontology and data mining to improve design using warranty data,” Computers and Industrial Engineering, Vol. 128, pp. 1027–1039, Feb. 2019, https://doi.org/10.1016/j.cie.2018.04.033
-
P. Cao, S. Zhang, and J. Tang, “Preprocessing-free gear fault diagnosis using small datasets with deep convolutional neural network-based transfer learning,” IEEE Access, Vol. 6, pp. 26241–26253, 2018, https://doi.org/10.1109/access.2018.2837621
-
P. Henriquez, J. B. Alonso, M. A. Ferrer, and C. M. Travieso, “Review of automatic fault diagnosis systems using audio and vibration signals,” IEEE Transactions on Systems, Man, and Cybernetics: Systems, Vol. 44, No. 5, pp. 642–652, May 2014, https://doi.org/10.1109/tsmcc.2013.2257752
-
K. Jafarian, M. Mobin, R. Jafari-Marandi, and E. Rabiei, “Misfire and valve clearance faults detection in the combustion engines based on a multi-sensor vibration signal monitoring,” Measurement, Vol. 128, pp. 527–536, Nov. 2018, https://doi.org/10.1016/j.measurement.2018.04.062
-
J. Lee, H. Choi, D. Park, Y. Chung, H.-Y. Kim, and S. Yoon, “Fault detection and diagnosis of railway point machines by sound analysis,” Sensors, Vol. 16, No. 4, p. 549, Apr. 2016, https://doi.org/10.3390/s16040549
-
Z. Li, Y. Jiang, C. Hu, and Z. Peng, “Recent progress on decoupling diagnosis of hybrid failures in gear transmission systems using vibration sensor signal: A review,” Measurement, Vol. 90, pp. 4–19, Aug. 2016, https://doi.org/10.1016/j.measurement.2016.04.036
-
Z. Li, Y. Jiang, Z. Duan, and Z. Peng, “A new swarm intelligence optimized multiclass multi-kernel relevant vector machine: An experimental analysis in failure diagnostics of diesel engines,” Structural Health Monitoring, Vol. 17, No. 6, pp. 1503–1519, Nov. 2018, https://doi.org/10.1177/1475921717746735
-
C. Lu, Z. Wang, and B. Zhou, “Intelligent fault diagnosis of rolling bearing using hierarchical convolutional network based health state classification,” Advanced Engineering Informatics, Vol. 32, pp. 139–151, Apr. 2017, https://doi.org/10.1016/j.aei.2017.02.005
-
S. Lu, P. Zhou, X. Wang, Y. Liu, F. Liu, and J. Zhao, “Condition monitoring and fault diagnosis of motor bearings using undersampled vibration signals from a wireless sensor network,” Journal of Sound and Vibration, Vol. 414, pp. 81–96, Feb. 2018, https://doi.org/10.1016/j.jsv.2017.11.007
-
Q. Yao, J. Wang, L. Yang, H. Su, and G. Zhang, “A fault diagnosis method of engine rotor based on random forests,” in 2016 IEEE International Conference on Prognostics and Health Management (ICPHM), pp. 1–4, Jun. 2016, https://doi.org/10.1109/icphm.2016.7542838
-
A. Kaur and I. Kaur, “An empirical evaluation of classification algorithms for fault prediction in open source projects,” Journal of King Saud University – Computer and Information Sciences, Vol. 30, No. 1, pp. 2–17, Jan. 2018, https://doi.org/10.1016/j.jksuci.2016.04.002
-
A. Sharma, R. Kumar, M. W. A. Talib, S. Srivastava, and R. Iqbal, “Network modelling and computation of quickest path for service-level agreements using bi-objective optimization,” International Journal of Distributed Sensor Networks, Vol. 15, No. 10, p. 155014771988111, Oct. 2019, https://doi.org/10.1177/1550147719881116
-
A. Sharma, M. D. Ansari, and R. Kumar, “A comparative study of edge detectors in digital image processing,” in 2017 4th International Conference on Signal Processing, Computing and Control (ISPCC), pp. 246–250, Sep. 2017, https://doi.org/10.1109/ispcc.2017.8269683
-
A. Djeffal, M. C. Babahenini, and A. T. Ahmed, “Fast binary support vector machine learning method by samples reduction,” International Journal of Data Mining, Modelling and Management, Vol. 9, No. 1, pp. 1–16, 2017, https://doi.org/10.1504/ijdmmm.2017.082555
-
A. Sharma and R. Kumar, “Service-level agreement-energy cooperative quickest ambulance routing for critical healthcare services,” Arabian Journal for Science and Engineering, Vol. 44, No. 4, pp. 3831–3848, Apr. 2019, https://doi.org/10.1007/s13369-018-3687-z
-
M. Poongodi et al., “Prediction of the price of Ethereum blockchain cryptocurrency in an industrial finance system,” Computers and Electrical Engineering, Vol. 81, p. 106527, Jan. 2020, https://doi.org/10.1016/j.compeleceng.2019.106527
-
K. Rudaś and S. Jaroszewicz, “Linear regression for uplift modeling,” Data Mining and Knowledge Discovery, Vol. 32, No. 5, pp. 1275–1305, Sep. 2018, https://doi.org/10.1007/s10618-018-0576-8
-
A. Sharma and R. Kumar, “Computation of the reliable and quickest data path for healthcare services by using service-level agreements and energy constraints,” Arabian Journal for Science and Engineering, Vol. 44, No. 11, pp. 9087–9104, Nov. 2019, https://doi.org/10.1007/s13369-019-03836-4
-
M. Fan and A. Sharma, “Design and implementation of construction cost prediction model based on SVM and LSSVM in industries 4.0,” International Journal of Intelligent Computing and Cybernetics, Vol. 14, No. 2, pp. 145–157, Apr. 2021, https://doi.org/10.1108/ijicc-10-2020-0142
-
Z. Dai, A. Almahairi, P. Bachman, E. Hovy, and A. Courville, “Calibrating energy-based generative adversarial networks,” arXiv:1702.01691, Feb. 2017.
-
C. K. Madhusudana, H. Kumar, and S. Narendranath, “Fault diagnosis of face milling tool using decision tree and sound signal,” Materials Today: Proceedings, Vol. 5, No. 5, pp. 12035–12044, 2018, https://doi.org/10.1016/j.matpr.2018.02.178
-
Z. Du, B. Fan, X. Jin, and J. Chi, “Fault detection and diagnosis for buildings and HVAC systems using combined neural networks and subtractive clustering analysis,” Building and Environment, Vol. 73, pp. 1–11, Mar. 2014, https://doi.org/10.1016/j.buildenv.2013.11.021
Cited by
About this article

