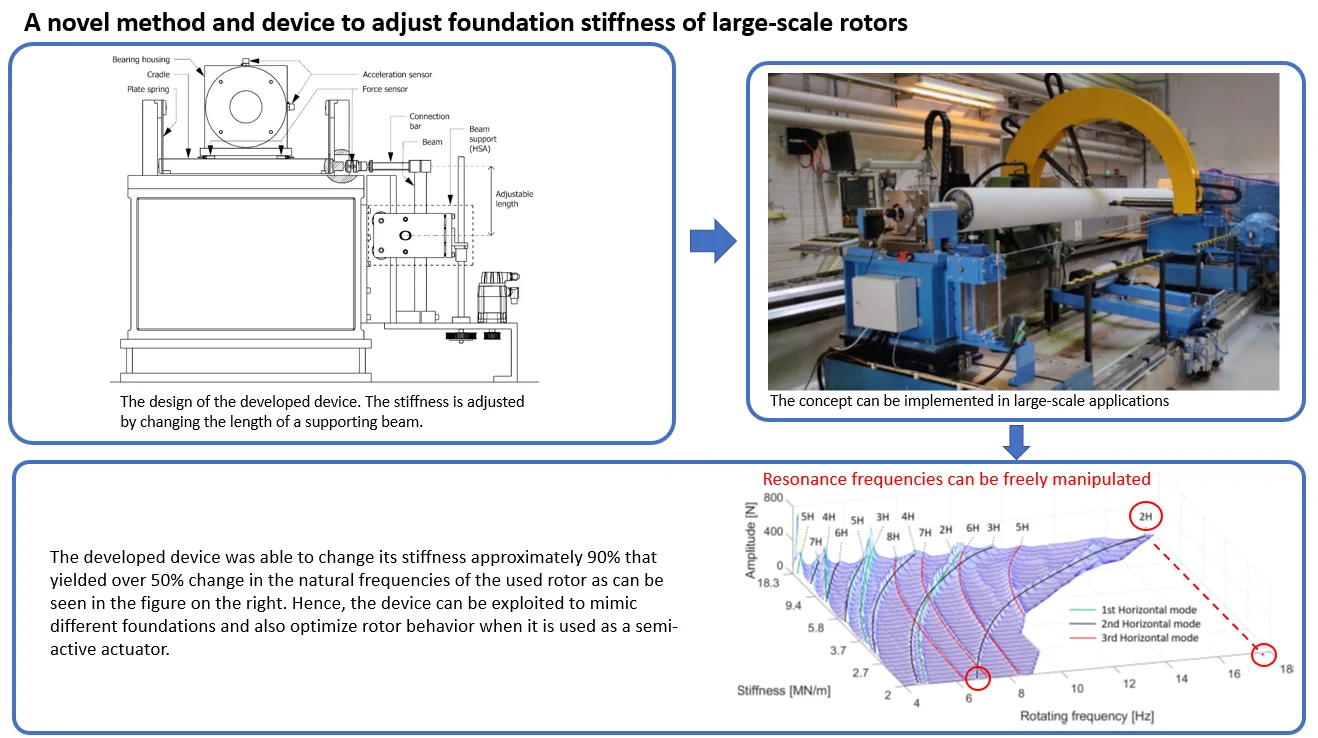
Abstract
Vibration problems have been observed after the installation of large rotating machines, such as electric machines and generators and paper machine rolls. One possible cause can be differences between the foundation stiffness of the installation location and the testing platform where the machine is balanced and optimized. Foundation stiffness exerts a significant effect on the behavior of a rotating system, and the above-mentioned differences can cause major unexpected changes at natural frequencies, and thus resonance. The problem is typical for large machines due to their large mass, which leads to low natural frequencies. This induces situations where these natural frequencies coincide with rotor excitations and cause excessive vibration. This study presents a novel method and a device for adjusting the foundation stiffness of a large rotor system, consequently enabling the investigation of the effect of foundation stiffness on rotor behavior. However, this investigation is restricted to the horizontal axis. The characteristics of the device were analyzed together with a rotor behavior measurement that consisted of versatile measurements of acceleration, force and displacement in different locations inside the rotating system. The device in the presented form is best applied in R&D laboratories and factory acceptance test cells, in which it can be used to predict the behavior of various rotors on different foundations. With the dynamic rotor behavior measurement performed with the device, the natural frequencies and their harmonic components can be presented as a function of foundation stiffness. This information can be used both to optimize rotor behavior in an installation location and also to improve the rotor system behavior in the design phase. The method and device presented in this study can be considered effective and successful, since the natural frequencies of the first two rotor modes could be manipulated freely at a range of 50-100 % by changing the stiffness.
Highlights
- A novel method and device to adjust foundation stiffness of large-scale rotors are presented.
- The behavior of a flexible industrial rotor is investigated with different foundation stiffnesses.
- Proposed concept can be applied the best in R&D laboratories, acceptance test cells and as a semi-active actuator to optimize rotor behavior at installation location.
1. Introduction
The designing of any rotating system is complicated if foundation stiffness is unknown. Frequently, rotating machines or rotors are delivered without an accompanying installation service, with the responsibility for a proper foundation resting with the customer. Sometimes this causes problems after the installation of a rotor when the foundation differs from that expected by the manufacturer. In particular, foundation stiffness has a significant effect on the dynamic behavior of a rotor. An unexpected difference between estimated and actual foundation stiffness can shift the natural frequency of the rotating system and cause major vibration problems at operating speed. The problem is difficult to solve because it appears only after the first run on the final machine bed. Such problems are more common when operating with large machines: natural frequencies are lower due to larger masses, and thus the gap between the operating speed and natural frequency of the system is smaller. Typically, vibration problems appear also below the natural frequency at subcritical resonance frequencies. These problems occur at fractions, such as 1/2 and 1/3 times, of a natural frequency. The most common excitation sources for subcritical resonances are bending stiffness variation and various bearing excitations, such as errors in inner ring roundness. The present study focuses especially on subcritical vibrations.
In general, the vibration behavior of rotating systems can be solved analytically and with the finite element method (FEM). Kang et al. [1] simulated the effects of foundation parameters on rotor vibration, and their analysis found strong correlations between the parameters and natural frequencies. However, a simulation model cannot provide sufficiently accurate results for vibration analysis if the foundation parameters are unknown and only estimated. Particularly in precision applications, where displacements are measured in micrometers, even a minor difference between the rotating system and the model can cause a significant error. Therefore, machine testing, verification and performance measurements are still everyday chores in industry, especially in the case of large rotor systems that are not mass-produced.
Vibration problems caused by uncertainty over the foundation parameters were investigated in the present study by integrating an adjustable stiffness into the test bed. The foundations of rotating machines are usually modeled as objects that have mass, stiffness and damping [2]. Ultimately, the ideal test bed should adjust these parameters across wide ranges in six axes to simulate the large variety of machine beds. This kind of test bed would enable the investigation of the vibration behavior of different rotating machines on a single bed located in the test laboratory.
In the present study, the first steps towards this ideal test bed were taken, and the most effective feature, stiffness, was implemented on the horizontal axis of the test bed with adjustability. Stiffness has a significant impact on the natural frequencies of rotor systems. The adjustability of mass and damping were beyond the scope of the present study. Stiffness adjustment was achieved by changing the length of a cantilever steel beam that was directly attached to the foundation of the rotor below the bearing housing. This principle is simple, and its adjustability is based on classical beam theory. In addition to its contribution towards an ideal test bed, the novelty of the designed bed can be exploited in the elimination of vibration, since harmful natural frequencies can be avoided by varying the foundation stiffness.
Other solutions are available, using various methods, for changing stiffness [3-16]. These methods implemented using springs, memory alloy metals, magnets, mechanical solutions, piezoelectric and magnetorheological materials, have also been used in rotor vibration elimination. Winthrop et al. [17] compared these different methods and organized them by their effectiveness for stiffness variation, and thus also their ability to change the behavior of rotors. However, the new principle developed for the present study was chosen because of its simplicity and feasibility. The method is able to change stiffness in wide range without significantly affecting other foundation parameters, such as damping. In addition, this design allowed the results of a previous study to be exploited [18].
This study investigates the effects of varying stiffness on dynamic rotor behavior using the developed device. The effects on dynamic response are measured by the displacement of the rotor middle cross-section, the acceleration of the bearing housings and radial bearing forces. The results demonstrate that the method and device had a considerable impact on the behavior of the rotor and its natural frequencies. The stiffness range of the device was approximately 2-18 MN/m, which was sufficient to freely manipulate the natural frequencies of the first two modes at a range of 50-100 %.
Thus, as the results indicate, this method for the stiffness adjustment of large rotor foundations seems promising. In particular, R&D laboratories and factory acceptance test cells can exploit the method to optimize rotors for certain foundation stiffnesses. Because foundation stiffness can be actively controlled with a servo drive, it is applicable also in semi-active vibration control, enabling the user or automatic control system to adjust the system stiffness characteristics to avoid resonance vibration.
2. Materials and methods
2.1. Device for adjustable foundation stiffness
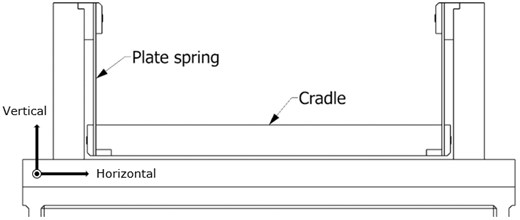
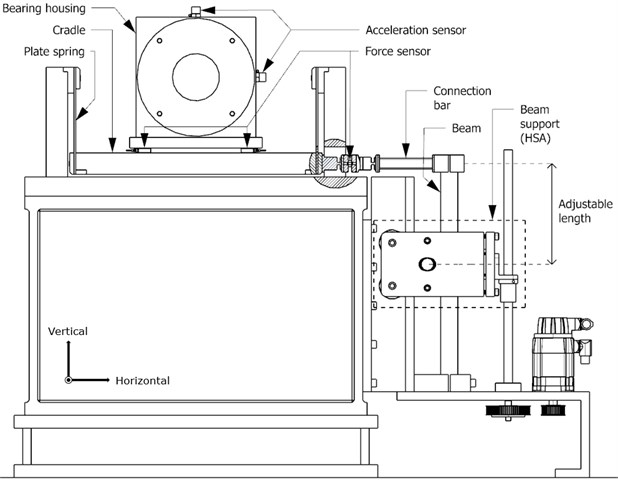
In this design, the rotor was mounted on a horizontally free and vertically and axially rigid bed, illustrated in Fig. 1. This was achieved by supporting the rotor bed cradle with plate springs mounted to the rest of the body from the other end. Thus, the cradle was suspended, and buckling could be prevented. The plate springs enabled almost free horizontal movement while holding the rotor rigidly in respect to the axial and vertical directions. However, as the horizontal movement of the cradle increases, gravity exerts a larger effect. Nevertheless, the movement of the cradle was small, and thus the effect of gravity could be considered negligible.
Fig. 1Horizontally, the rotor bed is supported in a very flexible manner. The cradle hangs on thin plates, which provide support mainly in the vertical and axial directions
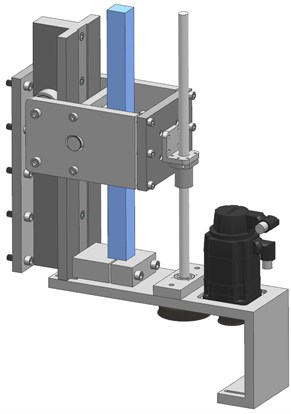
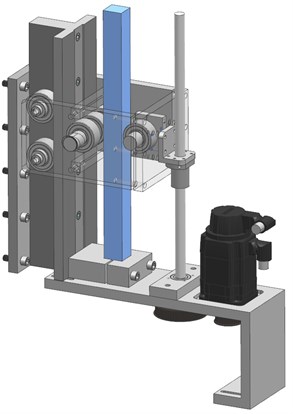
The horizontally free rotor bed could be converted to offer adjustable stiffness by attaching an external device to control the horizontal stiffness of the cradle (rotor bed). This external device is presented in Fig. 2. The principle of the device is simple: the position of the beam support (horizontal stiffness adjuster, HSA) can be varied, thus changing the stiffness of the beam end.
Fig. 2Adjustable stiffness device: a) the appearance of the device and b) the supporting structure inside the device. The beam, which determines the horizontal stiffness of the cradle, is colored blue
a)
b)
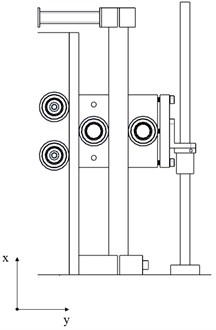
To enable continuous, in-process stiffness adjustment, the HSA position was controlled with a ball screw and a servo motor. The HSA included several different parts, including the frame, bearings, axles and supports. It was tightened into one stiff structure with screws, which eliminated clearances from the system. Finally, the external device was added to the horizontally free rotor bed. The cradle was directly mounted to the end of the beam with a connection bar, and thus the stiffness of the system was determined by the external device. The complete device with sensors is presented in Fig. 3.
Fig. 3The rotor bed with horizontally adjustable stiffness. The length of the beam can be changed by moving the HSA device along the beam. In addition, the positions of the force and acceleration sensors can be seen
2.2. Stiffness characterization of the system
2.2.1. Analytical stiffness characterization
The stiffness of the device in a horizontal direction can be determined with an analytical solution. Bedford and Liechti [19] have extensively presented the effects of loads on beam deflection and have demonstrated different strategies for solving various beam configurations. Their calculations are based on Euler-Bernoulli beam theory, which assumes beam deflections to be small. The theory is a simplification of the linear theory of elasticity, which has been widely used in the field of engineering. The theory derives a static relationship between the distributed load and the deflection , which can be now exploited to solve the stiffness of the device:
where is the elastic modulus and is the second moment of area. Both variables are in this case constant. Because in the equation the deflection is in the form of the fourth derivative, the final deflection of the beam can be solved by integrals:
where is shear force, is moment, is the slope of a beam and is the deflection of a beam.
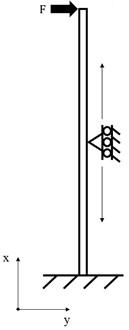
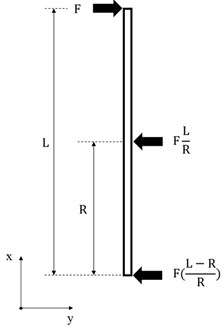
Frequently, a tabulated expression is available for the required beam configuration. However, in this case, the beam deflection and stiffness must be derived using the Euler-Bernoulli equations presented above. Before the equations can be applied, the configuration of the beam must be determined. The free body diagram in Fig. 4 illustrates the forces, their relations and distances in a device where the beam is supported rigidly from its lower end, the movement in direction is supported by intermediate beam support (HSA) and the other end is connected to the rotor foundation. The connection to the rotor foundation can be now modeled with force .
Fig. 4The structure of the device converted into a free body diagram: a) original beam and its support, b) free body diagram, c) free body diagram with point loads in relation to force F
a)
b)
c)
As the free body diagram indicates, only point loads are acting in the system. In this study, the point loads are derived for the shear forces of the beam, and then the shear forces can be directly applied with the Eq. (2). The shear forces form two different sections on the beam; thus, two equations must be created according to these sections:
The final equation for the deflection can now be solved by integrating these equations three times:
The integration constants can be solved using boundary conditions:
Finally, the stiffness of the beam can be solved when the applied force and the deflection of the beam end is known:
By substituting the structure and material parameters from the actual device with Eq. (11), the deflection of the beam end can be calculated as a function of the intermediate support position (). This value can be divided by the applied force as in Eq. (12), which leads to the developed stiffness of the beam [N/m]. The parameters used in the calculations are presented in Table 1. The force used can be arbitrarily decided when solving the stiffness. The other parameters are determined by the structure and materials of the device.
Table 1Structure and material parameters used in the calculations
Parameter | Deflection position [mm] | Force [N] | Elastic modulus [GPa] | Second moment of area [mm4] | Length of the beam [mm] |
Value | 491.75 (=) | 2000 | 210 | 202667 | 491.75 |
2.2.2. Simulated stiffness characterization
The stiffness of the device can also be determined with a simulation utilizing the Finite Element Method (FEM). This is achieved by loading the beam as in the analytical solution and then observing the beam end movement in relation to the force used. Only the essential parts of the structure were left for static FEM analysis that virtually meant the analysis of the beam. Siemens NX was used for the modelling and analysis.
Fig. 5Simulation process. On the left-hand side there is meshed beam with constraints and force. The beam end has all 6 DoF (Degrees of Freedom) constrained and different HSA positions have only the horizontal one. On the right-hand side there is a result of the first loading case in which the force F was applied, and HSA was in position 0 mm. The result describes the absolute displacement of the beam end in mm. h= 85 mm and H= 385 mm
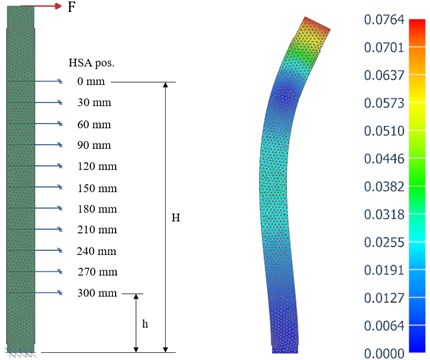
The beam was first divided into suitable sections to enable correct positioning of the intermediate support and hence also analysis of the corresponding stiffness range. Then a 3D element meshes with a maximum element size of 5 mm was created according to the actual beam. The static FEM analysis also demanded the determination of the forces and constraints of the model. The beam was constrained rigidly from the lower end and laterally from the HSA positions. The movement of the HSA in the simulation corresponded the HSA movement in the actual device. The Fig. 5 illustrates the simulation process and the used HSA positions. The beam was loaded from the free end with a force of 2000 N. The parameters used in the simulation are presented in Table 2.
Table 2Structure and material parameters used in the simulation
Parameter | Element size [mm] | Deflection position [mm] | Force [N] | Elastic modulus [GPa] | Second moment of area [mm4] | Length of the beam [mm] |
Value | 5 | 491.75 () | 2000 | 206.94 | Not a constant | 491.75 |
2.2.3. Experimentally measured stiffness characterization
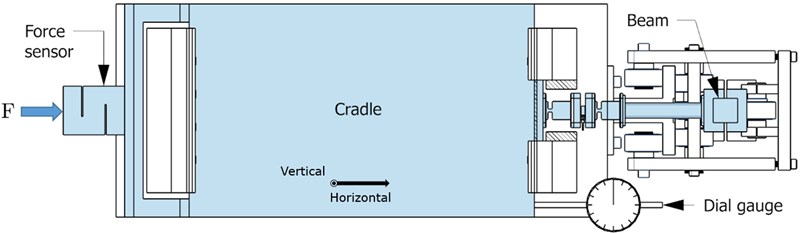
The stiffness of the rotor-mounting cradle in a horizontal direction could be determined by measuring the displacement of the cradle under a known force. Because the stiffness of the complete system must be known, the measurement setup was arranged in the following way. The cradle was connected to the stiffness-adjusting beam, which was displaced with a screw through a force sensor. The displacement of the cradle and the force that developed the displacement were measured. The measurement setup is presented in Fig. 6. A non-linear change in stiffness was expected during the movement of the HSA; thus, it was necessary to repeat the measurement several times at different points so that the full stiffness range could be properly determined. The utilized sensors and their specifications are introduced in Table 3.
Table 3Specifications of sensors
Measured unit | Sensor | Resolution | Repeatability |
Force | HBM S9M | 1 N (accuracy class 0.02) | 1 N (accuracy class 0.02) |
Displacement | Sylvac S229 | 1 μm | 2 μm |
Fig. 6Measurement setup for the stiffness characterization. The displacement (force) on the beam was produced with a screw through the force sensor and cradle. The displacement of the cradle was measured with the dial gauge. The blue color indicates the parts that acted with the force between the sensor and the beam
The experimental measurement was conducted as follows:
1) The horizontal stiffness adjuster (HSA) was set its highest position.
2) A force of 250 N was applied to the system.
3) 100 corresponding displacement and force samples were taken.
4) The force was increased by increments of 250 N.
5) Steps 3 and 4 were repeated until the force was 2500 N.
6) The HSA was moved downwards in increments of 30 mm.
7) Steps 2 to 6 were repeated until the full movement (300 mm) was reached and measured.
Thus, the stiffness of the system was measured in 11 different HSA locations. The measurement described above was performed for both devices at both ends of the rotor. The averaged results of the measurement points were employed to solve the stiffness of the devices.
2.3. Subcritical rotor behavior measurement
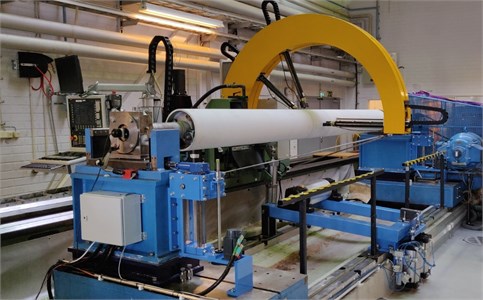
The device presented in the previous sections was mounted at the both ends of the test rotor. Changes in subcritical vibration behavior were monitored when the horizontal stiffness of the foundation was decreased. Monitoring was conducted by measuring the response (center point movement) at the middle cross-section of the rotor, acceleration in the bearing housings, and radial bearing forces. The complete test setup is presented in Fig. 7.
Fig. 7Complete test setup. The accelerometers and force sensors were placed at the rotor ends, and displacement measurement was performed with laser sensors attached to the yellow arc
2.3.1. Test setup
The test setup was constructed on a rigid grinding machine bed, with the test rotor fixed to the device. The test rotor was a 735 kg paper machine roll, and its main dimensions are presented in Fig. 8. The rotor speed and position of the HSA were controlled with a CNC. The test rotor was connected to the motor drive through a gearbox with a universal joint.
Fig. 8Main dimensions of the test rotor. All dimensions are in mm
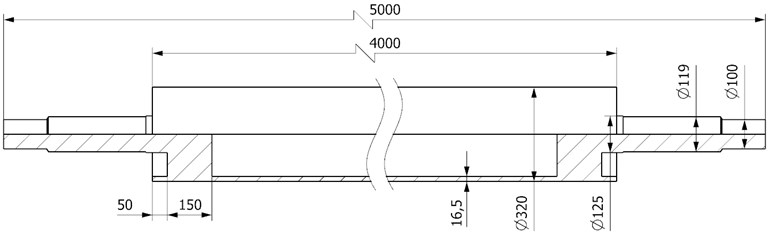
Fig. 3 shows the measurement points of the acceleration and force sensors and Fig. 7 the displacement measurement. The specifications of the sensors are presented in Table 4. The accelerometers were attached to the bearing housings, and only the vertical and horizontal directions were measured. Measurement of the radial bearing forces was performed by integrating the force sensors into the device. The principle of radial bearing force measurement is straightforward and has been presented in a previous study [18]. In the present study, the center point movement was measured by exploiting the four-point method developed by Kuosmanen and Väänänen [20] and further investigated by Viitala et al. [21]. The method is a combination of two different methods: the Ozono three-point method [22], developed for roundness measurements, and the two-point method, which is a straightforward method to measure the diameter variation of the rotor. The method was applied with four reflective laser sensors that were arranged around the rotor at certain angles. The four-point method enabled the separation of the center point movement and the roundness of the rotor in the dynamic measurement.
Table 4Sensors used in rotor behavior measurement
Measured unit | Sensor | Sensitivity | Range |
Acceleration | Brüel & Kjær type 4381 | 10.0 pC/ms-2 | 0.1 to 4800 Hz |
Force (horizontal) | Kistler 901A | –4.3 pC/N | 0 to 7.5 kN |
Force (vertical) | HBM PaceLine CFW | –4.3 pC/N | 0 to 100 kN |
Displacement | Matsusita NAIS LM 300 | 1 V/mm | 27 to 33 mm |
2.3.2. Data acquisition
To ensure as simultaneous sampling as possible, all the measurement signals were obtained with a single National Instruments PCI-6259 data acquisition card (DAQ) using an external trigger. The card applied multiplexing during the measurement, and thus the samples could not be acquired at exactly the same time. However, since the card had a sampling frequency of 1 MS/s in multichannel mode, the problem was considered negligible.
A rotary encoder connected directly to the rotor shaft triggered the measurement and operated as an external sample clock. Thus, the sampling frequency changed as a function of rotor speed. The encoder had 1024 pulses/rev, which consequently led to 1024 measurement samples per rotor revolution. The external phase-locked sample clock enabled a time synchronous averaging (TSA) method, which is presented in Section 2.3.4. The method facilitates the identification of harmonic frequencies from the signal and reduces noise and other non-periodic signals.
2.3.3. Measurement procedure
The measurement was conducted simultaneously with all sensors, thus ensuring comparability between the results. The measurements were performed at a constant speed to enable averaging and FFT analysis, which is presented in the next section. The measurement procedure was completed as follows:
1) The support of the beam was set at its stiffest point.
2) The rotor was accelerated to its starting frequency, 4 Hz.
3) 100 revolutions were measured.
4) The rotating frequency was increased by increments of 0.05 Hz.
5) 100 revolutions were measured.
6) Steps 4 and 5 were repeated until the rotating frequency was at its final value, limited by the safety margin (no crossing of the first mode natural frequency).
7) The rotating frequency was decreased to its starting frequency of 4 Hz.
8) The support of the beam was moved 10 mm downwards to decrease the horizontal stiffness.
9) Steps 3-8 were repeated until the HSA was at its lowest point.
This measurement procedure produced data measured at 31 stiffness points.
2.3.4. Signal analysis
In the present study, the signals were investigated using the time synchronous averaging (TSA) method and Fast Fourier Transform (FFT) algorithm. They both offer advantages when studying periodic signals from vibration and are therefore widely utilized in vibration analysis.
Time synchronous averaging [23, 24] is a signal processing technique that can be considered a filtering process for periodic signals, which are extracted from non-periodic signals. Therefore, significant information can be also lost if the focus is not exclusively periodic (harmonic) signals. The method is based on a clock signal that is phase locked with the angular position of a rotating object. Originally, McFadden and Toozhy [23] applied the method to the investigation of bearing damage, but it is also utilized in the vibration measurement of rotors, as Widmaier [25] and Viitala [26] have shown.
FFT was originally developed in 1964 by Cooley and Tukey [27]. It is based on the assumption that every periodic signal can be represented by combining an infinite series of trigonometric functions. The algorithm can be applied to discrete signals, such as measurement data, and it can then present the signal in the frequency domain. In the frequency domain, the signal takes the form of complex numbers that contain information about the absolute amplitude and phase of a signal.
3. Results and discussion
3.1. Beam stiffness characterization
Beam stiffness was determined with analytical, simulation and experimental methods. The analytically determined deflection and stiffness of the beam end can be seen below in Fig. 9 as a function of the HSA position. In the calculations, a force of 2000 N was used, which is the same force as in the measurements. The results were obtained from the range of 0-491.75 mm, which corresponds to the total length of the beam. The HSA can move in a range of 106.75-406.75 mm.
Fig. 9Analytic results for the deflection and stiffness of the beam. 0 mm corresponds to the upper end of the beam
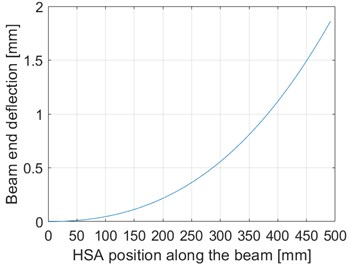
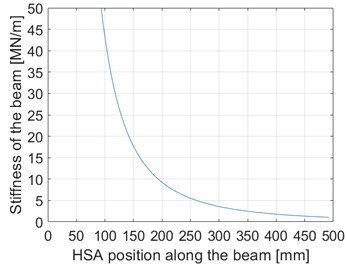
As can be observed from the stiffness diagram, theoretically stiffness increases towards infinity when the rigid beam support approaches the beam upper end (position 0 mm). However, in reality, the rigid support at the beam end and HSA (Fig. 4) are not completely rigid, which limits the stiffness.
The beam end deflection and stiffness derived by the simulation are presented below in Fig. 10. The results were obtained from 11 different positions from a range of 106.75-406.75 mm measured from the beam upper end in which the HSA was able to move.
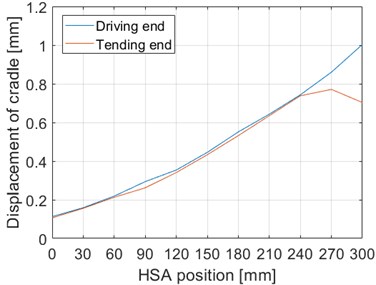
The results of the experimental measurement are presented in Fig. 11. The stiffness was measured with the complete assembly, in which the force was conducted through the cradle, instead of measuring only the stiffness of the beam. This is likely to be a more accurate method for describing the real stiffness of the existing system. The interpretation of the results is straightforward except for the slope that can be seen in the tending-end results. The slope is a result of the small clearance between the frame and the cradle; the cradle collided with its frame when using high loads. However, this was not a problem when the device was used in rotor measurements, since excessive forces were not produced. Moreover, the problem could be eliminated by increasing the clearance between the frame and the cradle. The results indicate that the clearance between the cradle and the frame was approximately 0.8 mm at the tending end when the collision occurred. At the driving end, the maximal movement of the cradle was approximately 1 mm when a 2000 N force was applied.
Fig. 10Simulated results for the deflection and stiffness of the beam. HSA position 0 mm corresponds to the upper position of the HSA and 300 mm to the lower position of the HSA
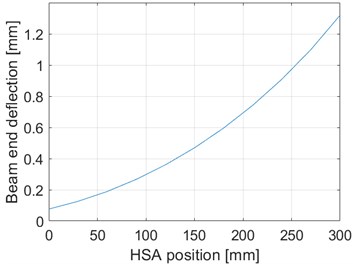
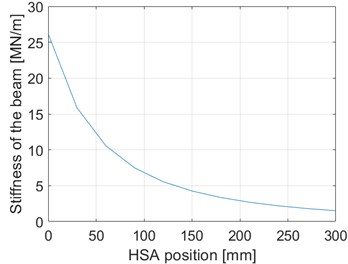
Fig. 11The horizontal displacement of the cradle at a constant 2000 N force in different HSA positions. HSA position 0 mm corresponds to the upper position of the HSA and 300 mm to the lower position of the HAS
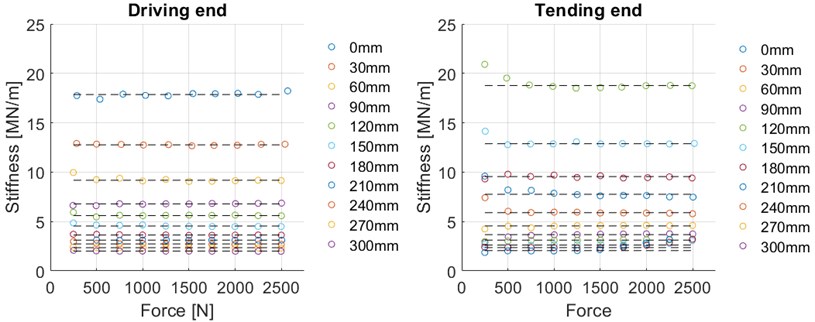
The final stiffnesses of the devices were averages calculated from the 10 measuring points shown in Fig. 12. At each point, the measured force is divided by the corresponding displacement, which provides the stiffness at that point. This procedure was repeated for 11 different HSA positions. However, it was necessary to eliminate some points from the averaging process due to collision and to non-linearity when using low forces. After these issues were controlled for, the stiffnesses were linear in the force range used for each HSA position. The averaged stiffnesses of both HSA devices and their combined average are presented in Table 5. The stiffness average of both HSA devices was used as the horizontal stiffness of the complete system.
Table 5Averaged stiffnesses in different HSA positions
Position of HSA [mm] | Averaged stiffness in the driving end device [MN/m] | Averaged stiffness in the tending end device [MN/m] | Averaged stiffness of the system [MN/m] |
0 | 17.86 | 18.77 | 18.32 |
30 | 12.77 | 12.88 | 12.83 |
60 | 9.18 | 9.55 | 9.37 |
90 | 6.79 | 7.76 | 7.28 |
120 | 5.60 | 5.90 | 5.75 |
150 | 4.55 | 4.56 | 4.56 |
180 | 3.64 | 3.68 | 3.67 |
210 | 3.11 | 3.12 | 3.12 |
240 | 2.74 | 2.61 | 2.68 |
270 | 2.35 | 2.36 | 2.36 |
300 | 2.01 | 2.06 | 2.04 |
Fig. 12Stiffness measurements under different loads in 11 different HSA positions
A regression curve was fitted to the averaged stiffness points to achieve a continuous stiffness curve that acts as a function of the HSA position. This enables accurate control of the horizontal stiffness between the minimum and the maximum. The derived regression curve is presented together with the analytical and simulation stiffness curves in Fig. 13.
Fig. 13Measured, analytical and simulated stiffness curves as a function of HSA position. HSA position 0 mm corresponds to the upper position of the HSA and 300 mm to the lower position of the HSA
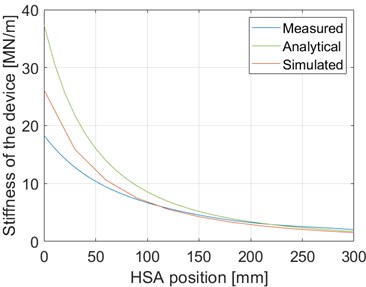
As can be observed from the Fig. 13, the measured results differ from the other results, particularly at the stiff end. According to the analytical results, the stiffness of the device varies between 1.72 and 37.44 MN/m, depending on the HSA position, whereas the simulated stiffness varies between 1.52 and 26.18 MN/m and the measured stiffness between 2.04 and 18.32 MN/m. The difference is mainly due to errors in the analytical and simulation models. The models assume that the beam supports are completely rigid. Therefore, the stiffness curve increases exponentially when the beam support approaches the beam end. These models could be further developed by replacing the rigid supports with spring supports.
The analytical and simulated solutions developed for this study are applicable for the dimensioning of the beam to achieve a certain stiffness range and thus also desired foundation stiffness in the horizontal direction. This can be achieved by changing the beam material (), length () or beam profile ().
3.2. Rotor behavior measurement
The results were obtained by measuring the acceleration of the bearing housings, the radial bearing forces and the displacement of the rotor in the middle cross-section. The horizontal results form the main part of the study, since the effects of varied stiffness were expected only on that axis. The effect of unbalance and eccentricity (the first harmonic component) was excluded from the results.
The behavior of the rotor was analyzed in two different ways utilizing the data gathered. The first approach presents the peak values of the amplitudes at a certain stiffness and rotor rotation frequency. These results are separated into horizontal and vertical components, since different natural frequencies in these directions were expected. Figs. 14-16 illustrate the horizontal results and Fig. 17 presents the vertical results.
The second approach presents the subcritical harmonic components of the vibration at a certain stiffness and rotating frequency after the FFT analysis. Only the horizontal results are presented in Fig. 18, since the vibration behavior of the rotor in the vertical direction did not change according to the results presented in Fig. 17.
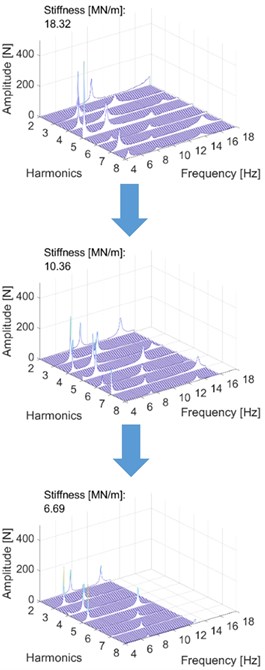
Fig. 14Peak values of the displacement measurement (center point movement) at a certain rotating frequency and stiffness. Different modes are color-coded, and each ridge denotes a harmonic component
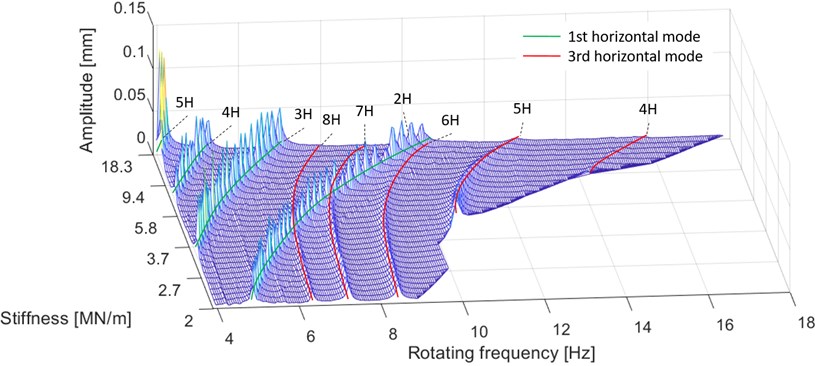
Fig. 15Peak values of the radial bearing force measurement at a certain rotating frequency and stiffness. Different modes are color-coded, and each ridge denotes a harmonic component
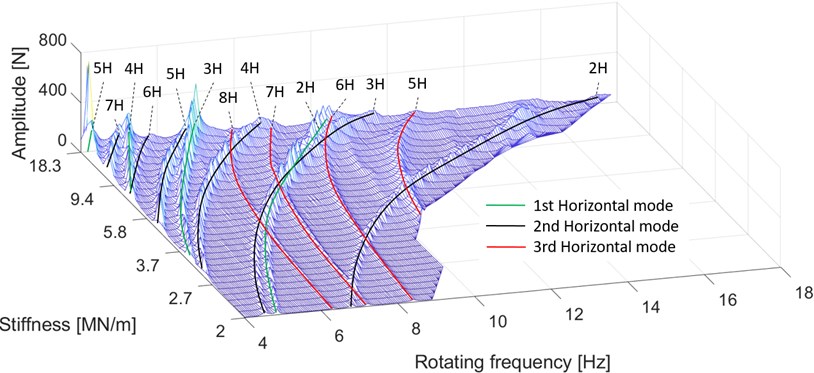
The results presented in Figs. 14-16 reveal large changes in the horizontal natural frequencies of the rotor system at different stiffnesses. No natural frequencies were crossed, since the study focused on subcritical vibrations.
The radial bearing force measurement in Fig. 15 allows the first three horizontal modes of the rotor to be distinguished from the vibration. The identification of the subcritical resonance curves was straightforward, since they appear at fractions of their natural frequency, such as 1/2 times the natural frequency (2) and 1/3 times the natural frequency (3). This is related to harmonic excitations that can occur multiple times per revolution, and therefore coincidence between the excitation frequency and the natural frequency is possible below the critical speed. In the results, the harmonic frequencies were given as a function of the rotating frequency, and thus 2 subcritical resonance was visible when the rotating speed was half of the corresponding critical speed.
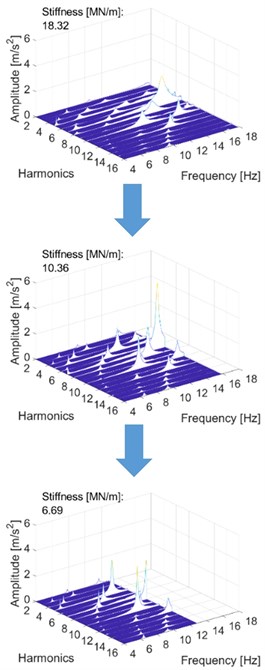
Fig. 16Peak values of the acceleration measurement at a certain rotating frequency and stiffness. Different modes are color-coded, and each ridge denotes a harmonic component
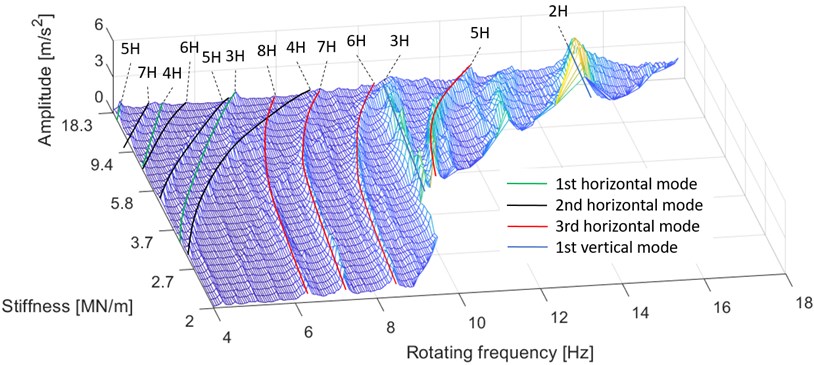
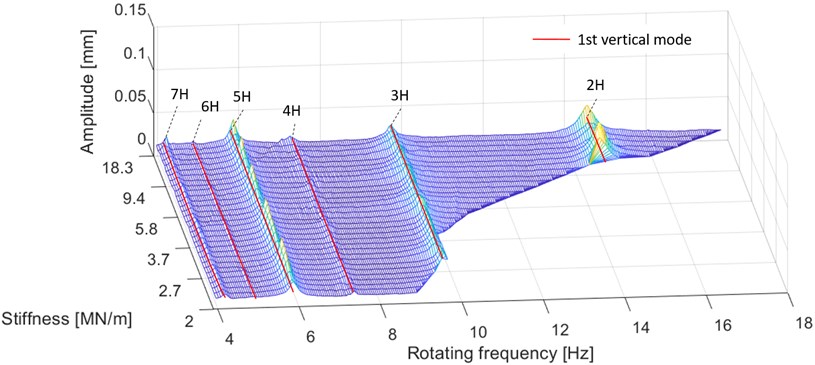
Fig. 17Demonstration of the effect of varied stiffness on the vertical natural frequencies. The vertical harmonic components of the displacement measurement are presented. The vertical mode is illustrated as red lines and each ridge denotes a harmonic component
However, as the results show, the measurements contain major differences in their ability to distinguish different modes. For instance, in the displacement measurement displayed in Fig. 14, the second mode cannot be seen at all. This is a result of the test setup, as the displacement measurement was performed at the middle cross-section of the rotor. As already shown, the node of the second mode is in the middle of the rotor, which makes detection of the second mode impossible. However, this could be avoided by selecting another measurement point along the rotor. By contrast, the acceleration measurement presented in Fig. 16 detects all the horizontal modes, but it is also mixed with vertical modes: the first and second harmonic components can be clearly seen in the results. Furthermore, its ability to separate the horizontal harmonic components was low compared to the other measurements.
The results indicate the significance of low harmonic components. For example, the fifth harmonic component of the first mode produces high amplitudes at low frequencies in the displacement and force diagrams, Fig. 14 and Fig. 15 respectively. Furthermore, very low harmonic frequencies still exert a significant effect on the behavior of the rotor, as demonstrated by the eighth harmonic component of the third mode in Fig. 14 and Fig. 16. In turn, Fig. 17 shows that the stiffness variation in the horizontal direction did not affect the vertical natural frequency as expected.
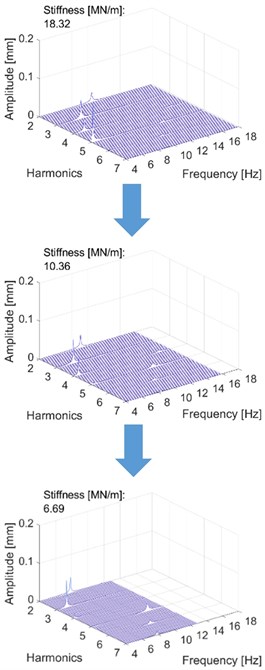
Fig. 18The effect of stiffness variation on the harmonic components. Stiffness decreases when moving downwards. In each measurement, the last presented harmonic component is the last significant one
a) Center point movement (Middle cross-section of rotor)
b) Radial bearing force (Bearing housing, tending end)
c) Acceleration (Bearing housing, tending end)
The second analysis was performed by applying the FFT algorithm to the measured data. This method allowed the harmonic components to be investigated more effectively. Fig. 18 presents the results in the frequency domain, where each harmonic component can be separately observed. Only three different stiffness points are shown; the remainder are compressed and are available in gifs (appendix in the electronic form of this article). The diagrams display the same natural frequencies and their decrease as in the previous representation. Utilizing this method, the higher harmonic components could be distinguished. In the diagrams below, the first harmonic component is removed, and the highest presented harmonic component is the last that has significant amplitude.
As the measurement results show, the natural frequencies of the modes responded differently to varying levels of stiffness. Here, the frequencies of the harmonic components changed in an identical manner, as they are fractions of the natural frequency. Thus, the natural frequencies could be determined and calculated by multiplying the frequencies of the harmonic components presented in the results. Fig. 19 demonstrates the effect of varying stiffness on the natural frequencies and their harmonic components.
Fig. 19The effect of stiffness on natural frequencies
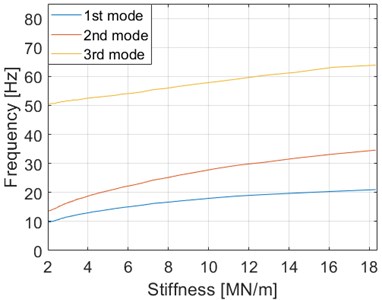
As the diagram indicates, the largest change was to the natural frequency of the second mode, where the natural frequency decreased by 60.7 % from 34.59 Hz to 13.61 Hz when the stiffness was decreased 88.9 % from 18.32 MN/m to 2.04 MN/m. The natural frequencies of the first and third modes decreased 53.6 % and 21.1 % respectively. The effects of varying stiffness on the natural frequencies can be seen in Table 6.
Table 6The effects of varying stiffness on natural frequencies.
Stiffness [MN/m] | Change [%] | 1st mode [Hz] | Change [%] | 2nd mode [Hz] | Change [%] | 3rd mode [Hz] | Change [%] |
18.32 | 0 | 20.98 | 0 | 34.59 | 0 | 63.87 | 0 |
14.31 | –21.9 | 19.77 | –5.8 | 31.79 | –8.1 | 61.37 | –3.9 |
10.36 | –43.4 | 18.19 | –13.3 | 28.22 | –18.4 | 58.14 | –9.0 |
6.18 | –66.3 | 15.20 | –27.6 | 22.45 | –35.1 | 54.17 | –15.2 |
2.04 | –88.9 | 9.73 | –53.6 | 13.61 | –60.7 | 50.38 | –21.1 |
4. Conclusions
In this study, a novel method and device for adjustable stiffness was developed and applied to the investigation of rotor behavior. The results suggest that the method and device for evaluating the foundation stiffness effect was successful. The range of possible stiffnesses was wide, and varying the stiffness produced large changes in the natural frequencies of the rotor system. For example, the device enabled the natural frequencies of the first two modes of the rotor to be halved. A test bed that can simulate and mimic other machine beds by adjusting its stiffness can be considered a universal test bed. Since this study offered a successful proof-of-concept for one axis, a similar two-axis concept, which would also include the vertical axis, can be considered a promising novel method and tool for final machine testing and balancing. It would significantly increase the reliability of the delivery of large machines where problems arise from differences between the foundations of a test bed and an installation location. Moreover, there are surely other applications for this adjustable stiffness method than minimizing the vibration of a rotating system by identifying the ideal level of stiffness.
In industry, major vibration problems typically originate from the first two harmonic components, and thus higher harmonic components (>2) are ignored or, in the worst case, completely filtered out. However, this approach does not always produce the desired stable outcome. As can also be seen from our results, higher harmonic components exert a significant effect on the behavior of the rotor, and they should be taken into consideration both in vibration elimination as well as in solving problematic situations and achieving improved vibration levels.
Further research will focus on the development of the vertical axis. This second, vertical, axis would complete the device and allow its application in the optimization of large machines. Thus, its real effectiveness in investigating large rotating machines could be evaluated and its suitability for use in industry tested.
References
-
Kang Y., Chang Y.-P., Tsai J.-W., Mu L.-H., Chang Y.-F. An investigation in stiffness effects on dynamics of rotor-bearing-foundation systems. Journal of Sound and Vibration, Vol. 231, 2000, p. 343-374.
-
Krämer E. Dynamics of Rotors and Foundations. 1st ed., Springer Berlin Heidelberg, 2013.
-
Sun C., Nagarajaiah S. Study of a novel adaptive passive stiffness device and its application for seismic protection. Journal of Sound and Vibration, Vol. 443, 2019, p. 559-575.
-
Nagarajaiah S., Sahasrabudhe S. Seismic response control of smart sliding isolated buildings using variable stiffness systems: an experimental and numerical study. Earthquake Engineering and Structural Dynamics, Vol. 35, 2006, p. 177-197.
-
Lyan Ywan L., Tzu Kang L., Shih Wei Y. Experiment and analysis of a leverage-type stiffness-controllable isolation system for seismic engineering. Earthquake Engineering and Structural Dynamics, Vol. 39, 2010, p. 1711-1736.
-
Azadi M., Behzadipour S., Faulkner G. Performance analysis of a semi-active mount made by a new variable stiffness spring. Journal of Sound and Vibration, Vol. 330, 2011, p. 2733-2746.
-
Clark W. W. Vibration control with state-switched piezoelectric materials. Journal of Intelligent Material Systems and Structures, Vol. 11, 2000, p. 263-271.
-
Davis C. L., Lesieutre G. A. Actively tuned solid-state vibration absorber using capacitive shunting of piezoelectric stiffness. Journal of Sound and Vibration, Vol. 232, 2000, p. 601-617.
-
Liu Y., Matsuhisa H., Utsuno H. Semi-active vibration isolation system with variable stiffness and damping control. Journal of Sound and Vibration, Vol. 313, 2008, p. 16-28.
-
Bazinenkov A. M., Mikhailov V. P. Active and semi active vibration isolation systems based on magnetorheological materials. Procedia Engineering, Vol. 106, 2015, p. 170-174.
-
Zhou N., Liu K. A tunable high-static-low-dynamic stiffness vibration isolator. Journal of Sound and Vibration, Vol. 329, 2010, p. 1254-1273.
-
Williams K., Chiu G., Bernhard R. Adaptive-passive absorbers using shape-memory alloys. Journal of Sound and Vibration, Vol. 249, 2003, p. 835-848.
-
Walsh P., Lamancusa J. A variable stiffness vibration absorber for minimization of transient vibrations. Journal of Sound and Vibration, Vol. 158, 1992, p. 195-211.
-
Wu T. H., Lan C. C. A wide-range variable stiffness mechanism for semi-active vibration systems. Journal of Sound and Vibration, Vol. 363, 2016, p. 18-32.
-
Jorkama M., Föhr H., Penttilä K. Support Arrangement of Roll in Fibrous-Web Machine. United States Patent, FI123753B, US8146397B2, 2007.
-
Dutt J. K., Toi T. Rotor vibration reduction with polymeric sectors. Journal of Sound and Vibration, Vol. 262, 2003, p. 769-793.
-
Winthrop M. F., Baker W. P., Cobb R. G. A variable stiffness device selection and design tool for lightly damped structures. Journal of Sound and Vibration, Vol. 287, 2005, p. 667-682.
-
Viitala R. Dynamic Radial Bearing Force Measurement of Flexible Rotor. Master’s thesis, University of Oulu, 2018.
-
Bedford A., Liechti K. M. Deflections of beams. Mechanics of Materials, Cham, 2020, p. 671-728.
-
Kuosmanen P., Väänänen P. New Highly Advanced Roll Measurement Technology. 5th International Conference on New Available Techniques, 1996, p. 1056-1063.
-
Viitala R., Widmaier T., Hemming B., Tammi K., Kuosmanen P. Uncertainty analysis of phase and amplitude of harmonic components of bearing inner ring four-point roundness measurement. Precision Engineering, Vol. 54, 2018, p. 118-130.
-
Aoki Y., Ozono S. On a new method of roundness measurement based on the three-point method. Journal of the Japan Society of Precision Engineering, Vol. 32, 1996, p. 831-836.
-
Mcfadden P. D., Toozhy M. M. Application of sychronous averaging to vibration monitoring of roll element bearings. Mechanical Systems and Signal Processing, Vol. 14, 2000, p. 891-906.
-
Mcfadden P. D. A revised model for the extraction of periodic waveforms by time domain averaging. Mechanical Systems and Signal Processing, Vol. 1, 1987, p. 83-95.
-
Widmaier T. Optimisation of the roll geometry for production conditions. Ph.D. Thesis, Aalto Yliopisto, Espoo, Helsinki, Finland, 2012.
-
Viitala R. Effect of Assembled Bearing Inner Ring Geometry on Subcritical Rotor Vibration. Ph.D. Thesis, Aalto Yliopisto, Espoo, 2018.
-
Cooley J. W., Tukey J. W. An algorithm for the machine calculation of complex Fourier series. Mathematics of Computation, Vol. 19, 1964, p. 297-301.
Cited by
About this article

This work was a part of the Digital Twin of Rotor System project (TwinRotor, Grant Number 313675), which was supported by Academy of Finland.
