Abstract
The aim of this research was to identify the interactions between Earth's local time varying magnetic field and cardiovascular system parameters in women, performing sedentary work, during their workweek. The tasks of research: 1. To examine the relationship between the Earth's local magnetic field and the electrocardiographic parameters of women performing sedentary work, during the workweek. 2. To examine the relationship between the Earth's local magnetic field and arterial blood pressure of women performing sedentary work, during the work week. The methods used: electrocardiographic monitoring and arterial blood pressure measurement. The Earth's magnetic field data was obtained using a magnetometer located in the town of Baisogala. Every female was assessed four times: before and after work on Monday, before and after work on Friday of the same week. Participants of the research: the research group consisted of 21 females who perform sedentary work (average age ± SD – 50.1±9.5 years). Conclusions of the research: 1. The most significant correlations between local GMF and ECG and arterial blood pressure parameters were found with the low frequency field, the most often in SDelta [0-3.5] Hz and STheta [3.5-7] Hz bands. 2. The correlations between ECG parameters (RR, JT and QRS intervals ant ST amplitude) during the workweek changed from negative to positive, which appears to be associated with fatigue influence on person sensitivity to local GMF. 3. Systolic and diastolic arterial blood pressure changed in different ways. The correlations between local GMF and diastolic arterial blood pressure were especially pronounced. 4. All ECG and arterial blood pressure parameters showed great variability in correlation with local GMF. It can be associated with changing human sensitivity to GMF due to increasing fatigue.
1. Introduction
In a modern, constantly evolving world, people spend more and more time sitting down. When working in sitting position, even when seated correctly, the body muscles can shrink due to isometric processes. Blood circulation is disrupted for a long time in the state of isometric contraction, ischemia develops as capillaries are compressed, enough blood is not drawn into the muscles, and oxygen and energy materials do not enter into the muscles [1]. The long sitting position inhibits blood circulation in the legs and pelvis [2]. It has been shown that sitting for more than 10 hours per day compared to sitting less than 5 hours per day also increases the risk of cardiovascular disease (CVD) [3].
Three forms of the load that cause fatigue are distinguished: 1) physical load caused by muscle work; 2) mental load caused by logical thinking, concentration; 3) mental – nervous system load caused by performed work (contact with patients, clients, etc.), environment (noise, bad lighting, etc.) and social conditions (interpersonal relations, etc.) [4].
People who work with computers are more likely to experience mental fatigue. The health effects working at a computer are associated with psychosocial problems [5]. Psychophysiological changes in the long term form permanent pathological changes in cardiovascular and other body systems [6]. Data from psychological and physiological indicators show that working at a computer reduces the agility of high nerve activity between central connections, causing central nervous system fatigue, negatively affecting attention and thinking, as well as pronounced changes in cardiovascular performance [5].
Fatigue manifestations are greatly affected by the environment. The cardiovascular system is most sensitive to any changes in the body and the environment, both positive and negative [7]. One of the most difficult to describe is the link between the magnetic fields of Man and Earth. We know that the electric field of the human heart is about 60 times greater than the electrical activity generated by the brain. This field can be detected at any point of the body surface. The magnetic field of the heart, which is the strongest rhythmic magnetic field created by the human body, not only envelops every cell of the body, it also expands outward in all directions to the surrounding environment (Fig. 1). Sensitive magnetometers measure the magnetic field of the heart up to a meter away from the body [8].
Fig. 1Human heart magnetic field [8]
![Human heart magnetic field [8]](https://static-01.extrica.com/articles/20857/20857-img1.jpg)
McCraty with a team in 2015 (Heart Math Institute) investigated the impact of geomagnetic activity on human health. Their research has shown that there is a direct relationship between the rhythm of the heart and the magnetic field of the Earth. The human cardiovascular system resonates with the Earth's magnetic field in certain frequency ranges [8].
Geomagnetic fluctuations affect most important biological processes such as blood pressure, heart rate, heart rate variability, melatonin levels, and hormonal balance in the body [9].
Doronin et al. measured 73 EEG spectra, heart rate, and blood pressure response times and compared it with low frequency rhythms in geomagnetic oscillations. The authors found that the oscillations in the Earth field have identical frequencies as the observed in the EEG, and effects are observed in almost all functions of the body, starting at the level of the cell and ending with the whole organism [10].
In a study conducted by K. S. Saroka it was confirmed that there is a direct relationship between the Earth's ionosphere electromagnetic vibration properties (measured by Schuman frequencies) and human brain activity (electroencephalogram, i.e., Delta, Theta, Alpha, Beta, Gamma wave ranges). The study found that particularly pronounced interactions were observed with the temporal brain sections [11]. Rusov and others have investigated the positive impact of Earth's magnetic field on the stability of human brain biorhythms, mainly in the Delta and Theta frequency range [12].
The idea that the Earth, Sun and other space bodies have an impact on human health and behaviour, social unrest, and important global events, has been studied by scientists for decades. However, disturbances and changes in the Earth’s magnetic field can cause sleep disturbances, confusion, unusual energy shortages, and a sense of strangeness [13].
To analyse the links between human physiological parameters and magnetic field variations, this work is done using magnetometer in Lithuania [13, 14].
2. Research organization and methods
For the purpose of the research, 27.10.2016 was obtained the permission of the Bioethics Centre of the Lithuanian University of Health Sciences (No. BEC-KN(B)-31). The survey lasted from November 2016 to January 2017.
2.1. Participants
The study included 21 women, working sedentary work. All subjects were familiarized with the research process. All participants fulfilled the informed consent form. The age and work characteristics of the subjects are presented in Table 1.
Table 1Age and working characteristics of subjects (mean +/- SD)
Age (years) | Working experience (years) | Number of working hours per week | Number of working hours per day |
50.1 (±9.53) | 19.67 (±9.43) | 40.38 (±1.75) | 8.05 (±0.22) |
2.2. Study scheme
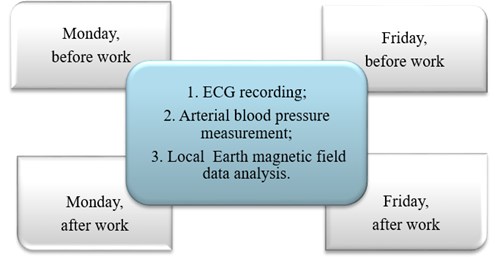
The electrocardiogram (ECG) was recorded and blood pressure measured four times for each subject (Fig. 2) during the workweek: on Monday and on Friday, before the beginning of work (between 8 and 10 am) and at the end of the work between 15 and 17 pm).
Fig. 2General structure of investigation
2.3. Investigation methodology
The ECG analysis system “Kaunas-Load W01”, created by the Cardiology Institute of Lithuanian University of Health Sciences, which registers twelve standard ECG leads, was used for ECG registration and analysis of basic system parameters [15].
We analysed the following ECG parameters – RR interval and its variations, JT interval, QRS duration, and ST amplitude measured at 40 ms distance from J point (summed ST amplitude in 12 leads). During the study, the subject was comfortably seated on the chair and at rest, the ECG 12 leads synchronically were recorded for 5 minutes. The ECG parameters RR, JT and QRS were measured in the second standard lead. Being time parameters in different time scales (RR normal value is about 1 s, JT is about 0.25 s and QRS is about 0.1 s), we suggest, that they will correlate differently with different GMF fluctuation frequencies.
The arterial blood pressure was measured manually with the sphygmomanometer. The subject was comfortably seated on the chair and waiting about three minutes before taking a measurement so that the circulatory system comes to rest. The upper arm, which is commonly used to take the measurement, lied on a table at about the same level as the heart while the reading is being done. We analysed arterial blood pressure: systolic and diastolic values and their difference – pulse amplitude of blood pressure [16].
Local Geomagnetic Field (GMF) data is constantly recorded with a magnetometer provide to Lithuania by the HeartMath Institute, USA. The magnetometer captures local GMF fluctuation frequencies from 0 to 65 Hz at five intervals ([0; 3,5] Hz, [3,5; 7] Hz, [7; 15] Hz, [15; 32] Hz, [32; 65] Hz), which corresponds to the frequency ranges emitted by EEG, but to indicate that the ranges are determined by the Schumann resonances, we add the letter “S”, in SDelta, STheta, SAlfa, SBeta and SGamma frequency ranges [14]. Local magnetic field readings were recorded on days of the study (Fig. 3). Mean value of local GMF for every day of investigation and ECG parameters means for all recorded 5 min. strip where calculated and correlation between them were evaluated for all 21 investigated women. Data were recorded during the period – 01.12.2016 to 01.03.2017.
Fig. 3Schumann resonances power in frequencies 0.32-36 Hz interval in different countries. Lithuania, is GCI003 [13]
![Schumann resonances power in frequencies 0.32-36 Hz interval in different countries. Lithuania, is GCI003 [13]](https://static-01.extrica.com/articles/20857/20857-img3.jpg)
2.4. Data analysis
Data statistical analysis was performed using MS Excel and SPSS 23.0 for Windows program. The data is presented as an average ± standard deviation (M ± SD). The non-parametric Wilcoxon criterion was used to compare the two dependent samples. The strength of the relationship between the individual indicators was assessed by calculating the Spearman correlation coefficient. The difference, when 0.05, was considered statistically significant. The difference, when 0.15, was considered like tendency.
3. Results
The changes of analysed ECG parameters during the workweek are presented in Table 2.
The RR interval had decreased (heart rate increased) during the work week (–2.416, 0.016), the JT had increased during work week (Monday evening vs Friday evening, –2.520, 0.012), QRS duration changed only during work day (on Monday, –2.589, 0.01) and ST amplitude didn’t changed nor during the work day neither during the work week.
Table 2Changes of ECG parameters mean values during workweek (mean ± SD), (I – Monday, V – Friday)
Time of investigation | RR interval [ms] | JT Interval [ms] | QRS duration [ms] | ST amplitude [mkV] |
I morning | 824.71±40.96 | 284.67±9.51 | 77.30±4.05 | 15.44±16.4 |
I evening | 894.67±54.28 | 301.08±12.02 | 79.49±4.27 | 20.10±19.27 |
V morning | 810.52±33.4 | 284.40±8.94 | 76.98±4.26 | 21.92±15.01 |
V evening | 806.1±40.27 | 288.18±9.0 | 78.05±4.42 | 21.64±15.74 |
3.1. Changes of RR interval and local GMF correlations during workweek
During the workweek no significant correlations between RR interval and local GMF parameters (in different bands) were found, but some statistically significant tendencies of such correlations were observed.
At the beginning of the work week (in the morning) the tendency of negative correlation between local GMF in SDelta [0-3.5] Hz band and RR interval was observed ((21) = –0.393; 0.078), although at the end of work week this correlation became positive.
During the workweek negative correlations between RR intervals and local GMF in the STheta [3.5-7] band were revealed, although at the end of the week the tendency of positive correlation was established ((21) = 0.414; 0.062).
Correlations between GMF power in SAlpha and SBeta frequencies bands and RR intervals became more positive during workweek: from Monday to Friday ((21) = 0.333; 0.140) (Fig. 4).
Fig. 4Correlation coefficient calculated between RR interval and Local GMF power in different frequency bands on Monday – morning, evening and Friday – morning, evening; ● p< 0.15
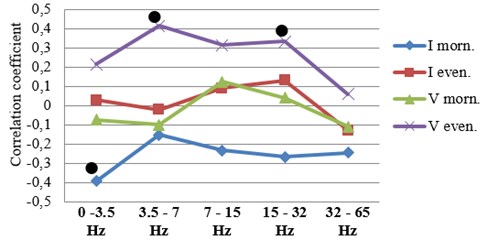
In summarizing the changes of correlations between GMF and RR intervals during the workweek, it would be difficult at the moment to identify the mechanisms that have impact on such changes and how exactly they are connected with human functioning.
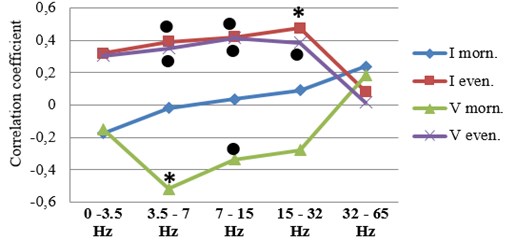
3.2. Changes of JT interval and local GMF correlations during workweek
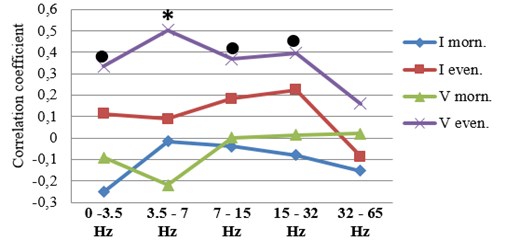
At the end of working week a tendency of correlations between local GMF and JT interval were observed: GMF in SDelta [0-3.5] Hz band ((21) = 0.334, 0.139), GMF in SAlpha [7-15] Hz band ((21) = 0.369; 0.100) and GMF in SBeta [15-32] Hz band ((21) = 0.369; 0.076). Significant correlations were observed between GMF in STheta [3.5-7] Hz band and JT interval ((21) = 0.504; 0.020) (Fig. 5). These data are similar to RR interval correlations data.
3.3. Changes of QRS duration and local GMF correlations during work week
The correlations of QRS duration and local GMF were significantly more expressed than the correlation between the RR and JT intervals and GMF.
At the beginning of the week in the morning significant negative correlations were observed in GMF in SAlpha [7-15] Hz band and QRS duration ((21) = –0.538; 0.012), similar correlations were found between GMF in SBeta [15-32] Hz band and QRS duration ((21) = –0.570; 0.007). In GMF in SGamma [32-65] Hz band a tendency towards a correlation was found although it did not reach significance ((21) = –0.362; 0.107) (Fig. 6). In the evening a tendency of negative correlations was observed in SDelta [0-3.5] Hz band ((21) = –0.330; 0.143) and in SAlpha [7-15] Hz band ((21) = –0.338; 0.134) but significant negative correlations were observed in GMF in SBeta [15-32)] Hz band and QRS duration ((21) = –0.441; 0.045).
Fig. 5Correlation coefficient calculated between JT interval and Local GMF power in different frequency bands on Monday, morning, evening and Friday, morning evening, * p< 0.05; ● p< 0.15
At the end of the week in the morning significant positive correlations were observed in GMF in STheta [3.5-7] Hz band ((21) = 0.453; 0.039) and a tendency towards correlation in SAlpha [7-15] band ((21) = 0.363; 0.106) was revealed. In the evening significant negative correlations were observed in SDelta [0-3.5] Hz band ((21) = –0.594; 0.004) and non-significant tendency was found in STheta [3.5-7] Hz band ((21) = –0.391; 0.079) and SGamma [32-65] Hz band ((21) = –0.413; 0.062).
Fig. 6Correlation coefficient calculated between QRS duration and Local GMF power in different frequency intervals on Monday, morning, evening and Friday, morning evening, * p< 0.05; ● p< 0.15
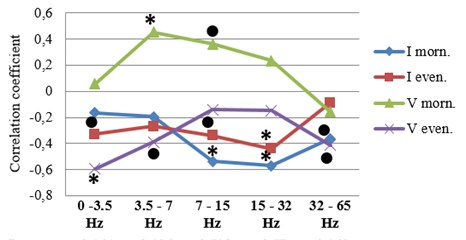
In summary it can be stated that changes in the QRS duration and GMF are associated with adaptations in the heart’s regulatory mechanisms.
3.4. Changes of ST amplitude and local GMF correlations during workweek
During the workweek ST amplitude was constantly increasing, which may be related to the effects of increasing fatigue (Table 2).
Analysing the changes in the correlations during the workweek, between the local GMF and ST amplitude, we see the same tendencies as in RR and JT intervals correlations. From Monday to Friday they changes from negative to positive (Fig. 7) in all frequency intervals. Again, in low frequency ranges (STheta, SAlpha, SBetha), we can see the largest changes in the correlations.
Fig. 7Correlation coefficient calculated between ST amplitude and Local GMF power in different frequency bands on Monday, morning, evening and Friday, morning evening, * p< 0.05; ● p< 0.15
3.5. Changes of arterial blood pressure
All values of ABP are presented in table 3. During the evening we see small increase in systolic (sABP), diastolic (dABP) as well in pulse amplitude pABP = (sABP – dABP) of ABP.
Table 3Arterial blood pressure parameters changes during week (mean+/-SD), (I – Monday, V – Friday)
Time of investigation | Sys ABP [mmHg]+/-SD | Dias ABP [mmHg]+/-SD | Pulse ampl. ABP [mmHg]+/-SD |
I morning | 117.71+/-9.3 | 74.38+/-9.7 | 43.33+/-8.2 |
I evening | 119.71+/-9.1 | 74.81+/-10.2 | 44.90+/-8.4 |
V morning | 116.48+/-9.14 | 72.14+/-7.51 | 44.33+/-8.46 |
V evening | 120.71+/-8.37 | 74.71+/-7.21 | 46.00+/-8.23 |
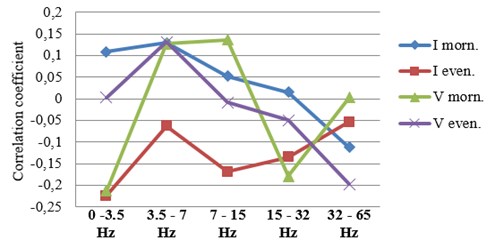
3.6. Changes of systolic arterial blood pressure and local GMF correlations during work week
During the week, the magnitude of the Earth’s magnetic field (local GMF power) and the systolic blood pressure (sABP) of the subjects in relation to all frequencies intervals of local GMF have small, non-significant correlations (Fig. 8).
Fig. 8Correlation coefficient calculated between Systolic ABP and Local GMF power in different frequency bands on Monday, morning, evening and Friday, morning evening, * p< 0.05; ● p< 0.15
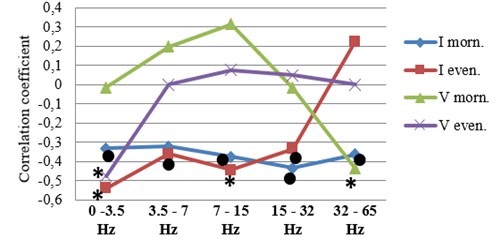
3.7. Changes of diastolic arterial blood pressure and local GMF correlations during workweek
At the beginning of the week in the morning significant negative correlation was observed in GMF SBeta [15-32] Hz band ((21) = –0.433; 0.050) and tendency of correlations in SDelta [0-3.5] Hz band ((21) = –0.330; 0.144), SAlpha [7-15] Hz band ((21) = –0.374; 0.095) and SGamma [32-65] Hz band ((21) = –0.362; 0.107), (Fig. 9). In the evening statistically significant negative correlations were observed in GMF SDelta [0-3.5] Hz band ((21) = –0.538; 0.012) and SAlpha [7-15] Hz band – ((21) = –0.443; 0.044). Also, some tendencies towards correlation were found: in STheta [3.5-7] Hz band ((21) = –0.360; 0.109) and in SBeta [15-32] Hz band – ((21) = –0.334; 0.139).
At the end of the week in the morning significant negative correlations were observed in GMF SGamma [32-65] Hz band and diastolic arterial blood pressure. In the evening a significant correlation was observed only in the SDelta [0-3.5] Hz band ((21) = –0.474; 0.03).
We observed that as fatigue increased correlations become more positive. Such changes were clearly expressed, not only in low frequencies intervals, but also in the SGamma [32-65] Hz band. So, it could be concluded, that diastolic arterial blood pressure appears to be sensitive to the local GMF changes and human fatigue.
Fig. 9Correlation coefficients calculated between Diastolic ABP and Local GMF power in different frequency bands on Monday, morning, evening and Friday, morning evening, * p< 0.05; ● p< 0.15
3.8. Changes of arterial blood pressure pulse amplitude and local GMF correlations during workweek
At the beginning of the week in the morning significant positive correlations were observed in SDelta [0-3.5] Hz band ((21) = 0.518; 0.016), STheta [3.5-7] Hz band ((21) = 0.531; 0.013), SAlpha [7-15)] Hz band, ((21) = 0.506; 0.019), and SBeta [15-32] Hz band, ((21) = 0.534; 0.013) (Fig. 10). In the evening tendencies of correlations were observed in SDelta [0-3.5] Hz band ((21) = 0.408; 0.067), STheta [3.5-7] Hz band ((21) = 0.367; 0.102), SAlpha [7-15] Hz band ((21) = 0.353; 0.116).
At the end of the week in the morning no significant correlations were observed. In the evening a tendency towards correlation was observed in SDelta [0-3.5] band ((21) = 0.418; 0.060).
Fig. 10Correlation coefficients calculated between Pulse amplitude of ABP and local GMF power in different frequency intervals on Monday, morning, evening and Friday, morning evening, * p< 0.05; ● p< 0.15
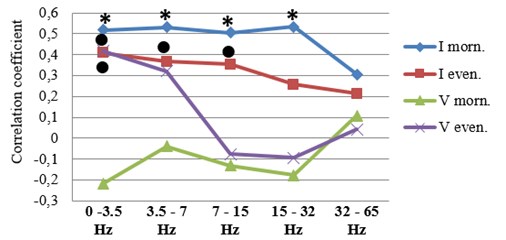
Observation of the correlations between arterial blood pressure pulse amplitude and local GMF revealed that at the beginning of workweek positive correlations were found predominately in the low frequency bands. Thus, GMF power in low frequency bands increases pulse amplitude and hemodynamic pressure in human. Although with increasing fatigue this effect decreases.
4. Discussion
Scientific research about Earth’s magnetic field activity influencing human health has revealed that arterial blood pressure is significant increased due to geomagnetic activity level: both systolic and diastolic blood pressure increased the day before until the day after the geomagnetic storm. These effects were observed despite medications being used or gender [17]. In this research, we evaluated the correlations between the local GMF activity during a workweek in middle aged women, but the results showed that a person’s physiological characteristics are constantly changing especially as fatigue increases. There is a lot of scientific researches about heart rate and GMF [18, 19], but investigations about the impact of GMF power in different frequency bands on human health or changes of separate ECG parameters are missing.
Scientists [20, 21] are investigating the correlations between the heart rate disturbances and GMF, but do not analyse data according to different GMF frequency intervals. Sasonko et al. (2018) performed investigation about correlation between RR, QT and PQ intervals with number of atmospheric factors and global GMF [22]. They found that humans have changing sensitivity for these factors, which was confirmed in our study. Dimitrova et al. [23] investigated coherence between arterial blood pressure and index of global GMF, however its still remain unclear how global GMF influence local GMF and in what frequencies it can manifest.
5. Conclusions
1) The most significant correlations between local GMF and ECG and arterial blood pressure parameters were found with the low frequency field, the most often in SDelta [0-3.5] Hz and STheta [3.5-7] Hz bands.
2) The correlations between ECG parameters (RR, JT and QRS intervals ant ST amplitude) during the working week changed from negative to positive – which appears to be associated with fatigue influence on person sensitivity to local GMF.
3) Systolic and diastolic arterial blood pressure changed in different ways. The correlations between local GMF and diastolic arterial blood pressure were especially pronounced.
4) All ECG and arterial blood pressure parameters showed great variability in correlation with local GMF. It can be associated with changing human sensitivity to GMF due to increasing fatigue.
6. Limitations
We investigated only women. Investigation was performed only in one season – winter, number of investigated persons was only 21. Geomagnetic field influence delay on human fatigue was not investigated.
References
-
Hush J. M., Michaleff Z. A., Maher C. G., Refshauge K. M. Individual, physical and psychological risk factors for neck pain in Australian office workers: A 1-year longitudinal study. European Spine Journal, Vol. 18, Issue 10, 2009, p. 1532-40.
-
Palanisamy J. K., Ponnu S., Mani S., Balakrishnan S. A critical review on traditional herbal drugs: an emerging alternative drugs for varicose veins. World Journal of Pharmaceutical Research, Vol. 7, Issue 5, 2018, p. 316-338.
-
Chomistek K. A., Manson E. J., Stefanic L. M., et al. Relationship of sedentary behaviour and physical activity to incident cardiovascular disease: results from the Women’s Health Initiative. Journal of the American College of Cardiology, Vol. 61, Issue 23, 2013, p. 2346-2354.
-
Potocki A. Selected methods of psychic – mental fatigue testing in the process of information processing. The Central European Journal of Social Sciences and Humanities, Vol. 36, 2013, p. 161-167.
-
Mork R., Falkenberg H. K., Fostervold K. I., Thorud H. M. S. Visual and psychological stress during computer work in healthy, young females - physiological responses. International Archives of Occupational and Environmental Health, Vol. 91, Issue 7, 2018, p. 811-830.
-
Guan L., Collet J.-P., Mazowita G., Claydon V. E. Autonomic nervous system and stress to predict secondary ischemic events after transient ischemic attack or minor stroke: possible implications of heart rate variability. Frontiers in Neurology, Vol. 9, 2018, p. 90.
-
Waugh A., Grant A. Ross and Wilson Anatomy and Physiology in Health and Illness. 11th Edition, New York, 2010.
-
Mccraty R. Science of the Heart. Exploring the Role of the Heart in Human Performance. Heart Math Institute, USA, Vol. 2, 2015, p. 101.
-
Sauer A., Wilcox J. E., Andrei A. C., et al. Diastolic electromechanical coupling: association of the ECG T-peak to T-end interval with echocardiographic markers of diastolic dysfunction. Circulation, Arrhythmia, Electrophysiology, Vol. 5, Issue 3, 2012, p. 537-43.
-
Doronin V. N., Parfentev V. A., Tleulin Zh S., et al. Effect of variations of the geomagnetic field and solar activity on human physiological indicators. Biofizika, Vol. 43, Issue 4, 1998, p. 647-653.
-
Saroka K. S., Persingerb M. A. Quantitative evidence for direct effects between Earth-ionosphere Schumann resonances and human cerebral cortical activity. International Letters of Chemistry, Physics and Astronomy, Vol. 20, Issue 2, 2014, p. 166-194.
-
Rusov V. D., Lukin K. A., Zelentsova et al. T. N. Can Resonant Oscillations of the Earth Ionosphere Infuence the Human Brain Biorhythm? “Pearls” and Human Brain Biorhythm, 2012.
-
A nonprofit organization. Heartmath Institute, https://www.heartmath.org/research/global-coherence/.
-
Landauskas M., Vainoras A., Ragulskis M. Algebraic and spectral analysis of local magnetic field intensity. Proceedings of the Lithuanian Mathematical Society, Vol. 56, 2015, p. 54-59.
-
Rugienius J. Clinical Electrocardiography for Practicing Doctor.Vilnius, 2011, p. 229, (in Lithuanian).
-
InformedHealth. Institute for Quality and Efficiency in Health Care, 2019, https://www.ncbi.nlm.nih.gov/books/NBK279251/.
-
Dimitrova S., Stoilova I., Cholakov I. Influence of local geomagnetic storms on arterial blood pressure. Bioelectromagnetics, Vol. 25, Issue 6, 2004, p. 408-14.
-
Alabdulgader A., Mccraty R., Atkinson M., et al. Long-term study of heart rate variability responses to changes in the solar and geomagnetic environment. A Nature research Journal, Vol. 8, 2018, p. 2663.
-
Galata E., Ioannidou S., Papailiouet M., et al. Impact of space weather on human heart rate during the years 2011-2013. Astrophysics and Space Science, Vol. 362, Issue 8, 2017, p. 138.
-
Giannaropoulou E., Papailiou M., Mavromichalaki H., et al. A studies on the various types of arrhythmias in relation to the polarity reversal of the solar magnetic field. Natural Hazards, Vol. 70, Issue 2, 2014, p. 1575-1587.
-
Gurfinkel Y., Atkov O. Y., Vasin A. L., et al. Effect of zero magnetic field on cardiovascular system and microcirculation. Life Science and Space Research, Vol. 8, 2016, p. 1-7.
-
Sasonko M. L., Ozheredov V. A., Breus T. K., et al. Combined influence of the local atmosphere conditions and space weather on three parameters of 24-h electrocardiogram monitoring. International Journal of Biometeorology, Vol. 63, Issue 1, 2019, p. 93-105.
-
Dimitrova S. Relationship between human physiological parameters and geomagnetic variations of solar origin. Advances in Space Research, Vol. 37, Issue 6, 2006, p. 1251-1257.
About this article

