Abstract
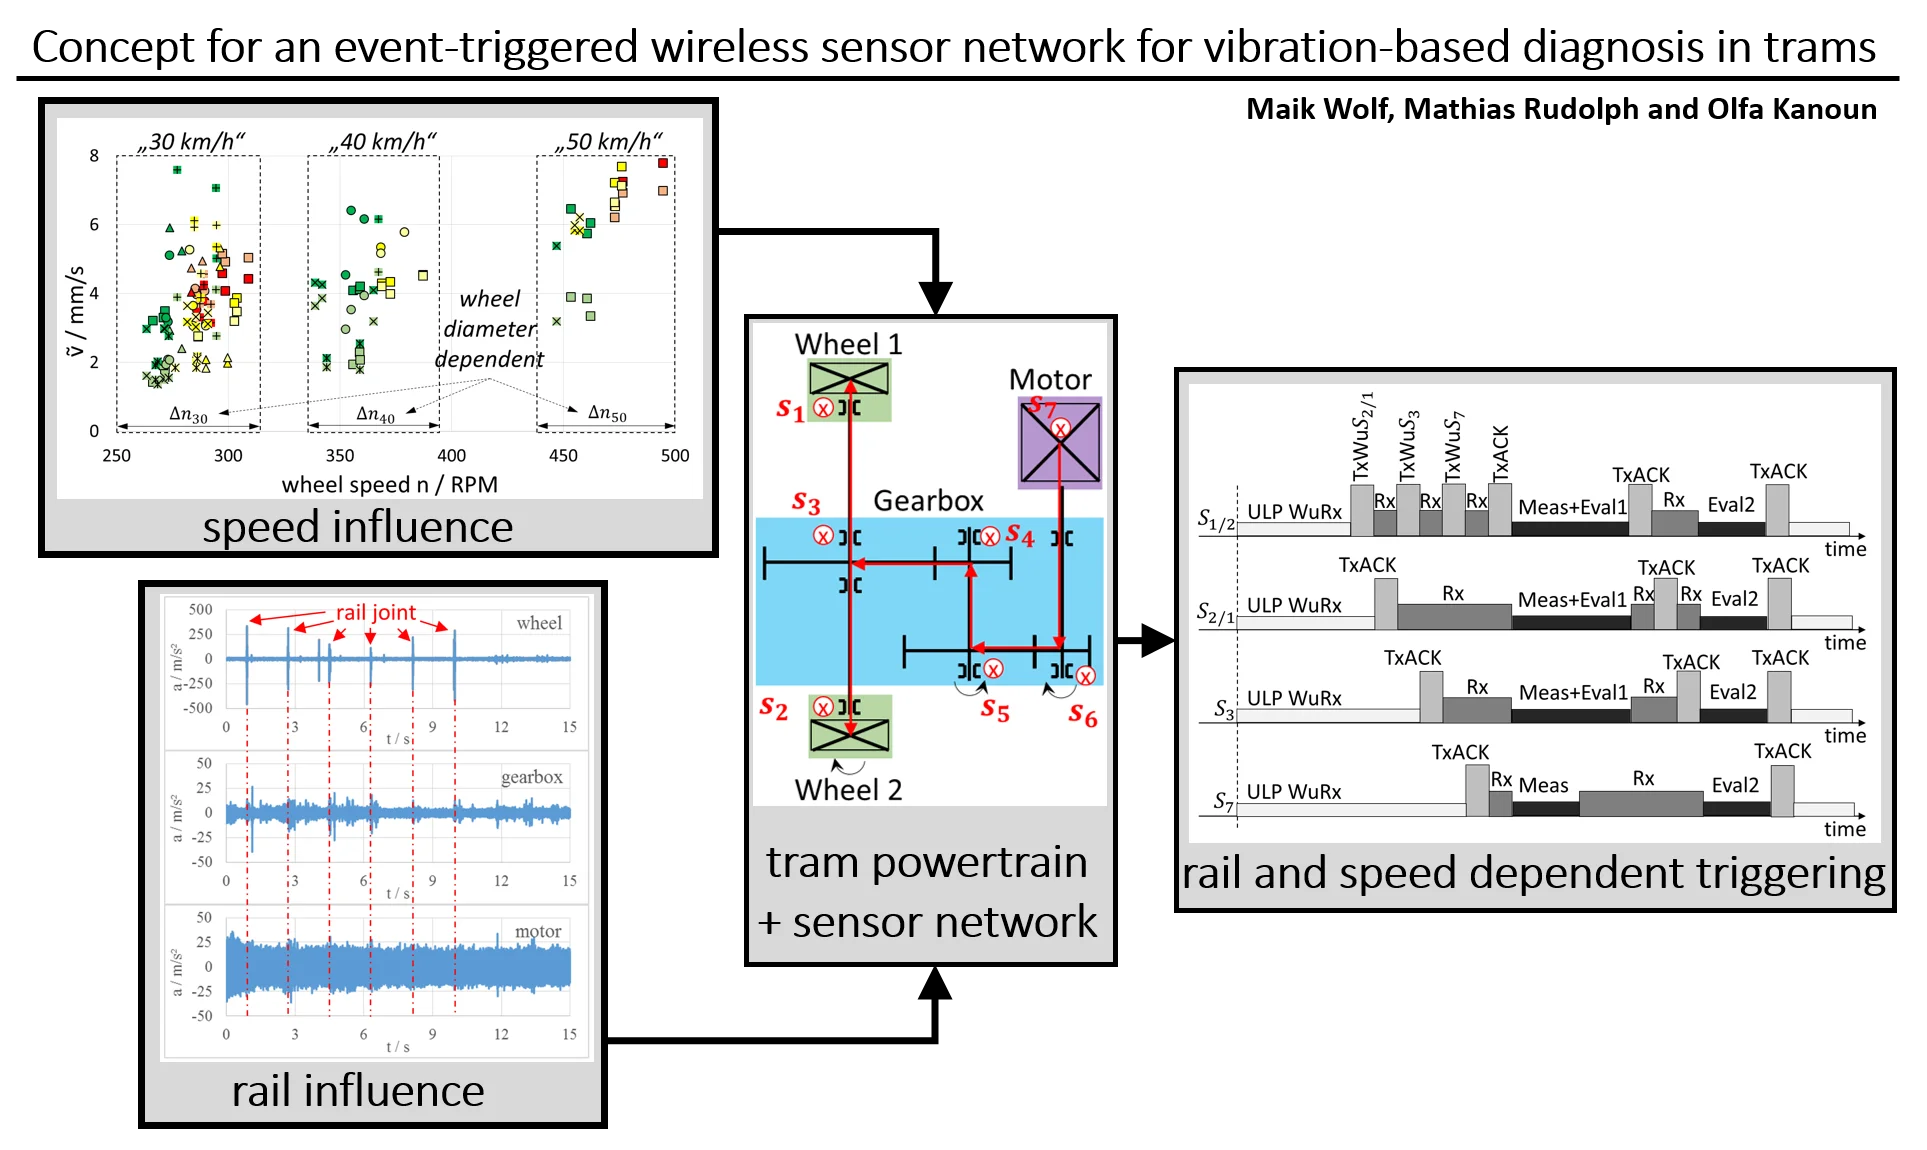
Trams are the most durable and resource efficient forms of public transportation. However, because of the varying wear in dependence on their operation mode and load levels, there is a need for condition monitoring and early maintenance. Vibration sensors provide interesting possibilities to monitor the relevant tram drive components. In this contribution we investigate their use under real conditions. On the basis of cable bound vibration measurements, the influence of the crossed track section, the tram speed and the tram condition is shown. Based on the investigation results, a concept is proposed in which a meshed and wireless sensor network, event-triggered, can acquire vibration measurement data, which are suitable for the diagnosis of tram drive components. The proposed concept has the potential to operate the sensor nodes in an energy efficient way through decentralized data evaluation taking place on the sensor node.
Highlights
- Illustration of the influence from rail and speed on vibration analysis in trams.
- A concept to trigger a wireless and meshed sensor network by an event.
- The network has the potential to perform data evaluation in an energy-saving and decentralized manner.
1. Introduction
For urban mobility, trams offer many advantages in terms of environmental protection [1], health care [2] and modern urban and transport planning [3]. It transports large groups of people, avoids traffic jams in comparison to car traffic and obtains electrical energy from the power grid at the place of consumption without the need for storage technologies. In terms of increasing urbanization, the use of tram vehicles will increase. However, in order to maintain technical availability, finance ability and acceptance by the population, the rising demand has to be addressed with modern maintenance concepts. Condition monitoring is a suitable way to detect impending vehicle failures and acoustically critical trams immediately but under the aspect of conservation of resources (exploitation of wear reserves of tribological components). In order to implement such concepts, the tram operator has to be able to quickly and accurately record the current technical condition of the vehicle in order to initiate appropriate counteractions and keep downtimes to a minimum.
To address the reliability and usability, the measured values have to be recorded in a wireless manner by a sensor network. [4-7] show the essential aspects and advantages of autonomous and energy efficient sensor networks in trams compared to conventional (cable bound) measurements.
In this context, there are restrictions in the feasibility of vibration tests. On the one hand because of the operation mode of the trams and on the other hand due to the standardized vibration diagnosis on stationary machines [8]. The main factors that affect the quality of the diagnostic results are the tram speed and the rail quality. On the basis of the random and unpredictable appearance of the rail fault, the rail quality can also be classified as an interference factor. These two parameters have to be known for a reliable diagnosis. In order to avoid discarding only a few or none of the vibration measurement data that has been sent because of energy efficiency, the data acquisition should be event-triggered and dependent on the influencing variables.
This work is divided into two main parts. On the one hand, Section 2 shows the influence of the tram speed and the crossed track section on the results of wired vibration measurements on tram drive components. Section 3 presents a concept for event-triggered data acquisition for a meshed and wireless sensor network.
2. Vibration analyses
2.1. Measurements
In many measurement scenarios, structure-borne noise up to 10 kHz was measured, using multi-channel vibration measurement technology and cable-bound IEPE acceleration sensors. The sampling rate was 51.2 kHz. The accelerometers were screwed to a total of 14 measuring points of a motor bogie or applied with epoxy resin adhesive. A motor bogie has 2 drive trains and each with 2 wheels, 1 gearbox and 1 motor. The measuring points consists of 4 wheel bearing measuring points (vertical measuring direction), 2 motor bearing measuring points (vertical) and 8 gearbox housing measuring points (4 vertical, 4 horizontal). Another measured variable is the wheel speed, which was measured at 200 Hz by an existing speed sensor.
The measurement scenarios result from the combination of various influencing factors such as the tram speed (30 km/h, 40 km/h and 50 km/h), the crossed track sections (6 track sections), the tram type (2 types) and the tram number specific maintenance condition (condition 1: after general inspection (“new”), condition 2: between 2 general inspections, condition 3: before general inspection (“in need of maintenance”)). Whereby after a running performance of 500.000 km or at the latest after 8 years the execution of a general inspection is legally prescribed [9]. For a detailed description of the measurement procedure, see [4, 5, 10].
2.2. Effect of speed and track section
Taking into consideration the norms for execution of vibration tests on stationary machines [8], the time signal ranges in which the tram has a constant speed profile (speed-stable signal range) were extracted from the measured raw signals. On the other hand, non-stationary operating modes, such as starting and braking contain acceleration or deceleration moments, which result in an additional increase of the vibration acceleration values due to increased impact processes. These non-stationary operating modes were therefore not included in the investigations.
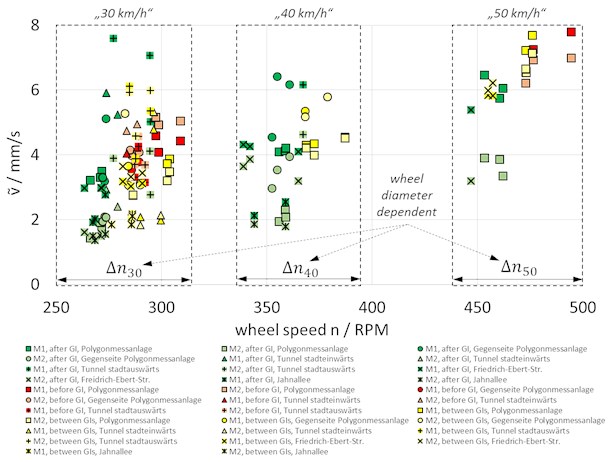
Fig. 1Effective value of vibration velocity v~ of motors M1 (dark) and M2 (bright) as a function of n in various measurement scenarios (general inspection – GI)
In the next step the extracted speed-stable signal ranges are bandpass filtered (10 Hz to 10 kHz) and then integrated in order to obtain the vibration velocity v. By selecting the vibration velocity as a reference variable, the reference to the vibration energy can be set [8]. Finally, the effective value is formed over all signal values from the vibration velocity signal.
Fig. 1 shows the values of as a function of the wheel speed n for 2 motors of a motor bogie. The fluctuations of the wheel speeds result from the diameter fluctuations of the wearing wheels. The older a wheel gets, the smaller the wheel diameter becomes and the higher its speed has to be to reach certain tram speeds. Independently of this, the increase in vibration velocity is also evident at higher tram speeds. The possible reason for this is the increasing force due to existing unbalance at increasing speed.
In addition to the rotational speed, the crossed track section has a similar influence on the vibration velocity. Possible reasons lie in the varying quality of the rails when comparing the crossed track sections with each other. Typical rail defects that can result in this are e.g. corrugations, rail breaks and dents in rail joints [11]. Because these rail faults cause one to more consecutive impacts on the wheel tyres, the resonance frequencies of the entire drive components are excited in a broadband manner, resulting in an increase in the overall vibration level.
2.3. Suitability of measurement points
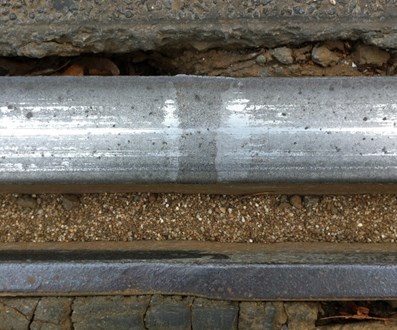
Before a measurement can be used for later diagnosis, information about the rail condition is required. For this purpose, it is investigated which measuring point on the motor bogie can represent the structure-borne noise resulting from the crossing of a rail damage. A measurement scenario was chosen in which the tram crossed the rail joints. Rail joints have the characteristic to form dents, because they are soft annealed and decarburized material and therefore of low strength. With each wheel crossing, the material is squeezed more than the one around it. The tram travelled at a constant speed of approx. 30 km/h in the 15 seconds recording time.
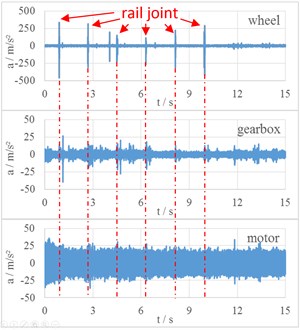
Fig. 2a) Rail joint and b) acceleration signals from wheel, gearbox and motor
a)
b)
In Fig. 2(a) the damage pattern of a rail joint at the crossed track section can be seen first. Fig. 2(b) shows the acceleration values of three measuring points. The upper signal is from a sensor applied vertically to the housing of a wheel bearing. The mean signal comes from a measuring point on the gearbox housing (vertical mounting) and the third time signal belongs to a motor.
By the example of the rail joint, the measuring point at the wheel bearing has a very good ratio between the peak value of the error signal and the remaining signal carpet and seems to be suitable from the three measuring points. The reason for this may be the attenuation of the signals from the last two measuring points, as these are located at a greater distance from the wheel-rail contact. The structure-borne noise is damped by the transmission characteristics of the drive elements (e.g. hollow shafts, gear wheels and silent couplings).
The way the signals have to be processed in order to detect the rail fault or an abnormality is not the subject in this investigation. Reference can be made to [11] and to the future activities of the authors.
However, the gearbox measuring points have the advantage of being close to the tooth mesh of the gears. This makes it possible to calculate the speed from the tooth engagement frequencies of the structure-borne sound spectra, as these are the only higher-frequency and high-energy spectral components. The calculation of speed values from time signals of the gear measuring points is not derived at this point and published at a later point in time. Reference can be made to [12, 13], where approaches are presented.
3. Event-triggered wireless sensor network
3.1. Meshed wireless sensor network
Investigations from the authors [4] demonstrate that the topology of a wireless and energy autonomous sensor network (e.g. star) and the location of the data evaluation have a large influence on the energy consumption of the autonomous sensor nodes. The energy consumption must be as low as possible so that the lifetime of the sensor node exceeds the lifetime of the diagnostic object.
The largest energy sink at a wireless sensor node is the transceiver [4] for sending () and receiving () radio waves. For this reason, the raw data should be sent rarely or never and processed in a decentral manner on the sensor node itself in order to send small amounts of data. In the current example, all the other sensor nodes also require information about the track condition of the wheel bearing measuring points. In a star-shaped network topology, this information can merge on a central unit with the requirement that the measurements of all sensor nodes run synchronously. In addition, the sensor nodes may have energy harvesting for energy supply, as the authors have already done in [4]. Then it may happen that not all sensor nodes have sufficient energy available for measurement and radio transmission at the same time. However, the aim is that at least one wheel bearing sensor node participates in a common measurement of the entire network and even triggers the measurement process. A direct communication between the individual network participants in a meshed network is therefore advisable.
In previous investigations with a star topology [4], the raw measurement data could be sent in an area of about 10 m. The data was collected in a star topology of the star. However, a meshed network is able to transmit around the drive components and to increase the range by meshing.
3.2. Concept for event triggering
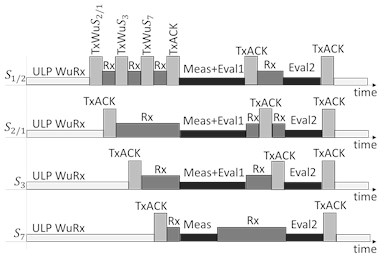
The triggering of the sensor network should be done by a wheel bearing sensor node, since only this node can make a statement about the rail condition. Passing over a “good” rail section is therefore the crucial event for triggering the other sensor nodes in order to evaluate the raw data and send the diagnostic result. If necessary, the complete raw data can be sent. Therefore, all sensor nodes should be equipped with Ultra Low Power (ULP) Wake Up Receivers (WuRx) [14]. ULP WuRx enable asynchronous communication, which takes place as required. In general, they consume energy in the micro and nano watt range.
The WuRx listens to the radio and waits for a special signal while the sensor node remains in sleep mode. This prevents the energy hungry main transceiver of the sensor node from being constantly switched on. If a WuRx now receives a wake-up signal (TxWu), the sensor node is woken up by the WuRx. When the sensor node is awake, the WuRx goes into sleep mode. The wake-up process of the wheel bearing sensor node that sent the TxWu is controlled by reaching a critical amount of stored energy.
The detailed sequence of event control is shown in Fig. 3(a) with limited number of sensor nodes. Fig. 3(b) shows the mounting locations on the motor bogie and the designation of the sensor nodes. In the scheme the wheel bearing sensor node S1 or S2 (S1/2) will wake up the other sensor nodes (S2/1 - other wheel bearing sensor node, S3 – gearbox sensor node, S7 – motor sensor node) one after the other (TxWuS2/1, TxWuS3, TxWuS7). The awakened sensor nodes give a response (TxACK) to S1/2 and S1/2 receives these messages (Rx). As soon as all awakening sensor nodes are awakened, S1/2 gives a feedback (TxACK) to all sensor nodes that the measurements (Meas+Eval1) can be started in parallel. After the measurement has been completed, the wheel bearing sensor nodes S1 and S2 first evaluate the rail condition (Eval1). The gear sensor node S3 determines the speed information (Eval1). The wheel bearing sensor node S1/2 gives all sensor nodes feedback on the rail condition. If there is a rail damage, a new measurement is started or the process can be aborted. If there is no rail fault, the other wheel bearing sensor node S2/1 also sends the rail condition of the opposite rail to all sensor nodes. If there is rail fault, a new measurement is started or the process can be aborted. If there is no rail fault, the gearbox sensor node sends the speed information to all sensor nodes. If required, a speed-based abort criterion can also be defined here. If successful, all sensor nodes begin with the diagnosis of the measurement data in order to be able to assess the drive components (Eval2). If the complete raw data is to be sent, Eval2 is omitted. Otherwise, the compressed diagnostic result is sent via the participants in the network, for example to a router, suitable routing algorithms can be used, which are not discussed here. Finally, all sensor nodes go into sleep mode and the WuRx wake up.
Fig. 3a) Scheme of event triggering and b) measuring points exemplary on one drive train of a bogie
a)
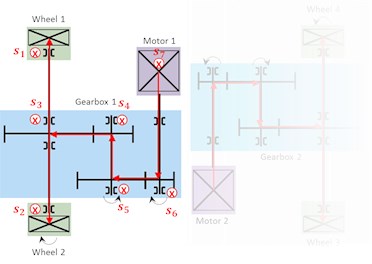
b)
4. Conclusions
Vibration based measurements in trams provide interesting possibilities for condition monitoring of the drive components. In our contribution, the influencing factors such as tram speed, crossed rail sections and tram condition were investigated under real conditions. Based on the results of the vibration measurements, a concept was developed for the reliable assessment of the tram condition using meshed and autonomous sensor nodes. The concept enables to include important influencing variables in the evaluation of the measurement data. From the point of view of the temporal and energetic efficiency of the measurements, the event triggering based on the rail condition allows to discard unsuitable measurements and to avoid the associated radio transmission time and energy. Furthermore, energy can be saved through the decentralized approach of measurement data evaluation now made possible, since only diagnostic results can be sent. Finally, a reliable database can be obtained in which random influences and disturbances from the wheel-rail contact can be avoided. The current focus is on the investigation of further rail faults and the extraction of speed information from the gearbox acceleration signal to carry out the proof of concept.
References
-
Minkos A., Dauert U., Feigenspan S., Kessinger S. Air Quality. German Environment Agency Dessau-Roßlau, 2019, p. 6, (in German).
-
Schneider A., Cyrys J., Breitner S., Kraus U., Peters A., Diegmann V., Neunhäuserer L. Quantification of environmental illnesses due to exposure to nitrogen dioxide in Germany. German Environment Agency, Dessau-Roßlau, 2018, p. 123, (in German).
-
Richard J., Mazur H., Lauenstein D. Manual Noise Action Plans – Recommendations for action for noise-reducing traffic planning. German Environment Agency, Dessau-Roßlau, 2015, p. 101, (in German).
-
Wolf M., Hund S., Rudolph M., Kanoun O. Design of a wireless and energy autonomous sensor network for condition monitoring of tram drive components. Designs, 2018, https://doi.org/10.3390/designs2040050.
-
Wolf M., Hofbauer J., Rudolph M. Diagnostics using self-sufficient wireless sensor network for a condition-based maintenance strategy - strategy for tram bearing diagnostics. 13th International Multi-Conference on Systems, Signals and Devices, Leipzig, Germany, 2016, p. 518-522.
-
Mobile Sensor Systems for Maintenance in Transportation. LUST Hybrid Technik GmbH, 2016, https://www.tib.eu/suchen/id/TIBKAT:880572426/, (in German).
-
Condition Monitored Maintenance Using Self-Powered Sensors and Vibration Based. 2014, http://www.passenger-rolling-stock-maintenance.com/media/downloads/inline/perpetuum-case-study.1449847586.pdf.
-
Mechanical Vibration – Measurement and Evaluation of Machine Vibration – Part 1: General Guidelines (ISO 20816-1:2016). German Institute for Standardization, Beuth Verlag, Berlin, 2017, p. 12, (in German).
-
Verordnung über den Bau und Betrieb der Straßenbahnen (Straßenbahn-Bau- und Betriebsordnung – BOStrab). German Federal Regulations on the construction and operation of light rail transit systems, Berlin, 1987, p. 57.
-
Wolf M., Rudolph M., Köllner J. Vibration diagnostics of tram drive components – using sensor networks. ZWF Zeitschrift für wirtschaftlichen Fabrikbetrieb, Vol. 112, Issue 1, 2, p. 62-67, 2017, (in German).
-
Mori H., Tsunashima H., Koijma T., Matsumoto A., Mizuma T. Condition monitoring of railway track using in-service vehicle. Journal of Mechanical Systems for Transportation and Logistics, Vol. 3, Issue 1, 2010, p. 154-165.
-
Zimroz R., Urbanek J., Barszcz T., Bartelmus W., Millioz F., Martin N. Measurement of instantaneous shaft speed by advanced vibration signal processing – application to wind turbine gearbox. Metrology and Measurement Systems, Vol. 18, Issue 2011, 4, p. 701-712.
-
Vemuri A., Allemang R. J., Phillips A. W. Estimation of Instantaneous Speed for Rotating Systems: New Processing Techniques. Rotating Machinery, Hybrid Test Methods, Vibro-Acoustics and Laser Vibrometry. Proceedings of the 34th Conference and Exposition on Structural Dynamics, 2016.
-
Aoudia F. A., Gautier M., Magno M., Berder O., Benini L. SNW-MAC: An Asynchonous Protocol Leveraging Wake-Up Receivers for Data Gathering in Star Networks. 7th International Conference on Sensor Systems and Software, Nice, France, 2016.
Cited by
About this article

