Abstract
In order to solve the “window effect” and “aperture repetition effect” caused by limited measurement aperture, a patch near-field acoustic holography method based on two-level iteration is proposed. After analyzing the principle and process of patch near-field acoustical holography based on orthogonal spherical wave, a patch near-field acoustical holography method based on two-level iteration is proposed. The validity of the method is verified by simulation and experiment. Compared with the reconstruction results of patch near-field acoustical holography based on orthogonal spherical wave, it shows the superiority of patch near-field acoustical holography based on two-level iteration.
1. Introduction
The near-field acoustic holography technology requires that the aperture of the holographic plane is more than 4 times of the plane area of the measured target [1]. However, making such a large aperture of the holographic measurement for a large-scale underwater acoustic source will cause a huge financial burden, and the organization of the measurement process needs too much human and material resources. In order to reduce the “window effect” in small measurement aperture, a patch near-field acoustic holography method based on two-stage iteration is proposed.
2. System model
2.1. Deduction process
The wave motion of sound wave in space ideal fluid accords with Helmholtz differential equation, which is changed into:
For Eq. (1), the method of separating variables can be used to find its solution:
If Eq. (2) is further simplified, we can get:
where and are arbitrary constants, is the first Hankel function, is the second Hankel function, is the normalized spherical harmonic function, and the specific expression of is:
For the exterior domain problem of sound field, there are:
Eq. (3) can be simplified as:
where is the spherical wave expansion coefficient.
From Eq. (6), we know that given the sound pressure in the sound field, the coefficient can be obtained, and then the sound pressure at the designated position can be reconstructed.
If the acoustic pressure column vector is known, then the acoustic pressure at each array element on the holographic plane can be expressed in the form of Eq. (6). If there are elements in the hologram, then there are equations as Eq. (6). The equations are as follows:
Eq. (7) is written in the form of matrix as follows:
In the above formula, represents the sound pressure train vector of the holographic plane, represents the number train vector of the spherical wave weight system, represents the transfer matrix from the orthogonal spherical wave source to the measuring point, is only related to the coordinates of the holographic plane array element, and its element expression is:
where .
By matrix operation of Eq. (9), we can get:
Eq. (10) usually needs to use regularization method to make approach the real solution. Through Eq. (10) to calculate the sequence vector of spherical wave weight system, the acoustic radiation is carried out on the expanded holographic plane, so as to realize the extrapolation of the holographic plane acoustic pressure data and reduce the reconstruction error.
To solve this problem, Xu Liang [2] and others [3-5] first proposed an extrapolation method of sound pressure data based on orthogonal spherical wave, as shown in Fig. 1.
Fig. 1The diagram of exploration on holographic plane
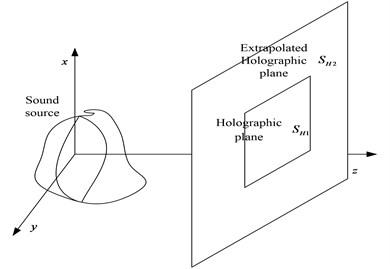
a) Schematic diagram of measurement dimension expansion
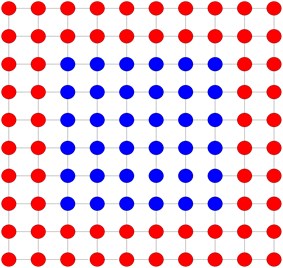
b) Schematic diagram of sound pressure expansion on holographic plane
In Fig. 1(a), is the actual measurement holographic plane, which cannot reach 4 times of the size of the sound source. is the extrapolated measurement plane, and the extended area is . In Fig. 1(b) represents the zero compensation process of the extended holographic plane.
The actual sound pressure of the hologram is and after zero filling. Among them:
2.2. Simulation analysis
When the holographic measurement aperture is about the same as the plane area of the target sound source, the patch near-field acoustic holography based on the orthogonal spherical wave can effectively reduce the influence of “window effect”, but when the holographic measurement aperture is smaller than the plane area of the target sound source, the reconstruction error is large. The following is illustrated by a simulation example.
The location of the holographic plane and the sound source is shown in Fig. 1(a). The sound source is a pulsating spherical sound source, which is located at the origin of the coordinate. The radius of the sound source is 0.15 m. The plane of the sound source is subject to simple harmonic vibration. The frequency of vibration is 1500 Hz. The vibration amplitude of the plane of the sound source is 0.05 m/s. The number of holographic plane measurement points is 5×5. The diameter of the holographic plane is 0.3 m×0.3 m. After expansion, the number of holographic plane measurement points is 10×10. After expansion, the hole diameter of the holographic plane is 0.6 m×0.6 m, the distance between the holographic plane and the center of the sound source is 0.1 m, the distance between the reconstructed plane and the sound source is 0.05 m, the air density is 1.29 kg/m3, and the sound velocity in the air is 340 m/s, According to the simulation parameters, the drawing is shown in Fig. 2 and Fig. 3. Fig. 2 shows the calculated sound pressure amplitude of the reconstructed plane after 4 times of the expanded measurement area of patch near-field acoustic holography based on orthogonal spherical wave, and Fig. 2 shows the calculated sound pressure amplitude of the reconstructed plane after 4 times of the expanded theoretical holography.
Fig. 2Sound pressure Calculated by the orthogonal near-sphere wave-based patch near-field acoustic holographiy
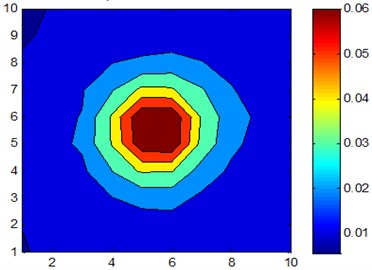
Fig. 3The theoretical sound pressure of the reconstructed plane
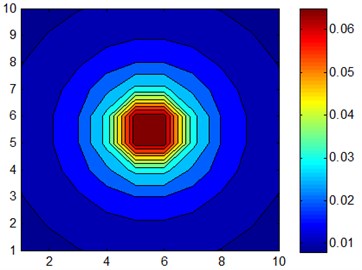
Comparing Fig. 2 and Fig. 3, it can be seen that when the area of the holographic plane and the plane area of the measured target sound source are equal, patch near-field acoustic holography based on orthogonal spherical wave can correctly identify and locate the sound source, and the reconstructed sound pressure and the theoretical sound pressure value have little difference. Specifically, when the original 0.3 m×0.3 m is extended to 0.45 m×0.45 m aperture, the amplitude of the reconstructed plane is more accurate. In order to quantitatively analyze the error of extrapolated data, the error formula of extrapolation is defined as follows:
where represents the extrapolated sound pressure data of the holographic plane, represents the theoretical sound pressure of the holographic plane. It should be noted that the theoretical sound pressure aperture of the holographic plane should be the same as that of the extrapolated measuring plane when calculating the extrapolation error with Eq. (12).
When the extrapolation aperture is 0.45 m×0.45 m, the extrapolation error calculated by Eq. (12) is 8.63 %. When the extrapolation aperture is 0.6 m×0.6 m, the extrapolation error calculated by Eq. (12) is 31.43 %. It can be seen that the extrapolation error increases rapidly with the increase of the area of the extrapolation hologram.
In this paper, we propose a patch near-field acoustical holography based on two-level iteration.
(1) Extend the measuring point of the actual holographic plane by one circle. Assuming that the original number of measurement points of holographic plane is , then the number of measurement points after expansion becomes , and the expansion points are filled with zeros according to Eq. (11);
(2) According to Eq. (9), the transfer matrix and from the sound source to the holographic plane and the extended holographic plane are calculated;
(3) According to Eq. (10), the sequence vector of spherical wave weight system is calculated;
(4) According to Eq. (8), the sound pressure on the expanded holographic plane is calculated;
(5) Replacing the sound pressure data of extrapolated holographic plane at the real aperture with the sound pressure data in the real aperture;
(6) Compare the actual measurement data of the sound pressure at the real aperture with the sound pressure data of the extrapolated holographic plane at the real aperture, and calculate the error according to Eq. (2). If the error is less than the set extrapolated error threshold, then turn to step (7). Otherwise, turn to step (3) to continue the iteration, which is the first iteration process;
(7) Compare whether the measuring points on the extrapolated hologram plane meet the required measuring points. If they have reached the required measuring points, the whole extrapolation process will be finished. Turn to the eighth step, or turn to the first step to continue the iteration, which is the second iteration process;
(8) The near-field acoustical holography is used to reconstruct the sound source and identify and locate the sound source.
3. Experimental verification
3.1. Experimental design
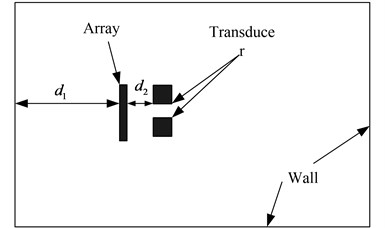
A hydrophone array is arranged in the anechoic pool, as shown in Fig. 4. Two transducers are arranged in front of the hydrophone array to provide sound waves of the same frequency. The sound pressure signals generated by the two transducers are collected through the hydrophone array. The patch near-field acoustic holography based on the orthogonal spherical wave and the patch near-field acoustic holography based on the two-level iteration are used to reconstruct the sound source, and the two methods are compared Ability to locate and identify.
Fig. 4Diagram of patch near-field acoustic holography test based on two-stage iteration
3.2. Results
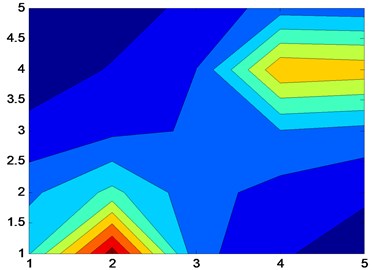
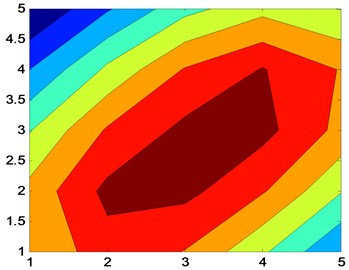
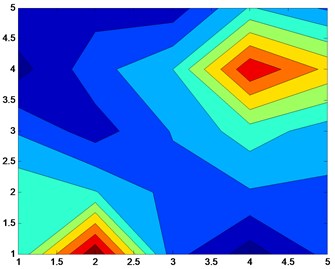
In the experiment, In the experiment, the frequency of the vibration radiation of the transducer is 5000 Hz and 6000 Hz respectively. At these two frequencies, two methods of acoustic holography are used to reconstruct the sound source. The figure of the test is shown in Fig. 5 and Fig. 6.
Fig. 5Reconstruction of sound pressure map using patch near-field acoustic holography at small measuring aperture (f= 5000 Hz)
a) Patch near-field acoustic holography based on two-level iteration
b) Patch near-field acoustic holography based on orthogonal spherical wave
Fig. 6Reconstruction of sound pressure map using patch near-field acoustic holography at small measuring aperture (f= 6000 Hz)
a) Patch near-field acoustic holography based on two-level iteration
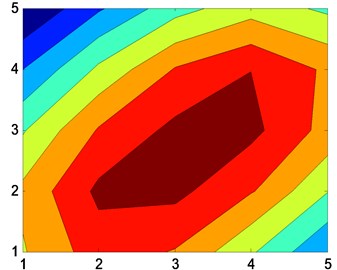
b) Patch near-field acoustic holography based on orthogonal spherical wave
4. Conclusions
The following conclusions can be drawn from:
1. The patch near-field acoustic holography based on two-level iteration can accurately reconstruct the sound source at a given frequency point, and the specific location information of the sound source can be accurately obtained from the reconstructed image, which is less affected by the “window” effect.
2. The patch near-field acoustic holography based on orthogonal spherical wave cannot distinguish the two sound sources well at lower frequency. With the increase of frequency, the sound source can be located clearly.
3. At the frequency points of 5000 Hz and 6000 Hz, two sound sources can be clearly identified by patch near-field acoustic holography based on two-level iteration, while patch near-field acoustic holography based on orthogonal spherical wave cannot distinguish two sound sources in the holographic plane, which shows the superiority of the improved method.
References
-
Williams E. G., Houston B. H., Herdic P. C. Fast Fourier transform and singular value decomposition formulations for patch near field acoustical holography. Journal of the Acoustical Society of America, Vol. 114, Issue 3, 2003, p. 1322-1333.
-
Xu Liang, Chen Xinzhao, et al. Near field acoustic holography resolution enhancement method based on orthogonal spherical wave interpolation. China Science and Technology Road Paper Online, Vol. 12, Issue 3, 2007, p. 181-185.
-
Bi Chuanxing, Wang Hui, et al. Weighted norm extrapolation method of holographic sound pressure field. Acta Physica Sinica, Vol. 60, Issue 11, 2011, p. 114-118.
-
Wall A. T., Gee K. L., James M. M. Nearfield noise measurements of a high-performance military jet aircraft. Noise Control Engineering Journal, Vol. 60, Issue 4, 2012, p. 421-434.
-
Wall A. T., Gee K. L., Neilsen T. B. Modified statistically optimized near-field acoustical holography for jet noise characterization. Proceeding of Meetings on Acoustics, London, 2013.
