Abstract
Vehicle comfort is related to vibrations induced due to surface irregularities and power generation and transmission parts. Long exposure to high vibrations may lead to numbness, stiffness, and pain in the rider’s hand parts such as fingers, shoulders, and neck. It is a challenge to design a good suspension system and vibration absorber which isolates the driver/rider from the induced vibrations. The principle aim of a vehicle’s suspension system/vibration absorber is to isolate the occupant from the induced disturbances, while still allowing the average driver to maintain control over the vehicle and drive it safely. The purpose of the present study is to investigate the vibrations in the motorcycle handlebar and modify the handlebar to reduce the vibration for good ride comfort without affecting its handling. A motorcycle with an under square engine is selected for the experimentation. The under square engine has more stroke length than bore diameter and hence it is more susceptible to generate vibrations. A tuned mass damper system is designed and developed to attenuate handlebar vibrations. To investigate and predict vibration attenuation levels in handlebar at different operating conditions, a proper design of experiments (DOE) is carried. In the DOE, the effects of factors such as motorcycle engine speed, mass on handlebar have been studied on vibrations at the handlebar. The objective of DOE is to develop a robust model that predicts the handlebar vibrations of a motorcycle which is highly desirable when rider exposes to vibration for a long period. The results of the investigation show vibration attenuation from 23 to 66 % at various engine speeds. The effect of the tuned mass damper is substantially visible at higher engine RPM hence proper modification of handlebar becomes essential in case of high revving applications where riders are exposed to high vibrations for longer periods.
1. Introduction
The performance of a vehicle does not just depend upon good power-train or fine aesthetics, but on good levels of NVH (Noise, Vibration and Harshness). Nowadays, vehicles are expected to be reliable and comfortable during their operation. The comfort of the vehicle depends upon engine noise, exhaust note, rattle noise between components, and vibrations transferred to the human body etc. The human body exposure to automobile vibrations is classified into whole body vibrations (WBV) and hand arm vibration (HAV]. In the case of motorcycles, vibrations are transferred to the human body from three points i.e. handlebar, foot-pegs and seat. WBV is transmitted through seat and foot-pegs whereas HAV is transmitted through handlebar [1]. This study focuses on HAV transmitted through the handlebar of a motorcycle. Long exposure to HAV leads to numbness and tingling in the fingers. The musculoskeletal disorder (MSD) is an after effect of HAV wherein pain in upper extremities, dexterity, and loss of manual sensitivity can be observed [2]. Further, long exposure to HAV may lead to a variety of neuromuscular and vascular symptoms, like tingling in digits, discomfort in shoulder and neck etc. [3]. However, the severity of musculoskeletal disorder (MSD), neurovascular and vascular symptoms depend upon the intensity and duration of exposure to vibrations [4]. Several International Organisations have provided standards and guidelines for measurement and evaluation of vehicle vibration such as ISO 2631 or BS 6841 [5]. Standards and Guidelines for the measurement and evaluation of hand transmitted vibrations are provided in ISO 5349-1 and ISO 5349-2 [6, 7].
The present study is carried out to investigate the vibrations in the handlebar of a motorcycle and incorporate the modification to reduce vibrations for good ride comfort without affecting its handling. The handlebar is modified using Tuned Mass Damper to attenuate vibration amplitudes. Vibration measurements are carried out for original (stock) and modified handlebar. It has been observed that the maximum amplitude value is reduced by substantial margins using a modified handlebar. The systematic design of experiments (DoE) is carried out to study the main effects and interaction effect of controllable variables on the response variable. Controllable variables are selected as engine speed and mass on handlebar whereas the response variable is an acceleration of handlebar vibration. A fixed effect two-way ANOVA model is developed to study the results. DoE also predicts the handlebar vibration levels at various controllable variables using response surface methodology.
Vibration absorbers/dampers are used to minimize the transfer of vibrations from one component to another. Dampers are classified into Passive dampers and Active Dampers. Passive damping is further classified into two parts i.e. material damping and tuned mass damping. In case of material damping, the material is introduced to restrict the transfer of vibration and material properties are varied to get the desired vibration isolation. The most general vibration isolators are elastomeric materials. The selection of elastomeric material depends upon two factors, degree of vibration isolation and durability of an isolator. The synthetic elastomeric material can maintain the properties for a wide range of temperatures making it better than Natural Rubber (NR) and Ethylene Propylene Diene Monomer (EPDM) in thermal cyclic test [8].
Different researchers have developed various devices to absorb/ damp automobile vibrations. An adaptive pneumatic suspension system is developed which takes information such as road location, International roughness index, and curve radius through GPS receiver. This information is used to adjust the suspension system to limit the vibrations within ISO 2631 standards [9]. Similarly, a passive vibration damping technique is developed which was derived from a single particle impact damping technology [10]. In this technology, visco-elastic damping polymer balls are inserted into the motorcycle handlebar. In this mechanism, energy is absorbed during the friction of particles with each other or with the chamber walls. Design of experiments (DOE) was performed to study the effects of parameters such as excitation frequency, excitation amplitude, particle material, particle size, packing ratio (%) on damping the handlebar vibrations. A fractional factorial design was developed using the Taguchi method. To reduce the number of experiments, the concept of the orthogonal array was used. The experimental results illustrate the reduction of about 50 % in handlebar vibration by using particle damper. The DOE result also predicts the optimum vibration for given controllable variables.
Article [11] presented an experimental design (24 factorial design) to study the main effects of the factors such as motorcycle age, engine size, road type and rider weight on motorcycle exposure action time value (EAV). Further, an artificial neural network was derived for the estimation of vibration exposure time. The results of experimentation suggest EAV time according to the condition of the motorcycle, engine size, and road type.
In tuned mass damping, an additional degree of freedom is introduced to control the frequency response function within the frequency range of interest [12]. Tuned Mass Damper (TMD) can be implemented as an alternative engineering solution to control steering wheel or handlebar vibrations in case of both four-wheeler and two-wheeler. TMD is a suspended supplementary mass mounted on a spring-damped element, attached to primary/main system mass. TMD is also known as a dynamic neutralizer as it neutralizes the main vibrations in the main system by self-vibrations with a phase difference. Besides, a Single Degree Freedom (SDOF) model is converted to Double Degree Freedom (DDOF) model wherein two natural frequencies are generated, either of which is not equal to the natural frequency of the SDOF model [13].
TMD is a well known concept but it has its share of limitation such as it adds weight to the system, consumes space and it cannot be tuned on the fly. To overcome these drawbacks, Active Tuned Absorber (ATA) is introduced. In ATA, spring and damper of TMD are replaced with actuation mass. Actuation mass is of an electromagnetic type which can be changed by merely changing coil current [14].
From the various studies carried out related to tuned mass damper system, natural frequency, amplitude, and mass of the main system are the inputs for the design of TMD. TMD design is significantly dependent upon the location of installation and the production variability, If TMD is installed on a system without studying the natural frequency of the system then the modified design may fail due to resonance phenomenon. Production variability is another crucial factor, as no two components can be manufactured exactly the same with different natural frequencies.
The aim of the present study is to investigate amount of TMD and location of TMD to be added on handlebar for vibration attenuation. Similarly, to investigate the speed at which TMD gives best results for vibration attenuation. The investigation is also aimed at identification influence of controllable variables on handlebar vibration.
2. Experimental setup
In this study, vibration analysis on motorcycle handlebar is carried out on 2014 make Royal Enfield Thunderbird 350. The motorcycle is powered by 346 cc, air cooled single cylinder under square engine. Motorcycle with under square engine is selected for the study because its stroke length is greater than bore diameter making it more imbalance and generate more inertial forces than of over square engine. Because of imbalance and high inertial forces in under square engine, it further induces more vibrations in various components and body panels. Besides, the imbalance forces are not balanced at the crank by providing a counterbalance. Since the engine is mounted over the frame directly, more amount of vibrations are transferred to the frame, which otherwise could be dampened using elastomeric mounts. These vibrations are further transferred to handlebar, tank, foot-pegs, and seat
Fig. 1Tuned mass damper
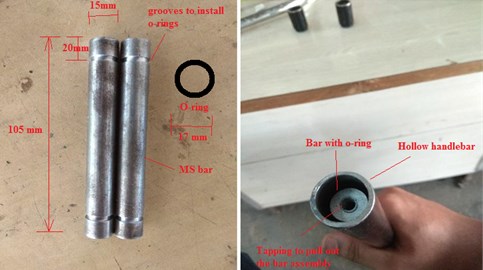
The idea of introducing TMD to motorcycle handlebar is to dissipate the vibrating energy of handlebar through the damping in TMD. The natural frequency of damper is tuned near to the natural frequency of motorcycle handlebar. The natural frequency of motorcycle handle bar is found to be 62.5 Hz (angular frequency of 392.5 rad/s or 3750 rpm) through pre experimentations. From the natural frequency of handlebar, the mass of TMD is calculated about 270 gm considering stiffness of elastomeric material as 42 N/mm. The total mass of 270 gm is divided into two equal mass on each side of handlebar. For TMD mass, MS bright bar with uniform diameter 15 mm, length 105 mm, and weight as 135 gm is selected on each side. Tuned mass is 13 % that of handlebar mass. Each bar is provided with two grooves of 2 mm diameter, at 20 mm from each end of the bar. These grooves are provided to install elastomeric O-rings (17 mm OD) as damping material. The complete assembly (bars with O-rings installed on the grooves) is pushed inside the hollow section of the handlebar. Fig. 1 shows the bar assembly and its installation in the handlebar for the experimentation.
A Piezotronics make single-axis accelerometer is used as a vibration transducer. The accelerometer is fitted with Integrated Circuit Piezoelectric (ICP) type with a built-in amplifier, the sensitivity of 100 mV/g, frequency bandwidth 0-20 kHz, and range ±10 g. National Instruments make Data Acquisition System is used for experimentation which consists of 9234 DAQ card and 9171 chassis. The sampling frequency of the card is 51.2 kHz USB connected four input channels. This DAQ system is integrated with LabVIEW 15.0 software to analyze vibration signals using various signal processing techniques.
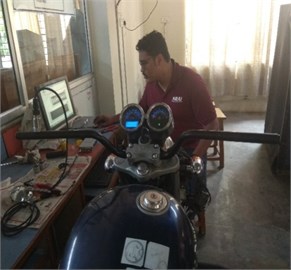
The motorcycle is parked on the main stand; a rubber mat is placed below the stand to avoid slippage over concrete flooring during experimentation. A 5.5 mm hole is drilled and a 6.25 mm tap is used on the handlebar to install a stud mounted accelerometer. The accelerometer is attached to the handlebar by using the stud as shown in Fig. 2. Experimentations are carried out at different engine RPM by varying throttle valve position of the carburettor. Engine RPM is displayed on an integrated tachometer as shown in Fig. 2. The engine is allowed to settle at a particular RPM for approximately 90 seconds before recording the readings.
Fig. 2Experimentation on motorcycle handlebar
3. Experimentation
Experimentation is carried out on stock handlebar for four different cases at various RPMs. The four cases are tabulated in Table 1. Vibration signals are recorded in terms of acceleration for each case as mentioned above. Stock handlebar is modified by inserting designed TMD bars. The above procedure is repeated with modified handlebar.
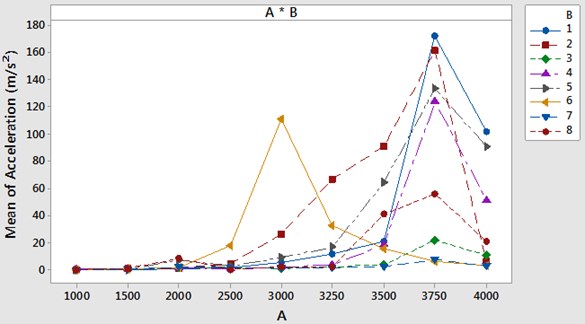
The acceleration values are recorded at various speed levels using a different combination of mass on handlebar. Fig. 3 shows acceleration in different handlebar cases. For most of the handlebar cases, vibration amplitudes are highest at 3750 engine speed. As per calculation, the natural frequency of handlebar (without any mass) is 392.5 rad/s assuming stiffness of quad clamp as 394.384 kN/m and handlebar bar mass as 2.56 kg. The external excitation engine frequency of a four-stroke engine at 3750 engine rpm is 62.5 Hz or 392.5 rad/s. This indicates that external excitation frequency becomes equal to the natural frequency of handlebar and hence the system resonates with higher amplitudes at 3750 engine speed or 62.5 Hz external excitation frequency.
TMD helps to minimize the vibration amplitude of the system but at the same time adds weight to the system. However, to a certain point, TMD becomes more effective with an increase in mass. A literature survey showed that 13.3 % of handlebar mass can be used as TMD mass which would attenuate the response and give optimum results. Percentage attenuation achieved for the above four mentioned cases of mass on handlebar with TMD is 23.5 %, 31.25 %, 65.9 %, and 56 % respectively. The peaks have shifted in case of a modified handlebar due to a shift in natural frequency. The results of experiment of present study are converged towards the fact that addition of mass would reduce the handlebar vibrations, but at the same time, the location of the additional weight plays a crucial role in the vibration behaviour of the handlebar. Uniform distribution of mass on handlebar would better attenuate handlebar vibration than addition of localised mass (particularly at the ends of handlebar). This investigation is helpful in vibration attenuation of all the motorcycle handlebars. From the study, it is also observed that the effect of TMD is substantially visible at higher engine RPMs. Hence proper modification of handlebar becomes imperial in case of high revving application.
Table 1Mass on handlebar
Type of handlebar | Combination of mass on handlebar cases | Mass on handlebar |
Stock handlebar | 1 | Plain handlebar (HB) |
2 | Bar ends attached to handlebar (HB +BE) | |
3 | Lever, mirror and switches mounted on handlebar (HB + LSM) | |
4 | Bar ends and other accessories installed on handlebar (HB +BE + LSM) | |
Modified handlebar with TMD | 5 | Plain handlebar with TMD (HB+TMD) |
6 | Bar ends attached to handlebar with TMD (HB+BE+TMD) | |
7 | Lever, Mirror and Switches mounted on Handlebar with TMD (HB+LSM+TMD) | |
8 | Bar ends, mirror and switches mounted on handlebar with TMD (HB+BE+LSM+TMD) |
Fig. 3Acceleration readings at various speed levels using different combination of mass on handlebar
4. Design of experiments
A two factor experimental design was carried out to determine the influence of engine speed (A) and handlebar mass (B) on acceleration at the motorcycle handlebar. Engine speed and mass on handlebar were the two factors (controllable variables) used while experimental design. Similarly, acceleration at the motorcycle handlebar was used as a response variable. No noise factor or uncontrollable variable (motorcycle rider) is used during DOE because the entire experimentation was carried out in the laboratory and motorcycle was resting on its main stand during experimentation. Fig. 4 shows the process model of vibration experimentation and the factor notations.
The objective of the experimental design was to know the relation between controllable and response variables also to capture the changes of the controllable variable so that response being minimum. Vibration analysis was carried out at different levels of engine speed and mass on handlebar. Experimentation was carried out with two replicates. A complete randomized full factorial design was used for experimental design. Total 144 (9×8×2=144) experimental test runs were conducted during experimentation and acceleration at motorcycle handlebar was measured during each run. Two-way analysis of variance (ANOVA) was employed to investigate the effects of speed (A) and mass on handlebar (B) on the handlebar vibration response (). Total 9 speed levels and 8 mass levels were considered during experimentation. Table 2 shows the controllable factors and their levels of experimentation. Table 3 shows the sequence of experimental test runs during experimentation. Table 3 also indicates the acceleration values at each experimental test run. The fixed effect model of the basic two-way ANOVA is given by Eq. (1):
where – grand mean, – th treatment effect (A), – th treatment effect (B), – interaction effect of A and B, – experimental error.
Fig. 4Process model and factor notations
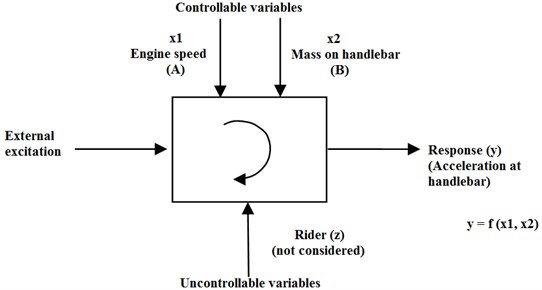
Table 2Factors and their levels
Factor | L1 | L2 | L3 | L4 | L5 | L6 | L7 | L8 | L9 |
Speed (rpm) | 1000 | 1500 | 2000 | 2500 | 3000 | 3250 | 3500 | 3750 | 4000 |
Mass on handlebar | (HB) | (HB+BE) | (HB+ LSM) | (HB+BE+ LSM) | (HB+ TMD) | (HB+ BE+ TMD) | (HB+ LSM+TMD) | (HB+BE+LSM+TMD) | – |
It is important to check whether the data satisfies the condition of normality and equality of variance required for the ANOVA test. Fig. 5 shows the normal probability plot of the residual. The normal probability plot indicates that the residuals lie very close to the line of normal distribution. Only a few residuals are away from the normal distribution line. In another word, it looks all the data is normally distributed. These plots do not suggest any problem with model assumptions.
The ANOVA table indicates the individual as well as the interaction effect of the two factors on the response variable. The confidence level of 95 % ( 0.05) is considered to check the hypothesis. The result of variance analysis is shown in the Table 4. It has been observed that there is a significant main and interaction effect of the two factors on the response. Total degrees of freedom is 143 (abn-1=144-1=143). The analysis of variance test is carried out to check the hypothesis. There are two types of hypothesis which are null hypothesis and alternate hypothesis [15]. The null hypothesis states that the means of all sources of variance is the same against the alternative hypothesis which states that there is a difference in means of all sources of variance. Table 4 shows that the probability value (P-value) is less than 0.001 or less than 1 %. Hence the null hypothesis is rejected and the alternative hypothesis is accepted. F value is an indicator of the magnitude of effect on the response variable. High value indicates that the main effects of factor A & B and the interaction effect of AB are highly significant.
Table 3Acceleration at each experimental test run
Std Order | Run Order | Speed (A) | Mass (B) | Accl (m/s2) | Std Order | Run Order | Speed (A) | Mass (B) | Accl (m/s2) |
1 | 98 | 1000 | 1 | 0.006 | 73 | 43 | 1000 | 1 | 0.0059 |
2 | 51 | 1000 | 2 | 0.006 | 74 | 130 | 1000 | 2 | 0.0061 |
3 | 45 | 1000 | 3 | 0.03 | 75 | 111 | 1000 | 3 | 0.033 |
4 | 132 | 1000 | 4 | 0.7 | 76 | 119 | 1000 | 4 | 0.67 |
5 | 136 | 1000 | 5 | 0.008 | 77 | 7 | 1000 | 5 | 0.0082 |
6 | 8 | 1000 | 6 | 0.007 | 78 | 21 | 1000 | 6 | 0.0071 |
7 | 107 | 1000 | 7 | 0.07 | 79 | 18 | 1000 | 7 | 0.07 |
8 | 141 | 1000 | 8 | 0.04 | 80 | 101 | 1000 | 8 | 0.045 |
9 | 33 | 1500 | 1 | 0.14 | 81 | 124 | 1500 | 1 | 0.143 |
10 | 2 | 1500 | 2 | 0.8 | 82 | 133 | 1500 | 2 | 0.78 |
11 | 30 | 1500 | 3 | 0.17 | 83 | 109 | 1500 | 3 | 0.68 |
12 | 74 | 1500 | 4 | 0.4 | 84 | 127 | 1500 | 4 | 0.35 |
13 | 5 | 1500 | 5 | 0.08 | 85 | 47 | 1500 | 5 | 0.078 |
14 | 50 | 1500 | 6 | 0.6 | 86 | 95 | 1500 | 6 | 0.62 |
15 | 53 | 1500 | 7 | 0.19 | 87 | 68 | 1500 | 7 | 0.21 |
16 | 103 | 1500 | 8 | 0.7 | 88 | 14 | 1500 | 8 | 0.74 |
17 | 144 | 2000 | 1 | 0.31 | 89 | 20 | 2000 | 1 | 0.33 |
18 | 23 | 2000 | 2 | 0.9 | 90 | 83 | 2000 | 2 | 0.88 |
19 | 97 | 2000 | 3 | 1.4 | 91 | 79 | 2000 | 3 | 1.45 |
20 | 117 | 2000 | 4 | 1.6 | 92 | 140 | 2000 | 4 | 1.71 |
21 | 62 | 2000 | 5 | 7 | 93 | 77 | 2000 | 5 | 7.3 |
22 | 108 | 2000 | 6 | 1.3 | 94 | 37 | 2000 | 6 | 1.24 |
23 | 70 | 2000 | 7 | 1.9 | 95 | 116 | 2000 | 7 | 1.84 |
24 | 106 | 2000 | 8 | 8 | 96 | 102 | 2000 | 8 | 7.9 |
25 | 1 | 2500 | 1 | 1.41 | 97 | 29 | 2500 | 1 | 1.52 |
26 | 110 | 2500 | 2 | 4.2 | 98 | 31 | 2500 | 2 | 4.54 |
27 | 57 | 2500 | 3 | 1.8 | 99 | 112 | 2500 | 3 | 1.91 |
28 | 15 | 2500 | 4 | 0.3 | 100 | 40 | 2500 | 4 | 0.23 |
29 | 122 | 2500 | 5 | 2 | 101 | 17 | 2500 | 5 | 2.7 |
30 | 113 | 2500 | 6 | 18 | 102 | 134 | 2500 | 6 | 17.7 |
31 | 125 | 2500 | 7 | 1.7 | 103 | 60 | 2500 | 7 | 1.65 |
32 | 41 | 2500 | 8 | 0.15 | 104 | 25 | 2500 | 8 | 0.162 |
33 | 39 | 3000 | 1 | 4.9 | 105 | 34 | 3000 | 1 | 4.78 |
34 | 76 | 3000 | 2 | 25 | 106 | 143 | 3000 | 2 | 27.1 |
35 | 120 | 3000 | 3 | 0.7 | 107 | 80 | 3000 | 3 | 0.66 |
36 | 118 | 3000 | 4 | 1.8 | 108 | 65 | 3000 | 4 | 1.84 |
37 | 55 | 3000 | 5 | 9 | 109 | 91 | 3000 | 5 | 8.9 |
38 | 22 | 3000 | 6 | 110 | 110 | 135 | 3000 | 6 | 112 |
39 | 129 | 3000 | 7 | 1.1 | 111 | 67 | 3000 | 7 | 1.32 |
40 | 19 | 3000 | 8 | 2 | 112 | 26 | 3000 | 8 | 2.2 |
41 | 6 | 3250 | 1 | 11 | 113 | 94 | 3250 | 1 | 12.6 |
42 | 38 | 3250 | 2 | 65 | 114 | 24 | 3250 | 2 | 68.2 |
43 | 3 | 3250 | 3 | 2.1 | 115 | 10 | 3250 | 3 | 2 |
44 | 90 | 3250 | 4 | 3 | 116 | 126 | 3250 | 4 | 3.6 |
45 | 93 | 3250 | 5 | 17 | 117 | 69 | 3250 | 5 | 16.1 |
46 | 142 | 3250 | 6 | 32 | 118 | 85 | 3250 | 6 | 33.2 |
47 | 71 | 3250 | 7 | 1.7 | 119 | 66 | 3250 | 7 | 1.62 |
48 | 73 | 3250 | 8 | 2.5 | 120 | 99 | 3250 | 8 | 2.36 |
49 | 131 | 3500 | 1 | 20 | 121 | 84 | 3500 | 1 | 21.2 |
50 | 78 | 3500 | 2 | 90 | 122 | 4 | 3500 | 2 | 91.4 |
51 | 12 | 3500 | 3 | 3.5 | 123 | 72 | 3500 | 3 | 3.32 |
52 | 46 | 3500 | 4 | 18 | 124 | 87 | 3500 | 4 | 18.88 |
53 | 75 | 3500 | 5 | 65 | 125 | 59 | 3500 | 5 | 63.2 |
54 | 58 | 3500 | 6 | 15 | 126 | 48 | 3500 | 6 | 15.78 |
55 | 82 | 3500 | 7 | 2 | 127 | 86 | 3500 | 7 | 2 |
56 | 139 | 3500 | 8 | 40 | 128 | 36 | 3500 | 8 | 41.44 |
57 | 28 | 3750 | 1 | 170 | 129 | 138 | 3750 | 1 | 174 |
58 | 61 | 3750 | 2 | 160 | 130 | 105 | 3750 | 2 | 163 |
59 | 11 | 3750 | 3 | 22 | 131 | 9 | 3750 | 3 | 21.58 |
60 | 13 | 3750 | 4 | 125 | 132 | 54 | 3750 | 4 | 123.5 |
61 | 52 | 3750 | 5 | 130 | 133 | 35 | 3750 | 5 | 136.6 |
62 | 89 | 3750 | 6 | 6 | 134 | 100 | 3750 | 6 | 6.6 |
63 | 88 | 3750 | 7 | 7.5 | 135 | 121 | 3750 | 7 | 7.22 |
64 | 104 | 3750 | 8 | 55 | 136 | 92 | 3750 | 8 | 56.3 |
65 | 128 | 4000 | 1 | 101 | 137 | 32 | 4000 | 1 | 102 |
66 | 63 | 4000 | 2 | 6 | 138 | 44 | 4000 | 2 | 6.2 |
67 | 56 | 4000 | 3 | 10 | 139 | 16 | 4000 | 3 | 11 |
68 | 49 | 4000 | 4 | 50 | 140 | 123 | 4000 | 4 | 52 |
69 | 137 | 4000 | 5 | 90 | 141 | 64 | 4000 | 5 | 92 |
70 | 115 | 4000 | 6 | 3 | 142 | 27 | 4000 | 6 | 2.6 |
71 | 81 | 4000 | 7 | 3 | 143 | 42 | 4000 | 7 | 2.4 |
72 | 96 | 4000 | 8 | 21 | 144 | 114 | 4000 | 8 | 20.89 |
Fig. 5Residual plots for acceleration (m/s2)
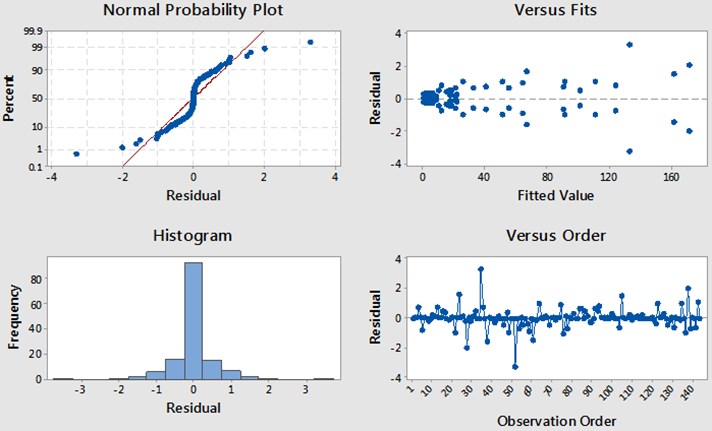
Fig. 6 shows the box plot for factor A (speed) against response (acceleration). The box plot shows that the acceleration level at 3750 speed is much higher than that at the other speed levels. It also shows that the variability in the acceleration at all nine speed levels is different. This indicates the significance of the effect of factor A on the response variable. The variability of acceleration is highest at 3750 speed level. Another interesting thing at 3750 speed is that the mean value of acceleration is at equal distance from quartile Q2 (lower 25 % of the readings) and Q3 (upper 25 % of the readings). In another word, consistent high acceleration at speed 3750 indicates the presence of resonance at this speed. Extreme ends show maximum and minimum acceleration at 3750 engine speed.
Table 4ANOVA table
Sources of variance | DoF | Sum of squares | Mean sum of squares | value | value |
A | 8 | 95488 | 11936.0 | 14455.22 | 0.000 |
B | 7 | 25607 | 3658.1 | 4430.18 | 0.000 |
AB | 56 | 107775 | 1924.5 | 2330.74 | 0.000 |
Error | 72 | 59 | 0.8 | – | – |
Total | 143 | 228929 | – | – | – |
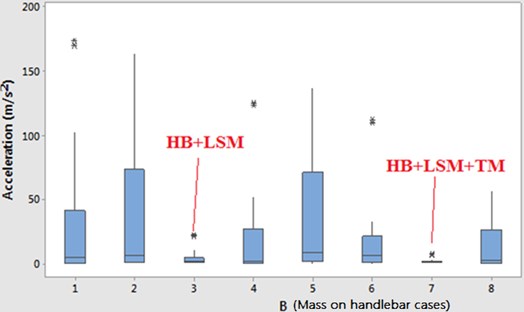
Fig. 7 shows the box plot for factor B (mass on handlebar) against response (acceleration). The box plot shows that the variability of response is different for different mass on handlebar. It also indicates that the handlebar with (HB+LMS+TM) shows minimum variability of acceleration at different speed levels. Tuned mass (TM) has reduced the average acceleration by 45.98 % in the case of HB+LSM. And it is evident from the box plot for factor B that handlebar with left side mirror and tuned mass gives the acceleration values in acceptable limits at all engine speeds.
Fig. 6Box plot of factor A against response (m/s2)
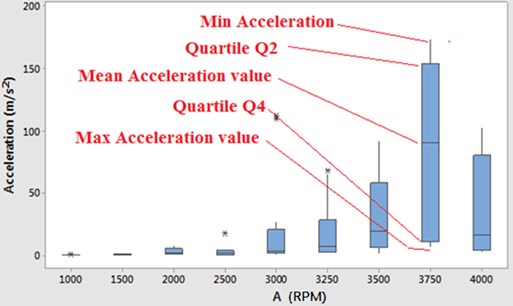
Fig. 7Box plot of factor B against response (m/s2)
5. Response surface methodology
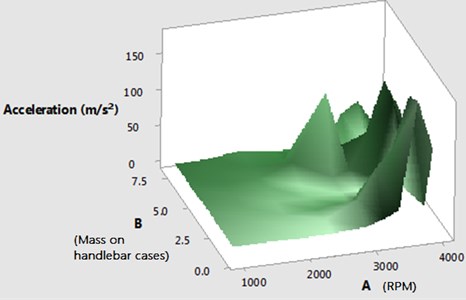
Response surface methodology is used to predict and optimize the response for the given state of controllable variables. Response surface methodology would help in selecting the levels of controllable variables that would give the desired response. Fig. 8 shows the contour plot of acceleration at different levels of speed and mass on handlebar. During the operation of motorcycle, it is difficult to maintain engine speed at one particular rpm. Contour plot gives the range of engine rpm which would give you desired acceleration at a particular mass on handlebar. This plot also gives the high acceleration regions to which an operator can avoid so as to remain unexposed to a high level of vibrations. The plot shows high acceleration zones at the engine rpm of 3750. But, if anyone selects mass on handlebar levels of 3 or 7, then even at 3750 engine rpm, the high vibration can be avoided. Apart from 3750 engine rpm, it shows high acceleration values at a combination of 3000 engine rpm and mass on handlebar level 6. This information helps rider immensely to avoid exposure to high vibrations. The same interpretation can be drawn from the surface plot as shown in Fig. 9.
Fig. 8Contour plot of acceleration (m/s2) vs B, A
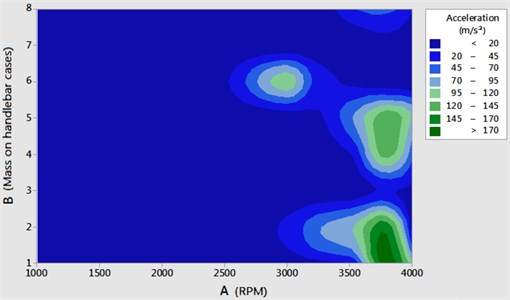
Fig. 9Surface plot of acceleration (m/s2) vs B, A
6. Conclusions
The study presents the successful implementation of Tuned Mass Damper (TMD) for attenuation of handlebar vibration in all the mentioned cases. Best results are obtained in case of HB + LSM in both with and without tuned mass damper. It is inferred that the location of the additional weight plays a crucial role in the vibration behaviour of the handlebar. The addition of weight at the ends of the handlebar would result in an increase of handlebar vibrations. It is observed that weight should be uniformly distributed over the span of the handlebar for attenuation of handlebar vibrations. From the study, it is also observed that the effect of TMD is substantially visible at higher engine RPMs. Hence proper modification of handlebar becomes imperial in case of high revving application. DOE result shows that both engine speed and handlebar mass are significantly contributing to the acceleration levels at the motorcycle handlebar. But out of the two, engine speed contributes more significantly to the vibration response than mass on handlebar. DOE also predicts the safe operating conditions for the rider so as to remain the HAV under acceptable limits.
References
-
Roseiro L. M., Neto M. A., Amaro A. M., Alcobia C. J., Paulino M. F. Hand-arm and whole-body vibrations induced in cross motorcycle and bicycle drivers. International Journal of Industrial Ergonomics. ASME Transactions, Vol. 56, 2016, p. 150-160.
-
Rui F., D’agostin F., Negro C., Bovenzi M. A prospective cohort study of manipulative dexterity in vibration-exposed workers. International Arch Occupational Environmental health, Vol. 81, 2008, p. 545-551.
-
Friden J. Vibration damage to the hand: clinical presentation, prognosis and length and severity of vibration required. Journal of Hand Surgery, Edinburgh Scotland, Vol. 26, 2001, p. 471-474.
-
Gerhardsson L., Hagberg M. Work ability in vibration-exposed workers. Occupational Medicine Oxford England, Vol. 64, 2014, p. 629-634.
-
ISO 2631-1. Mechanical Vibrations and Shock – Evaluation of Human Exposure to Whole Body Vibrations. Second Edition, 1997.
-
ISO 5349-1. Mechanical Vibration- Measurement and Evaluation of Human Exposure to Hand Transmitted Vibrations. Part 1: General Requirements, 2001.
-
ISO 5349-2. Mechanical Vibration- Measurement and Evaluation of Human Exposure to Hand Transmitted Vibrations. Part 2: Practical Guidance for Measurement at the Workplace, 2002.
-
Sivakumar A., Tiwari A., Ragavendra G., Kolhe V. Elastomer blend for vibration isolators to meet vehicle key on – key off vibrations and durability. SAE Technical Paper, 2009.
-
Antonio J. N., Morales A. L., Chicharro J. M., Pintado P. An adaptive pneumatic suspension system for improving ride comfort and handling. Journal of Vibration and Control, Vol. 22, Issue 6, 2016, p. 1492-1503.
-
Sachin B., Patil R. J., Qaimi M. G. Hand arm vibration alleviation of motorcycle handlebar using particle damper. International Journal of Engineering and Manufacturing, Vol. 1, 2017, p. 26-40.
-
Ricardo M., Cardona J., Pintado P., Chicharro J. Predictors of whole body vibration exposure in motorcycle riders. Revista Facultad de Ingenieria-Universidad de Antioquia, Vol. 61, 2011, p. 93-103.
-
Tathawadekar P., Liu K. J., Rajan S., Johnson P. Application of tuned mass damper to address discrete excitation away from primary resonance frequency of a structure. SAE Technical Paper, 2009.
-
Barbetti M., Carvalho L., Calcada M. Vibration absorber application, case study: mid-size truck steering wheel vibration. SAE Technical Paper, 2017.
-
Lee P., Rahbar A. Active tuned absorber for displacement-on-demand vehicles. SAE Technical Paper, 2005.
-
Montgomery D. C. Design and Analysis of Experiments. Eighth edition, Wiley, 2014.
Cited by
About this article

