Abstract
In a period of ten years, from 2011-2020 rainfall in Indonesia is relatively high, with annual rainfall between 460.5-4,627.4 mm. The high rainfall has implications for flooding in several provinces. During this period, almost every year several areas in Banten Province experienced floods. To predict areas of Banten Province that have the potential for flooding, forecasts of rainfall and the potential for repeated occurrences of high rainfall are carried out. In making the forecast, observations were made at the Serang Meteorological Station, the Budiarto Curug Meteorological Station, the South Tangerang Climatology Station, and the Tangerang Geophysics Station. Rainfall data from the four stations were analyzed by Fourier transform, Gumbel method and Mononobe method. Distribution analysis results obtained rainfall in Banten Province between 0.0-607.9 mm with the length of rainy days per month between 0-26 days. Then, the results of the Fourier transform analysis; Banten Province included a monsoon rain pattern with unimodial rainfall. Furthermore, the results of the analysis of the Gumbel method and the Mononobe method, Banten Province included the category of moderate rain and tended to be heavy, even extreme. Based on the results of the analysis using these two methods, in 2025 in Banten Province, it is predicted that 11 % heavy rain, 3 % very heavy rain and 1 % extreme rain are predicted. In that year, it is predicted that there will be 65 sub-districts in Banten Province that have the potential for flooding. The sub-districts that have the potential for flooding are mostly located in Serang Regency, Serang City, Tangerang City, and South Tangerang City. This potential flood is predicted to occur in: January, February, March, April, May, October and November.
Highlights
- Monthly rainfall for four BMKG stations in Banten Province
- Rainfall trends in Banten Province
- Forecasting rainfall intensity in Banten Province
- Districts that have the potential for flooding in Banten Province
1. Introduction
Topographically, Indonesia is an archipelagic country surrounded by seas and oceans. These conditions affect the nature of the climate, so that the nature of the climate in Indonesia is generally humid and brings rain. Rainfall in Indonesia is high, with annual rainfall between 460.5-4,627.4 mm [1]. The high rainfall is assumed to have implications for the potential for flooding. Indonesia there are 19,675 villages affected by floods, the number of villages affected by flooding is between 76-2.209 villages, the highest is Aceh Province and the lowest is Riau Islands [1]. Meanwhile, Banten Province with 1,238 villages affected by flooding was 501 villages [2]. In general, flooding occurred in some of these areas, due to high rainfall. Therefore, to detect areas that have the potential to flood, it is necessary to carry out early protection, including by forecasting rainfall.
Rainfall forecasting is done to predict rain based on weather predictions. Rainfall forecasting is needed to predict the amount of rainfall in the future, prevent and assist in flood forecasting [3]. In forecasting rainfall, several methods are needed, including: Autoregressive Integrated Moving Average (ARIMA), Adaptive Neuro Fuzzy Inference System (ANFIS) and Wavelet methods. However, in its application the three methods only reach 60-70 %. According to the Meteorology, Climatology and Geophysics Agency (BMKG), this level of accuracy is caused by the changing state of the atmospheric pattern (https://www.bmkg.go.id/iklim/dinamika-atmosfir.bmkg). The prediction rainfall using data development techniques, with the data pattern obtained three categories, namely: low, medium, and heavy rain [4]. Then, the rainfall is predicted by using multiple linear regression model, the model is able to predict the annual rainfall in Cuttack District, Odisha, India [5]. Furthermore, rainfall is predicted using the Fourier series, with this series high accuracy is obtained [6]. In predicting rainfall, it is done by comparing the Fast Fourier Transformation (FFT), ARIMA and Artificial Neural Network (ANN) methods [7]. Rainfall prediction using the Fourier series and FFT methods has advantages in studying the pattern of rain distribution. Referring to the characteristics of each forecasting method, forecasting analysis with data patterns is more potential to use Fourier analysis. Through this analysis, the pattern of rainfall data obtained from a station can be identified the wettest and driest time periods [8]. By knowing the period, the trend of rainfall at each station with a certain area of observation can be analyzed.
To detect areas that have the potential for flooding, forecasting and analysis of rainfall in an area is necessary. Analysis of rainfall related to an area, including predicts monthly rainfall in Kalimantan by applying an Artificial Neural Network (ANN), rainfall data is tested using a two-hidden layer [9]. Furthermore, forecasted rainfall using the Holt-Winters Exponential Smoothing method, with the model it was found that rainfall in Ambon City showed an increasing trend [10]. Meanwhile, rainfall forecasts in Banten Province include detecting the distribution of rainfall in the Tangerang Regency area using the Thiessen Polygon method. With this method, we get areas that have high, medium, and low rainfall intensity [11].
Referring to the number of areas affected by flooding in Banten Province, it is necessary to forecast repeated rainfall events. Rainfall using the Gumbel method is more potential, when compared to the Log Pearson Type III and Iway Kadoya methods [12]. The comparison of rainfall isohyet patterns between the Log Pearson Type III and Iway Kadoya methods has similarities when compared to the Gumbel method. The three methods predict repeated rainfall based on data patterns. Referring to the several methods above, the data patterns in this study were analyzed using the Fourier transform, while to predict the flood area an analysis of high rainfall intensity was carried out.
2. Literature review
Rainfall is the amount of rainwater that falls over a certain period of time assuming no infiltration, run-off, or evaporation. The trend of rainfall fraction is a comparison of certain rainfall compared to rainy days [13]. The trend of the rainfall fraction consists of three categories, namely rain with an intensity of 20, 50, 100, and 150 mm/day [14]. Rainfall intensity ranges between: 0.5-20 mm/day is called light rain, 20-50 mm/day is called moderate rain, 50-100 mm/day is called heavy rain, 100-150 mm/day is very heavy rain, and extreme rain, if rainfall > 150 mm/day [15]-[17]. The intensity of rainfall in an area is directly proportional to time, the longer the rain lasts the higher the intensity, and vice versa. Meanwhile, the trend of the rain fraction is directly proportional to climatic conditions, while climatic conditions are one that affects the high rainfall in an area.
Rainfall in each province in Indonesia is different, depending on the climatic conditions in the province. In a period of 10 years from 2011-2020 the annual rainfall in Indonesia is between 460.5-4,627.4 mm with the number of rainy days between 68-257 days. The highest rainfall occurred in West Sumatra in 2013 and the smallest rainfall occurred in Central Sulawesi in 2015 [1]. Meanwhile, referring to the length of rainy days, almost 70 % of the territory of Indonesia in a year experiences rain. The high annual rainfall and the length of rainy days in a year have implications for the high intensity of annual rainfall. The high intensity and length of rainy days are assumed to have implications for flooding. Referring to the high annual rainfall and the length of rainy days, there are several provinces that experience flooding. During that period, out of 37 provinces in Indonesia, 33 provinces were affected by floods. During that period, nearly 89 % of Indonesia's territory was hit by floods. Provinces that frequently experience flooding are: East Java, Central Java, West Java, Aceh, and South Sumatra [2]. Meanwhile, in a period of six years, from 2015-2021 in the Indonesian region, flood events occurred between 481-1,138. The highest flood occurred in 2020 and the lowest in 2021 [1].
In the same period, for a period of 10 years, Banten Province has an annual rainfall of 1.141-3,573 mm with a number of rainy days between 155-206 days [1], [18]. During this period, both rainfall and the length of rainy days in Banten Province increased. According to the Central Statistics Agency of Banten Province the increase occurred within a period of three years, from 2018-2020 [18]. During that period, the number of rainy days in Banten Province occurred between 42.4-56.4 %. Therefore, almost 60 % within one year Banten Province experiences rain. The high rainfall and the length of rainy days in Banten Province, there are several areas that experience flooding. The results of research using remote sensing systems through Geographic Information Systems (GIS) and field surveys, flood disaster in Banten Province covers an area of 88,082.99 hectares (ha) [19]. In 2012 based on the analysis and field survey, only 10 % of the area in Banten Province was affected by flooding. However, due to increased rainfall and the length of rainy days, the area affected by flooding in Banten Province has increased. In Banten Province, there are 69 sub-districts in the Banten Province that have the potential for flooding. The distribution of these sub-districts is as follows: Serang Regency as many as 21 sub-districts, Tangerang Regency as many as 6 sub-districts, Pandeglang Regency as many as 10 sub-districts, Lebak Regency as many as 5 sub-districts, Serang City as many as 4 sub-districts, Cilegon City 7 sub-districts, Tangerang City as many as 12 sub-districts, and There are 4 districts in South Tangerang City (https://bpbd.bantenprov.go.id/id/read/peta-bencana-gunung.html). Referring to data from Regional Disaster Management Agency (BPBD) Banten Province, almost 45 % of the area in Banten Province is prone to flooding. Based on the 2012 field survey and Banten Province BPBD data, flood-prone areas in Banten Province increased significantly. The increase in flood-prone areas is due to an increase in rainfall. An increase in rainfall has a positive impact on flood disasters [20].
Flood-prone areas in Indonesia in general and Banten Province in particular, are related to the local landscape, particularly land use and climatic features. The results of a spatial analysis based on a survey in 364 villages show that the frequency of flooding is associated with land use in the catchment area, including forest cover and condition, and area of wetlands [21]. The mechanism of rainfall and catchment characteristics forming the relationship between rainfall and the probability of flooding [22]. One of the causes of flooding is seasonal shifts and unpredictable rain patterns. Rainfall varies over a long period of time, resulting in different flood hydrographies [23]. To find out the rainfall and the length of rainy days as well as the potential for repeated events, forecasting is necessary.
Forecasting is generally done by time series analysis, so it is used for modeling. With this series, information is obtained about cyclical trends or fluctuations around the long-term average value. In analyzing weather and climate problems, there are three models, namely: deterministic, stochastic and parametric models. The deterministic model is based on physical processes or the relationship of several components in the atmosphere, land and ocean systems. Stochastic models or statistical models, are used for forecasting monthly rainfall. By using monthly rainfall data, the output with a certain statistical pattern is obtained [24]. Meanwhile, the parametric model is a combination of deterministic and stochastic models. In the stochastic model, there are several methods used to calculate rainfall, including: arithmetic method, polygon, and comparison method [25], [26]. These three methods function for forecasting rainfall in an area.
Forecasting of rainfall in an area has been widely carried out by researchers, including forecasting the distribution of rainfall for a certain period in areas that do not have rainfall data [27]. Then, the other researchers use the Thiessen polygon method to analyze rainfall in an area. The method GIS-based Thiessen polygon is used to analyze rainfall in Makassar City [28]. The Thiessen method is determined by making polygons between rain posts in an area. To predict the rainfall in an area, Fourier analysis is needed, while to know the repeated occurrence of high rainfall, Gumbel analysis is needed. Analysis with Fourier transform can be used to convert data from the time dimension to the frequency dimension [29]. By knowing the frequency of rainfall in an area, it can be analyzed and forecasted repeated occurrences of rainfall in that area. To determine the repeated rainfall in an area, the Gumbel distribution method is used.
3. Research method
To find out the potential for flooding in an area in Banten Province, forecasting of high rainfall is carried out. In forecasting rainfall in Banten Province, 10 years of rainfall data are used, from 2011-2020. The data was obtained from several BMKG stations in the Banten Province. This study uses observation stations: Serang Meteorological Station, Budiarto Curug Meteorological Station, South Tangerang Climatology Station, and Tangerang Geophysics Station. Forecasting is carried out with three stages of analysis as follows: rainfall patterns and trends, repeated occurrences of high rainfall, and rainfall intensity.
Fourier analysis is used to change the pattern and trend of rainfall, while to change the data pattern from the time dimension to the frequency dimension, Fourier transform is used. The equations used are as follows [30]:
with and , , is the coefficient analyzed by using the equation:
The data pattern obtained by Eq. (1) is used as the basis for forecasting the potential for repeated occurrences of high rainfall. Analysis of repeated occurrences of high rainfall, the Gumbel method is used with the following equation [31]:
where is the planned rainfall for the -year measurement data, is the average rainfall, is the standard deviation, is the standard deviation of the variate reduction, is the variate reduction value, and is the average value of the variate reduction. Meanwhile, is the rainfall at the Serang Meteorological observation station, is the rainfall at the Budiartp Curug Meteorological observation station, is the rainfall at the South Tangerang Climatology observation station, and is the rainfall at the Tangerang Geophysical observation station, and is the number of observation stations.
Forecasting repeated occurrences of high rainfall obtained by Eq. (2), followed by forecasting the intensity of rainfall. In predicting the intensity, the Mononobe rainfall intensity formula is used, with the following equation [32]:
where is the maximum daily rainfall in 24 hours (mm/hour) and t is the duration of rain (hours), while is the intensity of rain (mm/hour). To estimate areas with potential for flooding, the results of the equation analysis are then compiled with flood-prone data from the BPBD of Banten Province.
4. Results and discussion
4.1. Forecasting rainfall in the province of Banten, Indonesia
To predict rainfall and the potential for repeated occurrences of high rainfall, observations were carried out for 10 years, from 2011-2020. Observations were made at several stations in the province of Banten. The results of the compilation of monthly average rainfall data in Banten Province are shown in Table 1.
Table 1Banten province average monthly rainfall over 10 years
Month | Average rainfall per month (mm) | |||||||||
2011 | 2012 | 2013 | 2014 | 2015 | 2016 | 2017 | 2018 | 2019 | 2020 | |
January | 322.0 | 243.0 | 302.0 | 424.0 | 377.0 | 360.9 | 183.0 | 239.6 | 148.6 | 282.0 |
February | 195.0 | 91.0 | 191.0 | 212.0 | 212.0 | 254.9 | 313.2 | 391.7 | 273.2 | 158.8 |
March | 166.0 | 204.0 | 91.0 | 224.0 | 103.0 | 305.0 | 142.4 | 436.3 | 228.9 | 145.3 |
April | 72.0 | 107.0 | 184.0 | 104.0 | 72.0 | 160.7 | 302.6 | 331.7 | 303.6 | 383.8 |
May | 113.0 | 85.0 | 98.0 | 261.0 | 113.0 | 129.9 | 252.6 | 145.4 | 93.6 | 173.1 |
June | 167.0 | 38.0 | 36.0 | 60.0 | 65.0 | 53.7 | 289.8 | 106.3 | 83.2 | 105.2 |
July | 20.8 | 79.0 | 16.0 | 24.4 | 23.2 | 0.0 | 29.6 | 13.0 | 1.8 | 3.8 |
August | 12.3 | 0.0 | 0.0 | 12.2 | 10.0 | 9.7 | 33.3 | 15.8 | 5.0 | 8.4 |
September | 32.8 | 32.0 | 7.0 | 35.0 | 22.0 | 2.0 | 28.3 | 21.2 | 56.1 | 0.0 |
October | 186.0 | 71.0 | 126.0 | 84.0 | 21.0 | 10.0 | 272.9 | 284.8 | 114.0 | 45.1 |
November | 148.0 | 79.0 | 51.0 | 141.9 | 155.0 | 100.5 | 359.4 | 359.7 | 182.2 | 108.9 |
December | 109.0 | 112.0 | 95.0 | 384.0 | 139.0 | 72.8 | 103.8 | 234.4 | 199.7 | 192.5 |
Based on the table, it appears that the monthly average rainfall in Banten Province is between 0.0-436.3 mm. During this period, high rainfall occurs in January, while low rainfall occurs in July, August and September. High rainfall occurred in 2018 while low rainfall occurred in 2012, 2013, 2016 and 2020. During a period of 10 years, between the first and second five-year periods there was an increase in rainfall. In the first five-year period, from 2011-2015 the monthly rainfall in Banten Province was between: 0.0-424.0 mm. In that period, the monthly rainfall is between: 0.0-100.0 mm by 50 %, the monthly rainfall between: 100.0-300.0 mm is 40 %, and the monthly rainfall is between 300.0-500.0 mm by 10 %. Meanwhile, in the second five years, from 2016-2020 the monthly rainfall is between: 0.0-436.3 mm. In the second five-year period, the monthly rainfall is between: 0.0-100.0 mm by 40 %, the monthly rainfall between: 100.0-300.0 mm is 50 %, and the monthly rainfall is between 300.0-500.0 mm by 20 %. According to the BMKG, monthly rainfall is divided into four categories, namely: low category, between: 0.0-100.0 mm, medium category, between: 100.0-300.0 mm, and high category, between: 300.0-500.0 mm, and very high category, greater than 500 mm (https://bmkgsampali.net/normal-rain-bulan/). Referring to this category, in the first five-year period, in general, the monthly rainfall in Banten Province is in the low and medium categories. However, in the second five-year period, monthly rainfall is in the medium category and tends to be high. The category of high rainfall occurs from November to April with an average monthly rainfall of 302.6-436.3 mm. Meanwhile, low rainfall occurs from July to September with an average monthly rainfall of 0.0-79.0 mm.
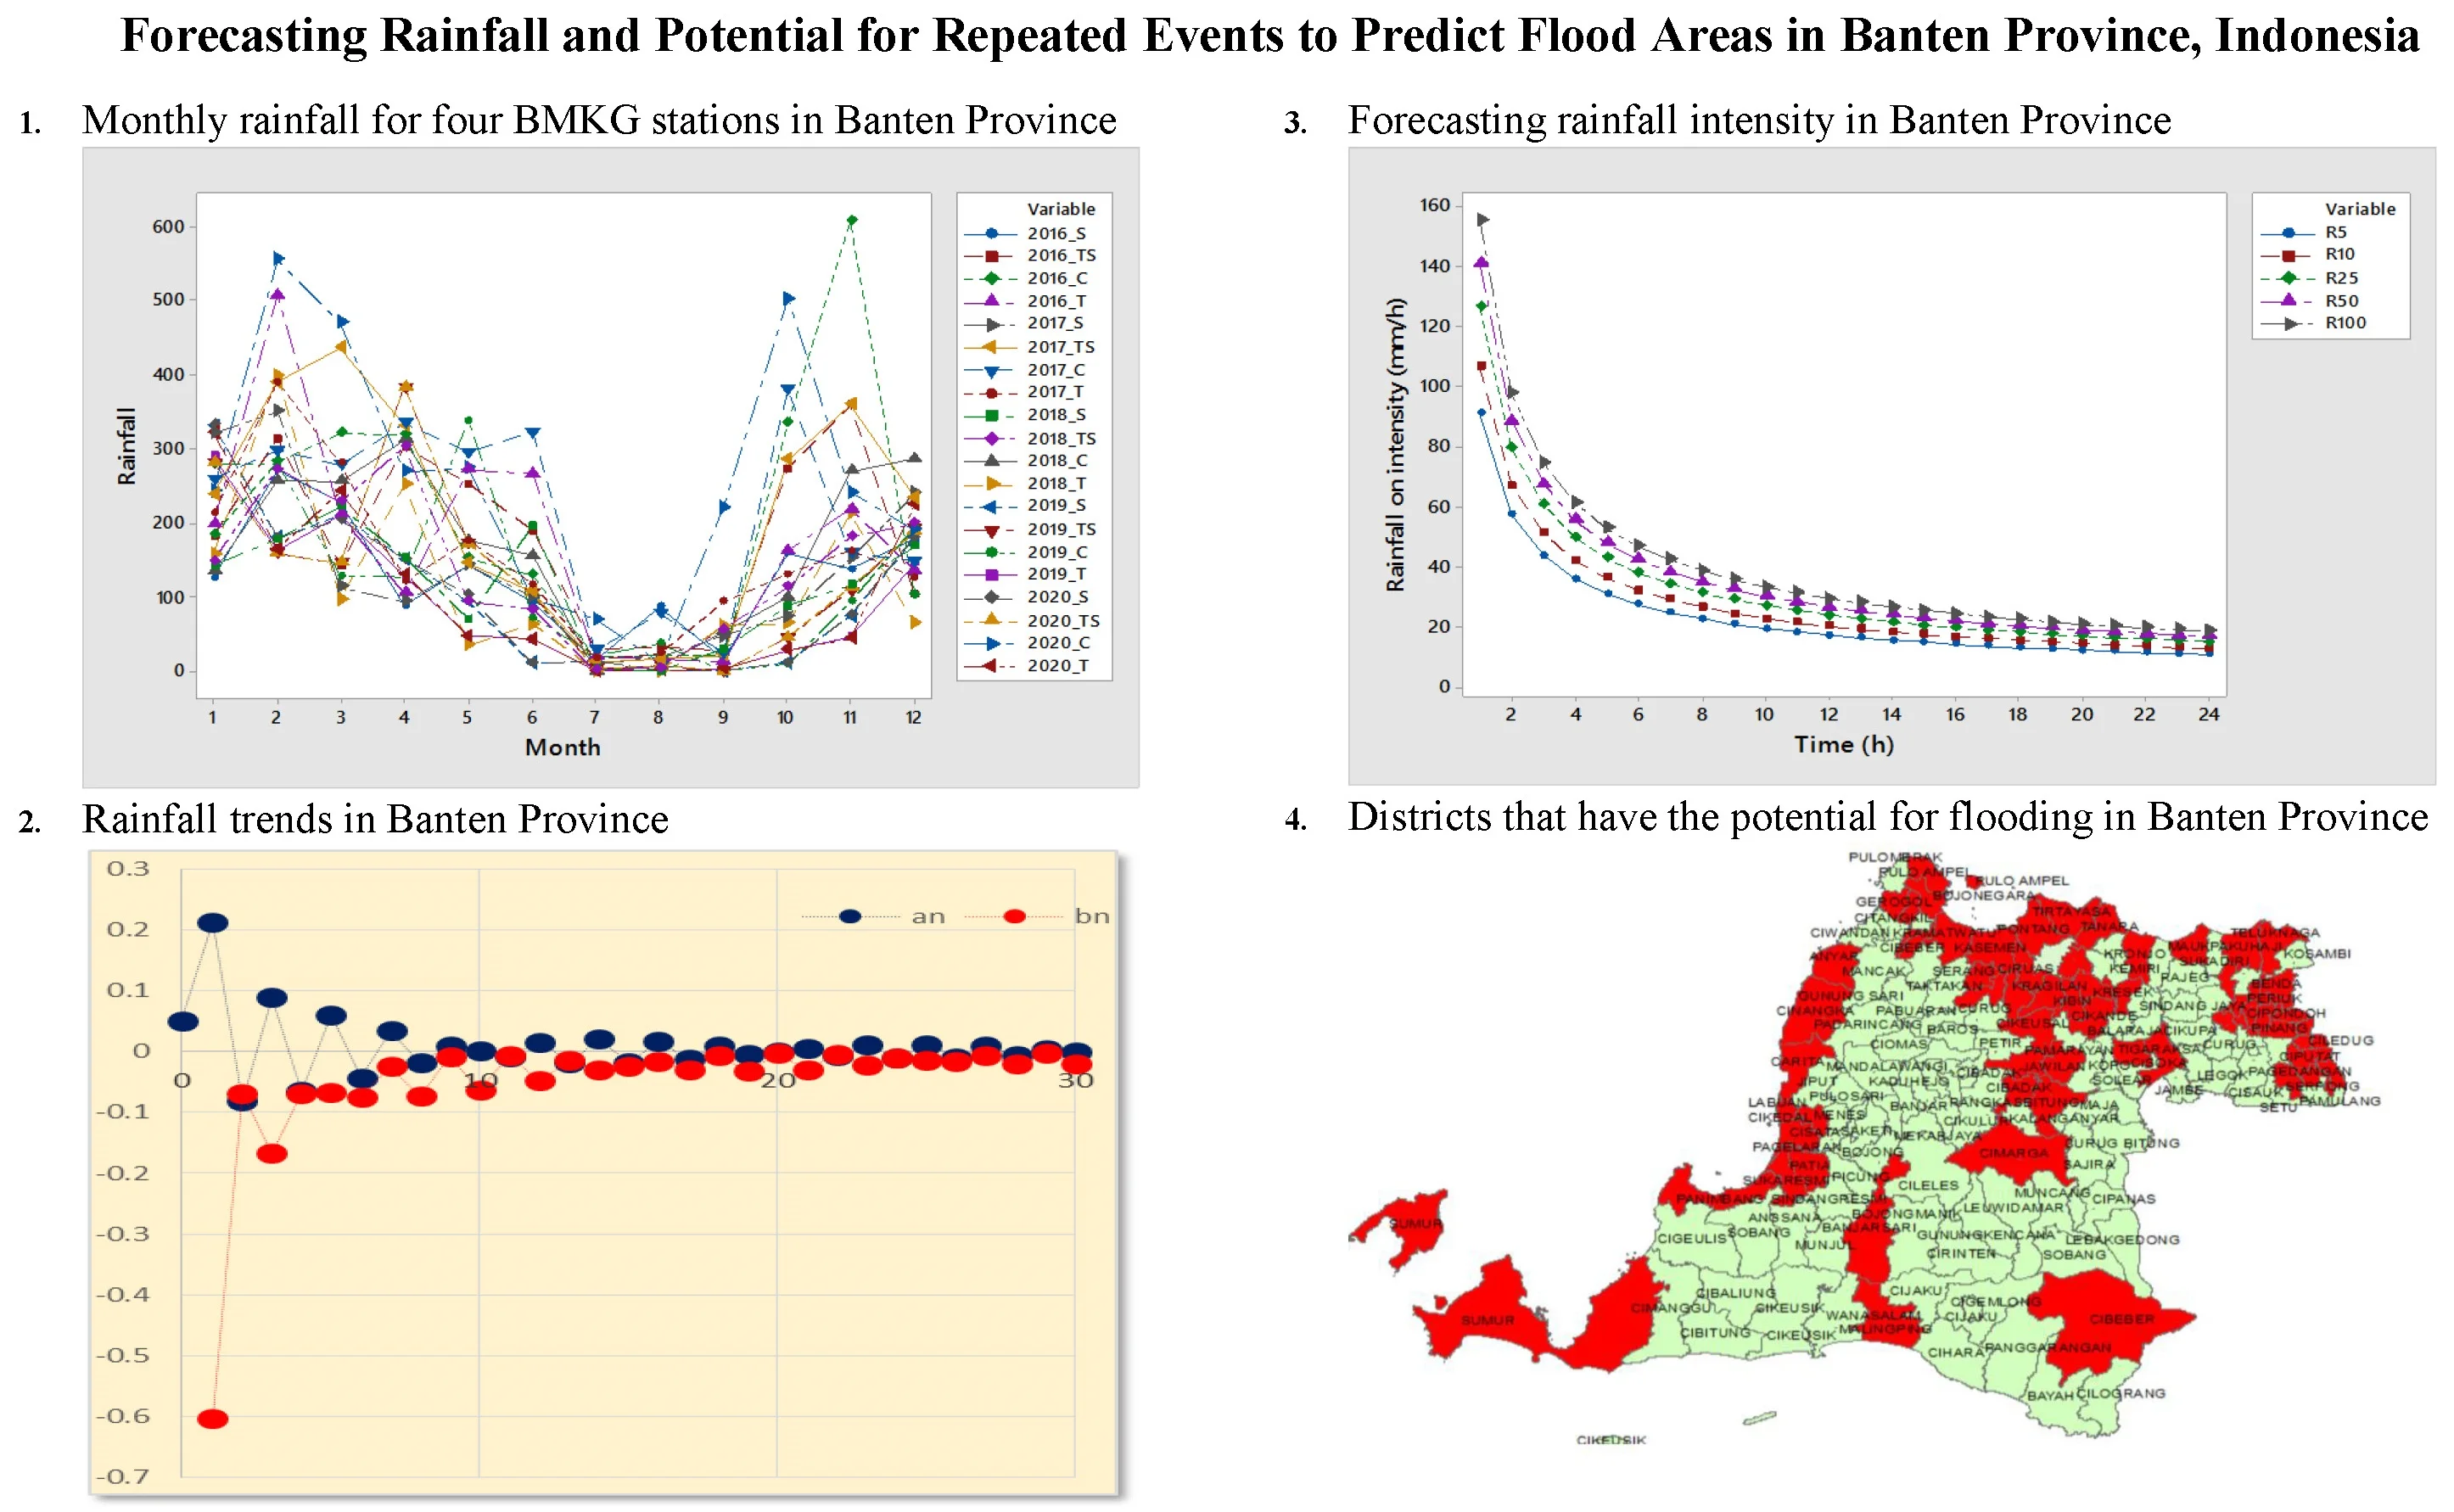
An increase in rainfall in the second five-year period was observed at four stations in the Banten Province. Observations were made at the Serang Meteorological Station, the Budiarto Curug Meteorological Station, the South Tangerang Climatology Station, and the Tangerang Geophysics Station. The results of observations of monthly rainfall from 2016-2020 at the four stations are shown in Fig. 1.
Fig. 1Monthly rainfall for four BMKG stations in Banten province
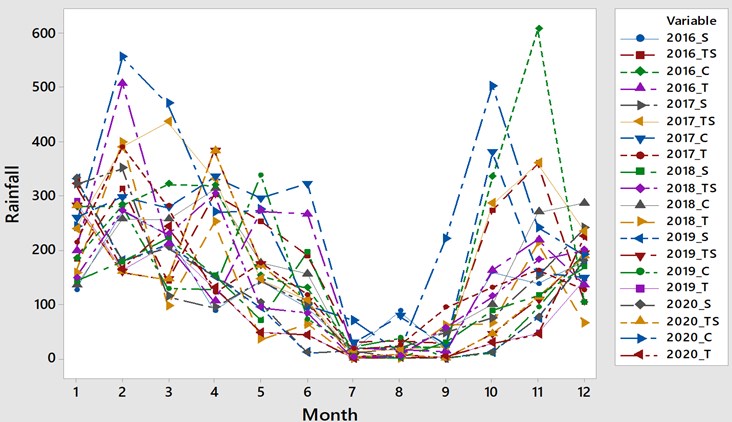
Based on this figure, the results of observations at the Serang Meteorological Station, monthly rainfall is between 0.0-351.1 mm. Rainfall in the low and medium categories is 47 %, the high category is 7 %. The high category of rainfall occurs in January and February, while the low rainfall occurs from July to September.
Based on observations at the station, in Serang Regency, Pandeglang Regency, several areas in Lebak Regency, Serang City and Cilegon City in January and February there was high rainfall. Meanwhile, the results of observations at the Budiarto Curug Meteorological Station, monthly rainfall is between: 0.0-607.9 mm. Rainfall in the low category is 32 %, the middle category is 48 %, the high category is 15 %, and the very high category is 5 %. Very high rainfall occurs in February, October and November, while the high category of rainfall occurs in April and May. Based on observations at the station, in Tangerang Regency, there is high rainfall and tends to be very high. Then, the results of observations at the South Tangerang Climatology Station, monthly rainfall between: 0.0-436.3 mm. Rainfall in the low category is 32 %, the medium category is 52 % and the high category is 17 %. Rainfall with a high category occurs in March, April and November. Based on observations at the station, in South Tangerang City, in that month there was high rainfall. Furthermore, the results of observations at the Tangerang Geophysics Station, monthly rainfall between: 0.0-507.6 mm. Low and medium rainfall is 47 %, high category is 5 % and very high category is 2 %. Rainfall with high and very high categories occurs in February. Based on the results of observations at the station, in Tangerang City, in that month there was high rainfall and tended to be very high. Referring to the results of observations of four stations, it shows that rainfall in Banten Province is generally in the medium category and tends to be very high. Rainfall with very high category occurs in February, October and November. Based on the results of observations at four stations, it shows different categories of rainfall. However, the category of high and very high rainfall generally occurs in February and November. Therefore, to explore the rain discharge in this category, an analysis of the length of the rainy day was carried out.
The results of observations of rainy days at four stations, the length of rainy days per month in Banten Province is different. The results of observations at the Serang Meteorological Station, the length of rainy days per month is between 0-25 days. The largest number of rainy days occurs in January, while the smallest occurs in September. Meanwhile, the results of observations at the Budiarto Curug Meteorological Station, the length of rainy days per month is between 7-26 days. The largest number of rainy days occurs in December, while the smallest occurs in September. Then, the results of observations at the South Tangerang Climatology Station obtained the length of rainy days per month between 0-24 days. The largest number of rainy days occurs in December, while the smallest occurs in September. Furthermore, the results of observations at the Tangerang Geophysics Station, the length of rainy days per month is between 1-24 days. The largest number of rainy days occurs in January, while the smallest occurs in July and August. There are differences in the category of rainfall and the length of rainy days in each month, an analysis of data patterns is carried out to obtain patterns and trends of rainfall in Banten Province.
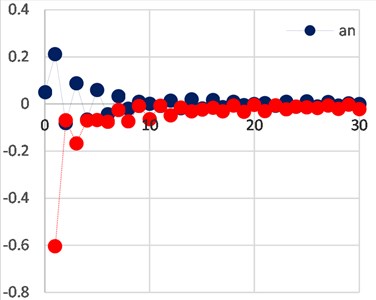
To obtain the pattern and trend of rainfall, the Fourier transform is used. With this transformation, the pattern of rainfall data is changed from the time dimension to the frequency dimension. The results of the analysis using Eq. (1) are shown in Fig. 2.
Fig. 2Rainfall patterns and trends in Banten province
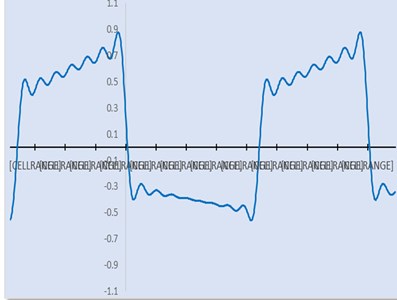
a) Rainfall pattern
b) Rainfal trend
In Fig. 2(a) over a five year period, from 2016-2020 the rainfall pattern in Banten Province is almost normal, but tends to increase. Under normal conditions, in general the category of rainfall in Banten Province is included in the category of medium rainfall, and tends to increase to the very high category. There is an increase in rainfall, from the medium to high rainfall category, and from the high to very high category, a trend analysis is carried out. The results of the analysis of rainfall trends in Banten Province are shown in Fig. 2(b). Fig. 2(b) shows that during this period, rainfall in Banten Province increased. In January and February 2020, the rainfall in Banten Province increased by 31 %.
In Banten Province, the category of medium rainfall is between: 100.8-290.2 mm, high rainfall is between: 302.6-436.3 mm, and very high rainfall is between: 503.0-607.9 mm with the length of rainy days between 0-26 per month. In a five-year period, from 2016-2020 the medium rainfall category increased from 46.7-48.3 % the high rainfall category increased from 5-15 % and the very high rainfall category increased from 1.6-5.0 %. In Banten Province, the very high category occurred in February, October and November, while the low and low rainfall category occurred in July, August and September. Based on the results of the analysis, the rainfall pattern in Banten Province shows a monsoon pattern, with unimodial rainfall. In general, in Banten Province the wet months occur in January and February, while the dry season occurs in July, August and September. This is in accordance with the results of Hermawan which grouped rainfall in several areas using spectral techniques. Based on the pattern and trend of increasing rainfall, Banten Province has the potential for extreme rain [33]. Referring to the trend of increasing rainfall, extreme rain is forecasted in February. This is in accordance with the forecasting results of Djuraidah et al. which forecasts extreme rainfall in Banten Province with extreme spatial models. To experience the pattern and trend of rainfall, then an analysis of the potential for recurring events is carried out [34].
The potential for repeated occurrences of high rainfall is analyzed using Eq. (2). Referring to the data in Table 1 above, the average annual rainfall is 1680.82 mm with a standard deviation of 473.89. The results of the analysis of the potential for repeated occurrences of high rainfall in Banten Province are shown in Table 2.
Table 2The results of the analysis of repeated occurrences of high rainfall
Repeated period (year) | Frequancy factor () | Rainfall plan () mm | |||||
2 | 0.9496 | 0.4952 | 0.3665 | –0.1355 | 1,680.8210 | 473.8980 | 1,616.5933 |
5 | 0.9496 | 0.4952 | 1.4999 | 1.05802 | 1,680.8210 | 473.8980 | 2,182.2166 |
10 | 0.9496 | 0.4952 | 2.2502 | 1.84815 | 1,680.8210 | 473.8980 | 2,556.6539 |
25 | 0.9496 | 0.4952 | 3.1985 | 2.84678 | 1,680.8210 | 473.8980 | 3,029.9032 |
50 | 0.9496 | 0.4952 | 3.9019 | 3.58751 | 1,680.8210 | 473.8980 | 3,380.9350 |
100 | 0.9496 | 0.4952 | 4.6001 | 4.32277 | 1,680.8210 | 473.8980 | 3,729.3718 |
Based on the table, it is found that repeated occurrences of high rainfall within the next 2 to 100 years. High rainfall in Banten Province in the next 2 years, it is predicted that the average rainfall will decrease by 4 %. However, in the next 5-100 years, it is forecasted that the annual average rainfall will increase to 52 %. Referring to the results of observations in 2020, the maximum rainfall in February is 555.7 mm. The results of the analysis of repeated events, the maximum rainfall for that month were 533.5 mm. The results of BMKG observations in that month, rainfall in Banten Province was 387.5 mm. referring to the results of these forecasts and observations, it shows that the results of forecasting recurring events using the Gumbel method are 73 %. Referring to the results of the repeated occurrence of high rainfall events, then an analysis of the intensity of rainfall is carried out.
By knowing the intensity of rainfall, the category of rain in Banten Province will be obtained. The results of the analysis of high rainfall intensity within 24 hours are shown in Fig. 3.
Fig. 3Forecasting rainfall intensity in Banten Province
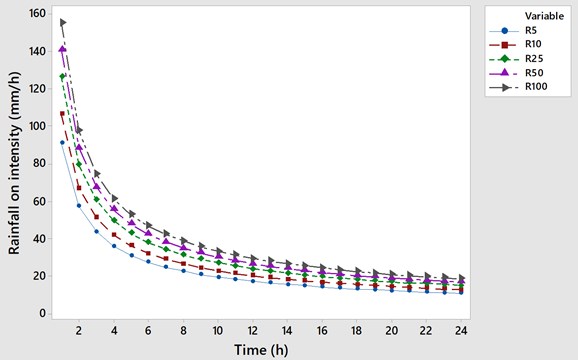
Based on this figure, it appears that the intensity of rainfall in Banten Province is between: 10.81-155.39 mm/hour. According to the BMKG, the rain category consists of: light rain with intensity between: 0.5-20.0 mm/hour, moderate rain with intensity between: 20.0-50 mm/hour, heavy rain category with intensity between: 50-100 mm/hour, very heavy rain with intensity between: 100-150 mm, and extreme rain with rainfall intensity greater than 150 mm (https://www.bmkg.go.id/cuaca/probabilistik-curah-hujan.bmkg). The results of the analysis of rainfall intensity and rain categories, the categories of rain in Banten Province are as follows: light rain of 38 %, moderate rain of 48 %, heavy rain of 11 %, very heavy rain category of 3 % and extreme rain category of 1 %.
Based on this percentage, the majority of rain in Banten Province is in the category of moderate rain, and has the potential for extreme rain. Referring to the category of rainfall and category of rain, in Banten Province heavy rains are forecasted in January, March, April, and May. Meanwhile, referring to the trend of increasing rainfall, it is predicted that in February and November there will be very heavy rains, with the potential for extreme rains to occur. Then, referring to the results of the analysis of the percentage of rainfall intensity and in the category of heavy to extreme rain, in Banten Province it is predicted that flooding will occur. This is in accordance with the results of research by Faradiba who conducted an analysis of rainfall and flood potential using the Mononobe method [35].
4.2. Forecasting flood areas in banten province, Indonesia
Floods are one of the categories of natural disasters that occur during the rainy season. In general, floods occur due to high rainfall, and can also occur due to blockages in river flow. Flooding is a condition where water cannot be accommodated in the sewer or the flow of water in the sewer is obstructed, so that it overflows and inundates the surrounding area [36]. The high rainfall and rainfall intensity in Banten Province have implications for the occurrence of floods in several areas. The results of the compilation of data patterns for 10 years from 2011-2020 at four BMKG stations and the results of the analysis of high rainfall intensity and flood data for that period are shown in Table 3.
Table 3The results of the analysis of high rainfall and flooding in Banten province
No. | Year | Station | Maximum rain Rata-rata (mm) | Flooding months | |||
Serang | South Tang | Curug | Tangerang | ||||
1 | 2011 | 243.0 | 329.0 | 318.6 | 234.9 | 281.38 | Jan, Apr, Nov |
2 | 2012 | 302.0 | 397.0 | 413.9 | 249.2 | 340.53 | Jan, Apr |
3 | 2013 | 424.0 | 592.0 | 457.8 | 334.1 | 451.98 | Jan, Feb, Dec |
4 | 2014 | 377.0 | 291.0 | 450.0 | 682.4 | 450.10 | Jan, March |
5 | 2015 | 362.7 | 360.9 | 427.0 | 390.0 | 385.15 | Jan, Feb |
6 | 2016 | 271.9 | 359.4 | 335.0 | 507.6 | 368.48 | Feb, Oct, Nov |
7 | 2017 | 351.1 | 436.3 | 380.2 | 390.4 | 389.50 | Feb, March, Oct |
8 | 2018 | 222.2 | 303.6 | 286.8 | 398.9 | 302.88 | Feb, March, Apr, Dec |
9 | 2019 | 331.7 | 383.8 | 337.9 | 290.2 | 335.90 | Jan, Apr, May |
10 | 2020 | 332.5 | 383.8 | 555.7 | 321.2 | 398.30 | Jan, Feb, Apr |
Based on Table 3 above, it appears that within ten years from 2011-2020 the average maximum rainfall per year in Banten Province is in the range between: 281.38-451.98 mm. The largest rainfall occurred in 2013 and the smallest rainfall occurred in 2011. In 2011 and 2013, high rainfall was observed in the observation area of South Tangerang Station and Budiarto Curug Station. The results of observations of rainfall at four stations show that in January, February, March, April, May, October, November and December in Banten Province there is rainfall with high and very high rainfall categories. Then, referring to the results of observations of the length of rainy days, from the four stations observed, it shows that the longest rainy days occur in January and December. Furthermore, the results of observations of the length of rainy days at the four stations showed that in December and January for 50 days or 81 % it rained. With the category of high rainfall and the length of rainy days, in that month, several areas in Banten Province have the potential for flooding.
Within ten years from 2011-2020, the trend of flooding in Banten Province occurred from October to May of the following year. Based on data from BNPB in Banten Province during the rainy season, there were 125 sub-districts that were affected by flooding [36]. The largest number of sub-districts affected by flooding is Lebak Regency as many as 28 sub-districts, while the smallest is Serang City as many as 3 sub-districts. Then, in 2019 there were 501 sub-districts/villages that were affected by floods [2]. Based on flood data from 2016-2020, almost all districts/cities in Banten Province experienced flooding. In that period, the districts most affected by flooding were Serang Regency with 88 villages and Cilegon City with 24 villages. Floods in each district/city occur on average in January, February, March, and November. However, there are certain regencies/cities, namely Lebak, Serang and Cilegon regencies where floods occur in April, May, and June [2].
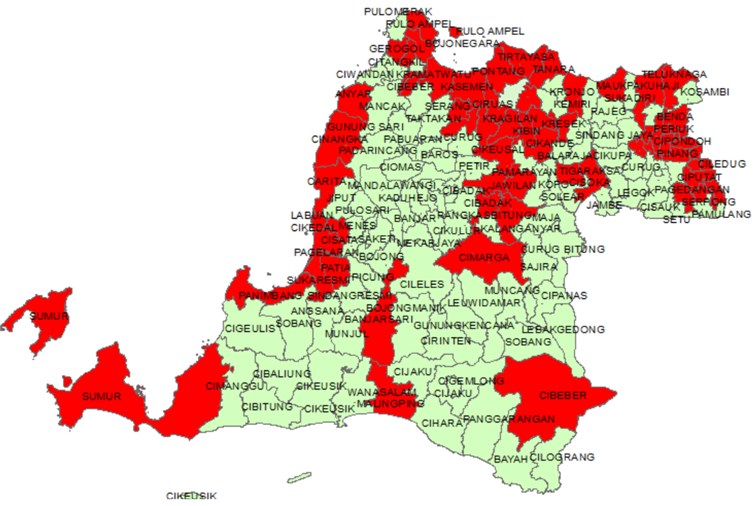
Referring to the results of the analysis of rainfall intensity and rain categories, Banten Province has a variety of rainfall and tends to be very high. The results of the analysis of rainfall intensity, it is predicted that in 2025 the rain category in Banten Province is in the moderate category and tends to be extreme. In that year, it is predicted that the category in Banten Province will reach 63 %. From this percentage, 48 % moderate rain, 11 % heavy rain, 3 % very heavy rain and 1 % extreme rain. However, because the length of rainy days can reach 24-26 days, it is predicted that flooding will occur in several sub-districts. Then, referring to the trend of increasing rainfall, flooding is predicted to occur in: January, February, March, April, May, October and November. Referring to the observation range of four stations, in 2025 it is predicted that several sub-districts in Banten Province have the potential for flooding. In that year, it is predicted that there will be 65 sub-districts or around 42 % of Banten Province with the potential for flooding. The regencies/cities that are predicted to have more than 50 % potential for flooding are: Serang Regency, Serang City, Tangerang City, and South Tangerang City. The area with the largest percentage of potential flooding is Tangerang City. The results of forecasting, in the city it is predicted that there are 11 sub-districts that have the potential for flooding. The sub-districts that are predicted to be flooded in Banten Province are shown in Fig. 4.
Fig. 4Districts that have the potential for flooding in Banten province
5. Conclusions
The results of observations at the BMKG Station for 10 years from 2011-2020 monthly rainfall in Banten Province are in the range between 0.0-607.9 mm. In the first five-year period, the monthly rainfall in Banten Province is in the low and medium categories. However, in the second five-year period, monthly rainfall increases to the high category and tends to be very high. Rainfall with very high category occurs in February, October and November. Then, rainfall with a high category occurs in January and March, April and May. Meanwhile, the length of rainy days in Banten Province is between 0-26 days, with the largest number of rainy days in January, while the smallest in September.
The results of the analysis of rainfall patterns and trends, the rainfall pattern in Banten Province shows a monsoon rain pattern, with unimodial rainfall. Wet months occur in January and February, while the dry season occurs in July, August and September. Then, the result of trend analysis, rainfall in Banten Province shows an increase. An increase in rainfall is predicted to occur in February; in that month there is the potential for extreme rain to occur. Furthermore, the results of the analysis of rainfall intensity, the category of rain in Banten Province includes the category of moderate rain and tends to be heavy, even extreme. It is predicted that in the province of Banten in 2025 heavy rain will reach 11 %, very heavy 3 % and extreme rain 1 %. Based on the forecasting results, it is predicted that in Banten Province there will be flooding in several sub-districts. In that year, it is predicted that there will be 65 sub-districts or around 42 % of Banten Province with the potential for flooding. The regencies/cities that are predicted to have more than 50 % potential for flooding are: Serang Regency, Serang City, Tangerang City, and South Tangerang City. Floods in Banten Province are predicted to occur in: January, February, March, April, May, October and November.
References
-
“Statistical yearbook of Indonesia,” Statistik Indonesia, 2021.
-
Arsyad A. Iriansyah, “Rencana Nasional Penanggulangan Bencana 2020-2024,” Badan Nasional Penanggulangan Bencana, pp. 1–115, Jan. 2020.
-
W. M. Ridwan, M. Sapitang, A. Aziz, K. F. Kushiar, A. N. Ahmed, and A. El-Shafie, “Rainfall forecasting model using machine learning methods: Case study Terengganu, Malaysia,” Ain Shams Engineering Journal, Vol. 12, No. 2, pp. 1651–1663, Jun. 2021, https://doi.org/10.1016/j.asej.2020.09.011
-
J. Joseph and R. T. K., “Rainfall prediction using data mining techniques,” International Journal of Computer Applications, Vol. 83, No. 8, pp. 11–15, Dec. 2013, https://doi.org/10.5120/14467-2750
-
S. Swain, P. Patel, and S. Nandi, “A multiple linear regression model for precipitation forecasting over Cuttack district, Odisha, India,” in 2017 2nd International Conference for Convergence in Technology (I2CT), pp. 355–357, Apr. 2017, https://doi.org/10.1109/i2ct.2017.8226150
-
Nasser Rostam Afshar and Hedayat Fahmi, “Rainfall forecasting using Fourier Series,” Journal of Civil Engineering and Architecture, Vol. 6, No. 9, p. 2012, Sep. 2012, https://doi.org/10.17265/1934-7359/2012.09.019
-
D. Susilokarti, S. S. Arif, S. Susanto, and L. Sutiarso, “Comparation study on precipitation prediction using Fast Fourier Transformation (FFT), Autoregressive Integrated Moving Average (ARIMA) and Artificial Neural Network (ANN),” Journal Agritech, Vol. 35, No. 2, p. 241, Sep. 2015, https://doi.org/10.22146/agritech.9412
-
A. Norzaida, M. D. Zalina, and Y. Fadhilah, “Application of Fourier series in managing the seasonality of convective and monsoon rainfall,” Hydrological Sciences Journal, pp. 1–14, May 2016, https://doi.org/10.1080/02626667.2015.1062892
-
H. Mislan, S. Hardwinarto, and A. M. Sumaryono, “Rainfall monthly prediction based on Artificial Neural Network: A case study in Tenggarong Station, East Kalimantan – Indonesia,” Procedia Computer Science, Vol. 59, pp. 142–151, 2015, https://doi.org/10.1016/j.procs.2015.07.528
-
L. J. Sinay, T. Pentury, and D. Anakotta, “Peramalan Curah Hujan Di Kota Ambon Menggunakan metode holt-winters exponential smoothing,” BAREKENG: Jurnal Ilmu Matematika dan Terapan, Vol. 11, No. 2, pp. 101–108, Dec. 2017, https://doi.org/10.30598/barekengvol11iss2pp101-108
-
B. Kurniawan, Y. Ruhiat, and R. F. Septiyanto, “Penerapan metode Thiessen Polygon untuk mendeteksi sebaran curah hujan di Kabupaten Tangerang,” Proceedings of the Physics Education National Seminar, Vol. 2, No. 1, pp. 122–130, 2019.
-
I. Winarsih Basuki, and N. L. Adhyani, “Return period analyze maximum rainfall with three method,” Agromet, Vol. 23, No. 2, p. 76, Dec. 2009, https://doi.org/10.29244/j.agromet.23.2.76-92
-
P. Panusunan Simanjuntak and A. Safril, “Tren curah hujan dan suhu udara ekstrim masa depan (Periode 2021-2030) berdasarkan Representative Concentration Pathway (RCP) 4.5 di Kota Palu,” Jurnal Ilmu dan Inovasi Fisika, Vol. 4, No. 1, pp. 1–11, Feb. 2020, https://doi.org/10.24198/jiif.v4i1.23846
-
T. R. Maitsa, A. A. Kuntoro, and D. Septiadi, “Analisis tren perubahan intensitas hujan (Studi Kasus: Jakarta dan Bogor),” Jurnal Teknik Sipil, Vol. 28, No. 2, 2021, https://doi.org/10.5614/jts.2021.28.2.5
-
D. Peñarrocha, M. J. Estrela, and M. Millán, “Classification of daily rainfall patterns in a Mediterranean area with extreme intensity levels: the Valencia region,” International Journal of Climatology, Vol. 22, No. 6, pp. 677–695, May 2002, https://doi.org/10.1002/joc.747
-
R. S. S. Sudewi, A. Sasmito, and R. Kurniawan, “Identifikasi ambang batas curah hujan saat kejadian banjir di Jabodetabek: studi kasus banjir Jakarta Tanggal 09 Februari 2015,” Jurnal Meteorologi dan Geofisika, Vol. 16, No. 3, pp. 209–215, Dec. 2015, https://doi.org/10.31172/jmg.v16i3.315
-
World Meteorological Organization, International Journal of Bioclimatology Biometeorology, Vol. 3, No. 1, pp. 338–338, Dec. 1959, https://doi.org/10.1007/bf02268758
-
“Banten Province in Figures,” Banten Provincial Statistics Agency, 2021.
-
M. K. Soleman, F. Nurcahyani, and S. L. Munajati, “Pemetaan multirawan bencana di Provinsi Banten,” Globe Scientific Magazine, Vol. 14, No. 1, pp. 46–59, 2012.
-
F. Faradiba, “Determination of climate factors in flood and drought disaster in Indonesia using Instrumental Variable (IV) Methods,” Jurnal Ilmu Fisika | Universitas Andalas, Vol. 13, No. 1, pp. 54–61, Feb. 2021, https://doi.org/10.25077/jif.13.1.54-61.2021
-
J. A. Wells et al., “Rising floodwaters: Mapping impacts and perceptions of flooding in Indonesian Borneo,” Environmental Research Letters, Vol. 11, No. 6, p. 064016, Jun. 2016, https://doi.org/10.1088/1748-9326/11/6/064016
-
K. Breinl, D. Lun, H. Müller-Thomy, and G. Blöschl, “Understanding the relationship between rainfall and flood probabilities through combined intensity-duration-frequency analysis,” Journal of Hydrology, Vol. 602, p. 126759, Nov. 2021, https://doi.org/10.1016/j.jhydrol.2021.126759
-
I. C. Wulan Dhari, “The use of rainfall variability in flood countermeasure planning,” Journal of the Civil Engineering Forum, Vol. 3, No. 3, pp. 157–166, Sep. 2017, https://doi.org/10.22146/jcef.27579
-
M. Luczak-Rösch and M. Bischoff, “Statistical analysis of Web of Data usage,” in CEUR Workshop, Jan. 2011.
-
F. D. Barbalho, G. F. N. D. Silva, and K. T. M. Formiga, “Average rainfall estimation: Methods performance comparison in the Brazilian Semi-Arid,” Journal of Water Resource and Protection, Vol. 6, No. 2, pp. 97–103, 2014, https://doi.org/10.4236/jwarp.2014.62014
-
R. Lashari and F. P. R. Kusumawardani, “Analisa distribusi curah hujan di Area Merapi menggunakan metode Aritmatika dan Poligon,” Jurnal Teknik Sipil dan Perencanaan, Vol. 19, No. 1, pp. 39–46, Jul. 2017, https://doi.org/10.15294/jtsp.v19i1.9497
-
Dewi Handayani Untari Ningsih, “Metode Thiessen Polygon untuk ramalan sebaran curah hujan periode tertentu pada Wilayah yang tidak memiliki data curah hujan,” Dinamik, Vol. 17, No. 2, p. 245460, 2012.
-
S. Nganro, S. Trisutomo, R. A. Barkey, and M. Ali, “Rainfall analysis of the Makassar City using Thiessen Polygon method based on GIS,” Journal of Engineering and Applied Sciences, Vol. 15, No. 6, pp. 1426–1430, Mar. 2020, https://doi.org/10.36478/jeasci.2020.1426.1430
-
Y. Zong‐Chang, “Fourier analysis‐based air temperature movement analysis and forecast,” IET Signal Processing, Vol. 7, No. 1, pp. 14–24, Feb. 2013, https://doi.org/10.1049/iet-spr.2012.0255
-
A. Jufriansah, A. Khusnani, A. Hermanto, M. Toifur, and E. Prasetyo, “The existence of Fourier coefficients and periodic multiplicity based on initial values and one-dimensional wave limits requirements,” Jurnal Penelitian Fisika dan Aplikasinya (JPFA), Vol. 10, No. 2, pp. 146–157, Dec. 2020, https://doi.org/10.26740/jpfa.v10n2.p146-157
-
L. Hart and E. Stanley, “Flood frequency analysis using Gumbel distribution equation in Part of Port Harcourt Metropolis,” Project "Land and Shoreline Management", 2020.
-
A. Suharyanto, “Prediction of flood area based on the Occurrence of Rainfall Intensity,” GMSARN International Journal, Vol. 10, pp. 129–136, 2016.
-
E. Hermawan, “Pengelompokkan pola curah hujan yang terjadi di beberapa Kawasan P. Sumatera berbasis hasil analisis teknik spektral,” Jurnal Meteorologi dan Geofisika, Vol. 11, No. 2, Dec. 2010, https://doi.org/10.31172/jmg.v11i2.67
-
A. Djuraidah, C. Suheni, and B. Nabila, “Peramalan curah hujan Ekstrim di Provinsi Banten dengan model Ekstrim Spasial,” Media Statistika, Vol. 12, No. 1, pp. 50–62, Jul. 2019, https://doi.org/10.14710/medstat.12.1.50-62
-
Faradiba, “Analysis of intensity, duration, and frequency Rain Daily of Java Island using Mononobe Method,” Journal of Physics: Conference Series, Vol. 1783, No. 1, p. 012107, Feb. 2021, https://doi.org/10.1088/1742-6596/1783/1/012107
-
D. Setiawan, “Analisis Curah Hujan di Indonesia untuk Memetakan Daerah Potensi Banjir dan Tanah Longsor dengan Metode Cluster Fuzzy C-Means dan Singular Value Decompotition (SVD),” Engineering, MAthematics and Computer Science (EMACS) Journal, Vol. 3, No. 3, pp. 115–120, Oct. 2021, https://doi.org/10.21512/emacsjournal.v3i3.7428
Cited by
About this article

