Abstract
To clarify the effect of particle gradation of filling soil on the dewatering and consolidation performance of geotubes, the content of four-particle size classes (powder, fine, medium, and coarse) which are commonly used in engineering as the research object was taken. The dewatering rate, soil infiltration and solid-liquid mixing pressure in the bag with time when filling soil with different particles were studied, and the soil loss of the hanging bag was analyzed from the perspective of seepage soil gradation. The research results show that the dewatering process could be divided into the quick dewatering stage, silting stage, and stable stage according to the dewatering rate. According to the performance of soil conservation, it could be divided into the loss stage and reverse filtration stage. Further, based on the effects of powder content, non-uniformity coefficient, and curvature coefficient of soil on the dewatering rate of the hanging bag, a formula for calculating the dewatering rate of geotubes is summarized.
Highlights
- The effects of different particle sizes on the dewatering performance of geotubes are considered.
- Through the indoor hanging bag test, the influence of the content of four-particle size grades (powder, fine, medium, and coarse) on the dewatering rate was analyzed.
- The influence of the particle grading parameters of the filling sand on the dewatering performance of the geotubes is analyzed, and the calculation formula of the dewatering rate of the geotubes is summarized.
1. Introduction
As a new environmental protection engineering technology, the geotubes have been widely used in the construction of reclamation, embankment, foundation reinforcement, and sludge control engineering [1-4].
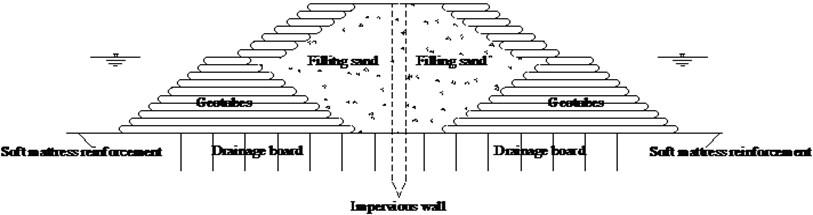
The advantage of geotube technology is the most obvious in the reclamation and embankment along the coast. This kind of engineering is formed with the dewatered geotubes on both sides and the soil in the middle, the typical section is shown in Fig. 1. The construction process of geotubes in each layer can be divided into four steps: making slurry by hydraulic, filling slurry by the high-pressure pump, dewatering, and consolidating [5]. The steps of dewatering and consolidation can be subdivided into four processes: suspension, settlement, deposition, and consolidation [6]. According to the requirements of construction, the filling degree of each layer of the geotube should be controlled at about 80 %, and the consolidation of the geotube should be started after the consolidation degree of the geotube in the lower layer reaches about 70 % [7]. As the geotube dams are often carried out in the intertidal zone and low beaches in coastal areas, the dewatering and consolidation rate of the geotubes needs to be considered to meet the dewatering and consolidation of a certain number of the geotubes before the next tide. Therefore, it has become a hot issue for many scholars at home and abroad to solve the problem that the dewatering and consolidation speed of geotubes is slow and unable to carry out tide-catching construction due to various factors.
At present, different degrees of research on the dewatering and consolidation of geotubes from the two directions of the bag material and filler have been carried out by many scholars around the world.
The material of geotubes is geotextile, and the aperture of geotextile is an important factor that affects the dewatering and consolidation performance of geotubes. Wu et al. [8] measured that the aperture of three kinds of needled geotextiles increases with the increase of tensile strain, the aperture, and the average rate of flow of the two thermally bonded nonwovens decrease with the increase of tensile strain through a wet screen test. Palmeira et al. [9] showed that the aperture of needle punched nonwoven geotextile increased with the increase of uniaxial tensile strain. The water carrying capacity of geotextiles under tensile state has been tested through multifunctional permeability test apparatus for geotextiles under biaxial tension [10]. Man et al. [11] found the sewing method of geotextile in the bag body will affect the dewatering rate of geotubes through the dewatering test of the hanging bag. And then through experimental analysis, it is concluded that the dewatering performance of geotubes is better when the weft direction of the geotextile is consistent with the circumferential direction of the geotubes. Fatema and Bhatia [6] evaluated the effect of geotextile aperture distribution on dewatering rate by using a dewatering test of two-dimensional pressure.
About the filler of geotubes, the particle gradation of the filler has an obvious impact on the dewatering and consolidation performance of geotubes [12]. And the density of filler is a factor in geotubes [13]. Further, Moo-Young et al. [14] found that the content of the initial water of geotubes has a significant impact on the rate of dewatering of geotubes in the test study. And then, Muthukuma et al. [15] studied the variation law of the rate of dewatering with the content of water and the aperture of geotextile for a specific filler. Wu et al. [16] propose an approach to accelerate the dewatering of geotubes through indoor test analysis, and the effectiveness of the approach has been verified by the field dewatering model tests on large-scale geotubes. Chang et al. [17, 18] respectively carried out a test when the geotubes is filled with high adhesive content mud, and propose a corresponding method for dewatering and consolidation. Man et al. [19] studied the influence of silt content in filling sand on the geotubes dewatering performance by hanging bag tests, and three linear calculation formulas for calculating the rate of dewatering have been fitted and analyzed.
The characteristics of filled soil material have a great impact on the dewatering rate of geotubes. [20] So far, the research on the influence of the characteristics of the filling soil on the dewatering rate of geotubes is only for the experimental research when the geotubes is only filled with soil material within a range of certain particle size or the content of soil material within a range of certain particle size is high. However, the local soil is required in the construction of geotubes, and China has a vast territory, and the particle gradation of soil is different in different regions. Therefore, it is necessary to conduct a systematic experimental study on the influence of particle gradation of filling soil on the dewatering rate of geotubes.
In this paper, the hanging bag test method is used to investigate the dewatering characteristics of geotubes under different particle gradation. It is a method to control the size, shape, bag material, and initial content of water of the test, and take each particle size grading of the filling soil as the only variable. With the test results, the effect of the particle gradation of the filling soil on the dewatering rate of geotubes is clarified.
Fig. 1Typical geotubes dam section
2. Hanging bag test
2.1. Test materials
2.1.1. Filling materials
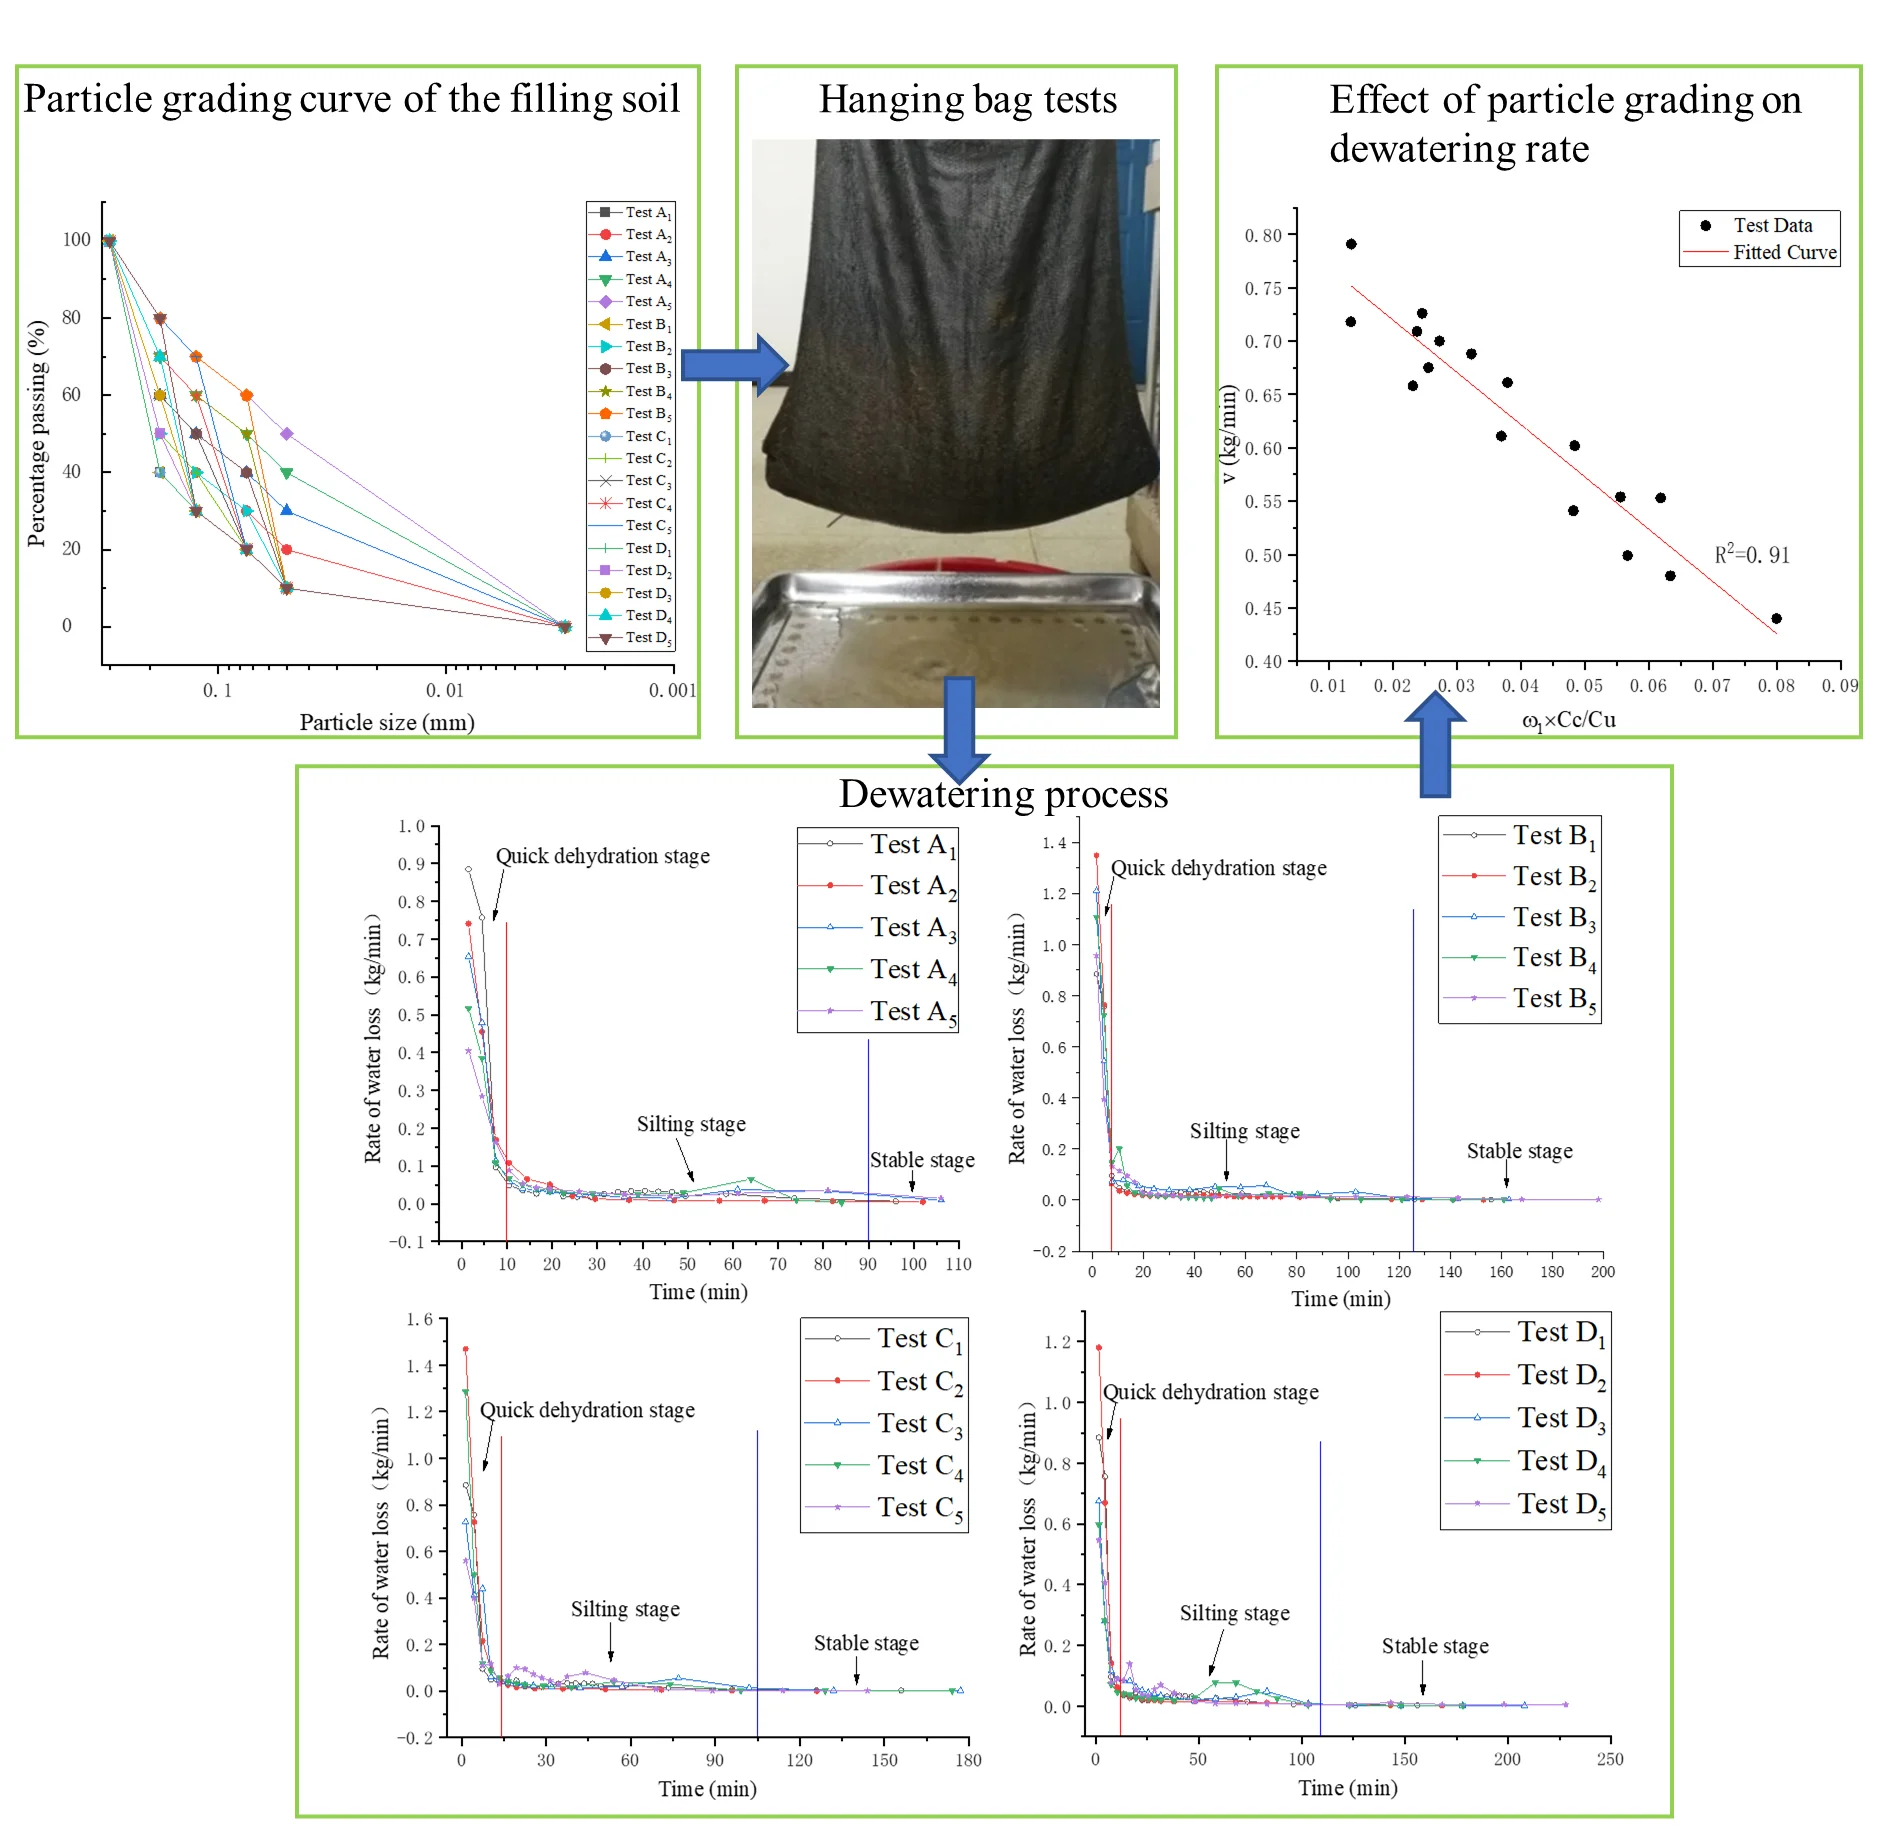
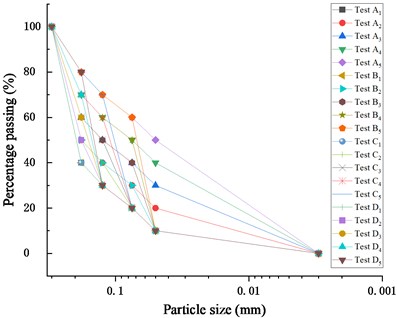
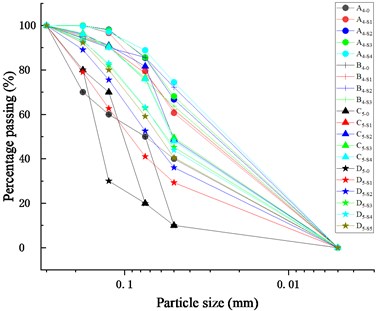
To cover the particle size range of soil that can be used as filling soil of geotubes in various regions of the country as far as possible, the soil used in the test is naturally soil, which can be divided into four levels including powder grain ( 0.05 mm), fine grain (0.05 0.075 mm), medium grain (0.075 0.125 mm), coarse grain (0.125 0.18 mm) according to the particle size. To reduce the influence of other particle size changes on the dewatering rate, only the maximum particle (particle size between 0.18-0.3 mm) content was adjusted with the change of silt content. The particle grading curve of filling soil in each test is shown in Fig. 2.
Fig. 2Particle grading curve
2.1.2. Bag materials
A kind of geosynthetics with good permeability is selected as the material for making the hanging bag. The geosynthetics used in this test are geotextiles with a mass per unit area of 150 g/m2 and an equivalent aperture of 0.07 mm, which are the most frequently used in the geotubes project. The detailed parameters of materials used for hanging bags are shown in Table 1.
Table 1Material parameters of the hanging bag
Specifications (g/m2) | Mass deviation per unit area | Thickness (mm) ≥ | Width deviation | Transverse and longitudinal breaking strength | Elongation corresponding to transverse and longitudinal standard strength (%) | CBR bursting strength (N) ≥ | Transverse and longitudinal tear strength (N) ≥ | Equivalent aperture (mm) |
150 | –5 % | 1.2 | 0.50 % | 375 | 50 | 1600 | 210 | 0.07 |
2.2. Test scheme
Using the method of indoor hanging bag dewatering test, the effect of particle size matching of geotubes filling material on the dewatering rate of geotubes was studied. To accurately obtain the influence of particle gradation of filling soil on the dewatering rate of geotubes, the specification of hanging bag material, bag shape, size, filling method, water content, and solid content of initial mud were strictly controlled. According to the particle size grade of soil particles, the test was divided into four working conditions A, B, C, and D, as shown in Table 2. Five groups of increasing content tests of this particle size grade are carried out under each working condition to simulate the linear change of soil gradation, and , , , , respectively represent the content of powder, fine, medium, coarse and control sand. The hanging bag is with a diameter of 0.5 m and a height of 1 m is sewn with geotextiles.
Table 2Test scheme
Condition number | Test group number | |||||
A | A1 | 10 % | 10 % | 10 % | 10 % | 60 % |
A2 | 20 % | 10 % | 10 % | 10 % | 50 % | |
A3 | 30 % | 10 % | 10 % | 10 % | 40 % | |
A4 | 40 % | 10 % | 10 % | 10 % | 30 % | |
A5 | 50 % | 10 % | 10 % | 10 % | 20 % | |
B | B1 | 10 % | 10 % | 10 % | 10 % | 60 % |
B2 | 10 % | 20 % | 10 % | 10 % | 50 % | |
B3 | 10 % | 30 % | 10 % | 10 % | 40 % | |
B4 | 10 % | 40 % | 10 % | 10 % | 30 % | |
B5 | 10 % | 50 % | 10 % | 10 % | 20 % | |
C | C1 | 10 % | 10 % | 10 % | 10 % | 60 % |
C2 | 10 % | 10 % | 20 % | 10 % | 50 % | |
C3 | 10 % | 10 % | 30 % | 10 % | 40 % | |
C4 | 10 % | 10 % | 40 % | 10 % | 30 % | |
C5 | 10 % | 10 % | 50 % | 10 % | 20 % | |
D | D1 | 10 % | 10 % | 10 % | 10 % | 60 % |
D2 | 10 % | 10 % | 10 % | 20 % | 50 % | |
D3 | 10 % | 10 % | 10 % | 30 % | 40 % | |
D4 | 10 % | 10 % | 10 % | 40 % | 30 % | |
D5 | 10 % | 10 % | 10 % | 50 % | 20 % |
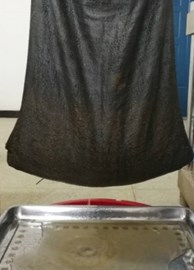
As shown in Fig. 3, the process of the hanging bag test could be summarized as follows. Firstly, 10 kg of sand and 10 kg of water were mixed into a mud mixture. Secondly, the mud mixture was poured into the hanging bag at a uniform speed. Thirdly, a weighing plate was placed under the hanging bag to receive exudate, and the weighing plate should be replaced and weighed at regular intervals until there was no liquid exudation coming out of the hanging bag. Finally, the received exudate at each interval was weighed again after drying. The mass of sand loss and water loss in each period of time could be analyzed according to the mass of exudate weighed before and after drying.
Fig. 3Hanging bag dewatering test diagram
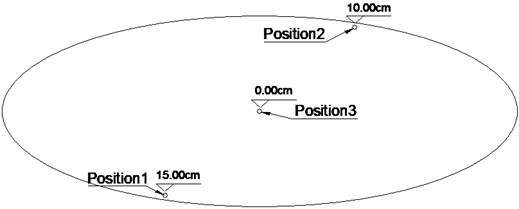
To monitor the change of solid-liquid mixing pressure at different positions inside the hanging bag, pinhole pressure sensors were installed at 15 cm (position 1), 10 cm (position 2), and the bottom of the hanging bag (position 3) respectively before each test. The layout of the sensors is shown in Fig. 4. In the figure, position 3 is located at the bottom geometric center of the hanging bag, the elevation of position 3 is regarded as 0.00 cm, and positions 1 and 2 are located at the geometric center of both sides of the hanging bag, and the elevations of position 1 and position 2 from bottom to top are 15.00 cm and 10.00 cm respectively. The sensor model is DAM-3058R, the sensor is connected to the computer by the USB interface, the real-time monitoring of the change of the mixed pressure of water and sand in the bag during the test, and the computer derives the pressure value of the position of the monitoring point in the bag every 5 seconds.
Fig. 4Schematic diagram of pore pressure sensor position
3. Test results
3.1. The performance of dewatering
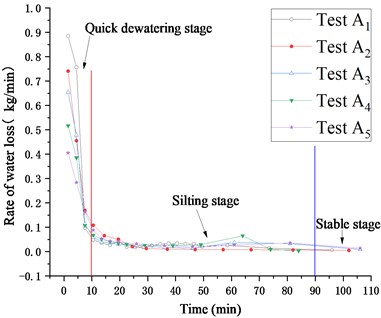
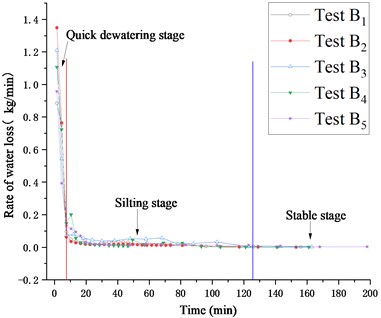
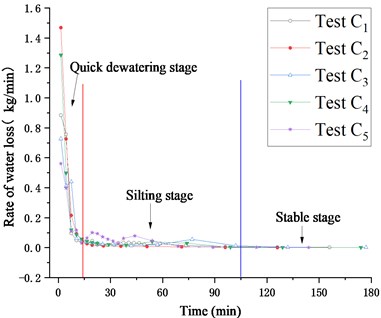
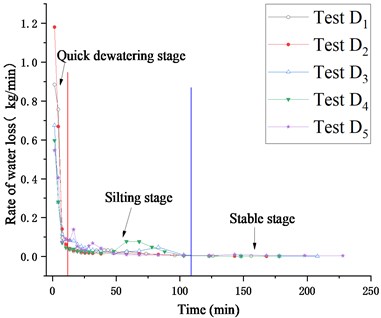
To explore the influence of particle gradation of filling soil on the dewatering performance of geotubes, the test data under various working conditions were analyzed and processed, and the variation law of the dewatering rate of each test group with time in working conditions A-D, as shown in Fig. 5, was obtained. It can be seen from the figure that the dewatering performance under various working conditions can be roughly divided into three stages: quick dewatering stage, silting stage, and stable stage.
Quick dewatering stage: it mainly occurs in the first 10 minutes after the start of the test. This stage is characterized by rapid dewatering and rapid change in dewatering rate value. It plays a leading role in the dewatering process of the hanging bag and is an effective dewatering stage.
Silting stage: after the quick dewatering stage, the dewatering rate curve in this stage is shaking. The reason for the shaking is the silting in the bag, and then the phenomenon of silting damage is produced by the rise of water pressure at the silting part. The repeated occurrence of silting and silting damage will cause the dewatering rate curve to be shaking in this stage.
Stable stage: after several times of silting and silting damage in the bag, the dewatering rate of the whole hanging bag begins to stabilize. A compact and stable inverted filter layer is formed in the bag, and the dewatering and consolidation of the hanging bag are completed.
Among them, the occurrence time of curve jitter in the silting stage of condition a lags significantly compared with conditions B, C, and D, and only the dewatering rate curve of each test group in the condition jitters once, indicating that silt is not easy to occur in the geotubes when the powder grain is used as the filling of the geotubes.
3.2. Sand conservation performance
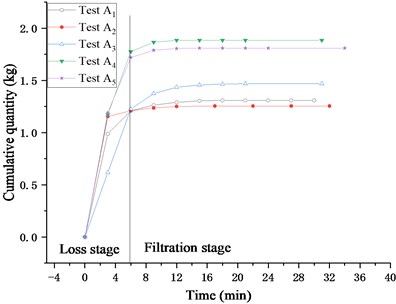
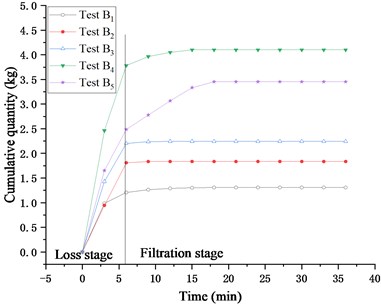
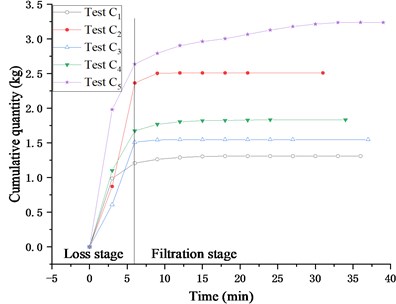
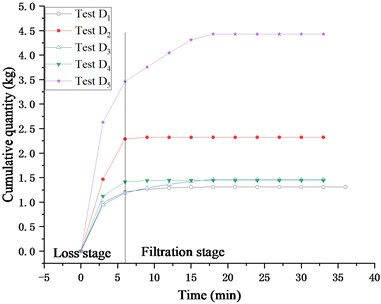
The effectiveness of dewatering and consolidation of geotubes mainly depends on the dewatering and soil conservation performance of geotextiles. In this study, the advantages and disadvantages of the soil conservation performance of each working condition group are evaluated through the calculation of soil infiltration accumulation of each working condition test group. As shown in Fig. 6, the cumulative amount of soil infiltration of each test group in working conditions A-D changes with time. It can be seen from Fig. 6 that the soil infiltration process of the hanging bag tests can be divided into two stages: loss and filtration.
Loss stage: this stage is the concentrated stage of soil infiltration of test groups under various working conditions, which is about 0-6 minutes, indicating that the stop time of the soil loss stage has nothing to do with the particle gradation of filling soil.
Fig. 5Dewatering rate of each test group with time under working conditions A-D
a)
b)
c)
d)
Filtration stage: in this stage, the inverted filter structure gradually begins to form between the filling soil and the geotextile, and with the passage of test time, the relationship curve of the cumulative amount of soil infiltration in this stage with time gradually tends to be horizontal, indicating that the inverted filter structure formed between the filling soil and the bag fabric gradually tends to be stable.
Comparing Fig. 6, it can be seen that those with low final sand infiltration accumulation appear in the first group of tests under various working conditions, and their values are about 1.25 kg. The group numbers of the most final infiltration accumulation are different. Among others, conditions A and B appear in group 4 tests, while conditions C and D appear in group 5 tests. It can be seen that when the content of each particle size of the filler is low, the sand retention performance of the geotubes system formed by the filler and the bag material is better, and can quickly enter the filtration stage and form a stable and dense filtration layer. On the contrary, when the content of each particle size of the filler is high, the sand retention performance of the geotubes system formed by the filler and the bag material is poor. It enters the inverted filtration stage and forms a structurally stable and dense filtration layer, which has a certain lag in the dewatering and consolidation time. In working conditions B, C, and D, with the increase of particle size content, the final cumulative amount of sand infiltration of each test group is significantly different from that of working condition A. Moreover, the soil retention performance of the hanging bag becomes worse when more content of filling the soil with large particle size is increased, through the horizontal comparison of Fig. 6.
Fig. 6Variation of cumulative sand infiltration of each test group with time under working conditions A-D
a)
b)
c)
d)
3.3. Solid-liquid mixing pressure
As shown in Fig. 7, it is the time-varying curve of solid-liquid mixing pressure at positions 1, 2, and 3 in the bag during dewatering and consolidation of the test group with high content and large particle size under various working conditions. It can be seen from the Fig. 7 that when the content of a large particle size fraction of the filled soil in the hanging bag is high, the pressure values at three positions in the hanging bag are large during the test. When the pressure value in the bag is large, the solid-liquid mixing pressure in the bag will change from static pressure to active pressure, resulting in the partially filled soil in the bag being squeezed out of the hanging bag through the gap of geotextile in the bag under the promotion of active pressure, it shows that the soil protection performance of hanging bag is poor.
3.4. Analysis of lost soil
To further clarify the soil loss in the test group with poor sand retention performance in each working condition group, the particle gradation of seepage soil in tests A4, B4, C5, and D5 were tested with a BT-9300H laser particle size distribution instrument. The results are shown in Fig. 8. A4-0, A4-s1, B4-s1, and C5-s1 in the Fig. 8 respectively represent the grading of original soil grading in test A4, the first group (0-3 min) seepage soil grading in Test A4, the first group (0-3 min) seepage soil grading in Test B4 and the first group (0-3 min) seepage soil grading in Test C5. And the rest number codes could be introduced in the same way.
It can be seen from Fig. 8 that the grading curves of seepage soil are above the corresponding grading curve of the original soil, indicating that the seepage soil is fine particles, and the seepage soil gradually becomes fine with the continuation of the dewatering process. Moreover, the seepage soil gradually becomes thicker with the increase of particle size grade of high soil content. Combined with the pressure value change curve in Fig. 7, it can be seen that this is because the pressure in the bag increases, and the large particle of soil is pressed out of the hanging bag. It can be seen that it is not conducive to the soil protection requirements of the hanging bag when the large particle content is too high.
Fig. 7Variation of solid-liquid mixing pressure with time at test A4, B4, C5 and D5
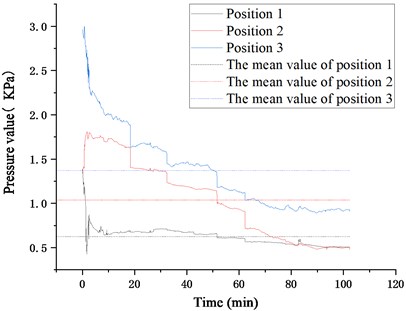
a) Pressure variation diagram of each part of test A4 with time
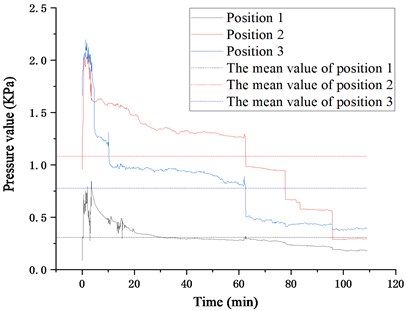
b) Pressure variation diagram of each part of test B4 with time
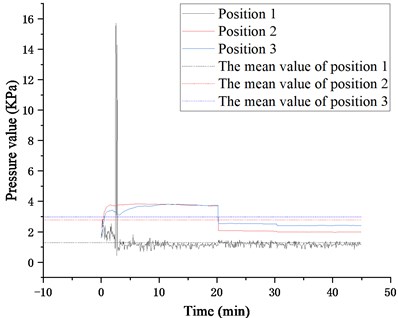
c) Pressure variation diagram of each part of test C5 with time
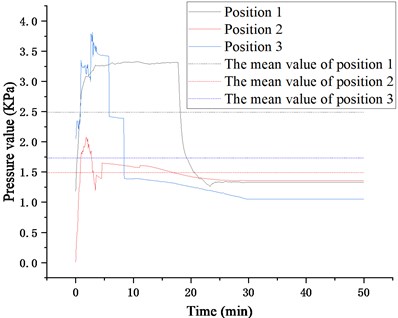
d) Variation diagram of pressure at each part of test D5 with time
Fig. 8Grading diagram of test A4, B4, C5 and D5
3.5. Effect of particle size on geotubes dewatering rate
The non-uniformity coefficient () reflects the degree of particle dispersion and the curvature coefficient () of particle continuity are the landmark parameters of sand particle gradation. At the same time, the content of silty soil has an obvious impact on the dewatering rate of geotubes. As shown in Fig. 5, the faster rate of water loss is concentrated in the quick dewatering stage. Therefore, the average rate of water loss in the quick dewatering stage could be used as an index to evaluate the rate of water loss. To accurately describe the relationship between the dewatering rate of geotubes and the particle gradation of filling soil, the test data are processed and analyzed, and the results are shown in Fig. 9. It can be seen from Fig. 9 that the average rate of water loss in the quick dewatering stage of the hanging bag is different from that of has a negative correlation linear relationship. The following calculation formula is obtained, based on a fitted analysis of the data.
Fig. 9Relationship between dewatering rate and ω1×CcCu
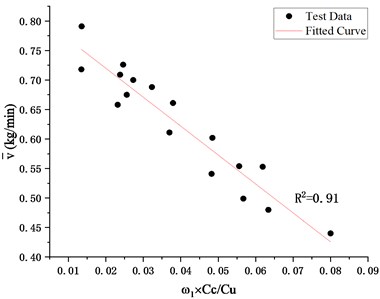
The determination coefficients of fitting formulas is greater than 0.9, indicating that the formula can be well used to analyze the influence of soil non-uniformity coefficient, curvature coefficient, and powder content on the dewatering rate of geotubes.
4. Discussion
At present, many scholars at home and abroad mainly focus on the influence of filling soil on the dewatering performance of geotubes. This paper focuses on the influence of the content change of filling soil of each particle size on the dewatering performance of geotubes, and the variation of dewatering rate was reasonably analyzed and explained from the perspective of solid-liquid mixing pressure, which makes up for the research on the influence of particle gradation of filling soil on the dewatering performance.
The construction technology of the geotube dams determines the heterogeneity of material and discontinuity of structure. For a single geotubes, it is composed of bag geotechnical material and filling soil, therefore it is the only way to fully reveal the dewatering performance of a single geotube to clarify the influence of bag material and filling soil seepage coupling. In this study, the influence law of particle gradation of filling soil on the dewatering performance of geotubes has been clarified. However, the influence of bag materials of different specifications on the dewatering performance of geotubes and the influence law of orthogonal combination of bag materials of different specifications and filling soil at different levels on the dewatering performance of geotubes have not been clarified. In the later stage, it is necessary to further explore the influence of bag material and the particle gradation of filling soil on the dewatering performance and improve the law of single geotube dewatering performance.
5. Conclusions
In this paper, the dewatering and consolidation process of geotubes in practical engineering is simulated by an indoor hanging bag test, and the dewatering and consolidation simulation test with the step-by-step increase in the content of filling soil of each particle size is carried out. Combined with the test results, the influencing factors and laws of dewatering consolidation and soil conservation performance of hanging bags are analyzed. The conclusions are as follows.
1) With the step-by-step increase of the filling soil content of each particle size, the changing trend of the whole dewatering and consolidation process of the hanging bag is roughly the same, and can be divided into three stages: quick dewatering stage, silting stage, and stable stage. Among them, the filling soil with powder particle size is not conducive to the dewatering and consolidation of hanging bags. Although the filling soil with medium and coarse particle sizes is conducive to the dewatering and consolidation of hanging bags, the siltation in the silting stage is more serious.
2) In the process of bag dewatering and consolidation, sand infiltration can be divided into two stages: loss stage and filtration stage. The lower the content of each particle size grade of the filling soil, the faster the hanging bag can reach the stable state of consolidation.
3) The higher the content of large particle size filler, the greater the solid-liquid mixing pressure in the hanging bag, and the worse the soil retaining performance of the hanging bag.
During the actual construction of the geotubes project, it is suggested to avoid filling the soil with high large particle content as far as possible, if there are high requirements for soil retaining performance of geotubes.
4) The average rate of water loss in the quick dewatering stage could be used as an index to evaluate the dewatering rate of the hanging bag. The functional relationship between this average rate and the new parameter for the composition of powder content, non-uniformity coefficient, and curvature coefficient of filling soil is summarized by the new formula.
References
-
R. H. Li, “Application of geotubes cofferdam in Fenhe Sanba water conservancy project,” (in Chinese), Shanxi water conservancy, Vol. 35, No. 4, pp. 25–27, Apr. 2019, https://doi.org/10.3969/j.issn.1004-7042.2019.04.012
-
S. H. Liu and G. Y. Song, “A new earth reinforcement method by sandbags,” (in Chinese), Rock and Sand Mechanics, Vol. 28, No. 8, pp. 1665–1670, Aug. 2007, https://doi.org/10.3969/j.issn.1000-7598.2007.08.025
-
Z. C. Li, “Laboratory Study on the dewatering and consolidation settlement of the arsenic sludge using geotextile tube,” (in Chinese), Hebei University of Science and Technology, 2013.
-
J. Dong and J. B. Liang, “The practical experience of geo-tube in sludge dewatering engineering,” (in Chinese), Sichuan Environment, Vol. 33, No. 1, pp. 154–158, Feb. 2014, https://doi.org/10.3969/j.issn.1001-3644.2014.01.031
-
H. M. Wu et al., “Efficient dewatering technology of geotextile tubes filled with high clay (silt) particle-content sand,” (in Chinese), Advances in Science and Technology of Water Resources, Vol. 38, No. 1, pp. 19–27, Jan. 2018, https://doi.org/10.3880/j.issn.1006-7647.2018.01.003
-
N. Fatema and S. Bhatia, “Role of geotextiles pore size distribution in dewatering tests,” Geosynthetics International, Vol. 28, No. 1, pp. 1–15, Sep. 2020, https://doi.org/10.1680/jgein.20.00029
-
M. J. Xi, “Construction technology of large filling bags,” (in Chinese), Port and Waterway Engineering, Vol. 11, pp. 189–192, Nov. 2009, https://doi.org/10.3969/j.issn.1002-4972.2009.11.038
-
C.-S. Wu, Y.-S. Hong, and R.-H. Wang, “The influence of uniaxial tensile strain on the pore size and filtration characteristics of geotextiles,” Geotextiles and Geomembranes, Vol. 26, No. 3, pp. 250–262, Jun. 2008, https://doi.org/10.1016/j.geotexmem.2007.09.004
-
E. M. Palmeira, D. L. A. Melo, and I. P. Moraes-Filho, “Geotextile filtration opening size under tension and confinement,” Geotextiles and Geomembranes, Vol. 47, No. 4, pp. 566–576, Aug. 2019, https://doi.org/10.1016/j.geotexmem.2019.02.004
-
G. H. Lei et al., “Multifunctional permeability test apparatus for geotextiles under biaxial tension,” (in Chinese), Chinese Journal of Geotechnical Engineering, Vol. 38, pp. 119–124, Mar. 2016, https://doi.org/10.11779/cjge2016s1022
-
X. Man, G. Sha, S. Hu, G. Liu, and W. Wang, “Effect of geotextile sewing method on dewatering performance of geotubes: an experimental study,” Journal of Measurements in Engineering, Vol. 7, No. 4, pp. 205–213, Dec. 2019, https://doi.org/10.21595/jme.2019.21270
-
W. Lick, Sediment and Contaminant Transport in Surface Waters. CRC Press, 2008, https://doi.org/10.1201/9781420059885
-
J. Malik and S. Sysala, “Analysis of geosynthetic tubes filled with several liquids with different densities,” Geotextiles and Geomembranes, Vol. 29, No. 3, pp. 249–256, Jun. 2011, https://doi.org/10.1016/j.geotexmem.2010.11.004
-
H. K. Moo-Young, D. A. Gaffney, and X. Mo, “Testing procedures to assess the viability of dewatering with geotextile tubes,” Geotextiles and Geomembranes, Vol. 20, No. 5, pp. 289–303, Oct. 2002, https://doi.org/10.1016/s0266-1144(02)00028-6
-
A. Muthukumaran and K. Ilamparuthi, “Laboratory studies on geotextile filters as used in geotextile tube dewatering,” Geotextiles and Geomembranes, Vol. 24, No. 4, pp. 210–219, Aug. 2006, https://doi.org/10.1016/j.geotexmem.2006.03.002
-
H. M. Wu et al., “Field model tests on effective dewatering technology of geotextile tube filled by sand with high clay (silt) particles content,” (in Chinese), Chinese Journal of Geotechnical Engineering, Vol. 38, pp. 215–221, Mar. 2016, https://doi.org/10.11779/cjge2016s1039
-
G. P. Chang et al., “Efficient dehydration method of geotube filled high adhesive content mud,” (in Chinese), Water Resources and Power, Vol. 32, No. 3, pp. 129–133, Mar. 2014.
-
G. P. Chang et al., “Experimental study of efficient consolidation drainage for tubes filling with Siol material of fine particles,” (in Chinese), South-to-North Water Transfers and Water Science and technology, Vol. 13, No. 5, pp. 901–904, Sep. 2015, https://doi.org/10.13476/j.cnki.nsbdqk.2015.05.017
-
X. Man, S. Hu, and W. Wang, “Effect of silt content in filling sand on the geotubes dewatering performance by hanging bag tests,” Journal of Measurements in Engineering, Vol. 8, No. 3, pp. 132–141, Sep. 2020, https://doi.org/10.21595/jme.2020.21645
-
L. D. Suits, T. C. Sheahan, R. M. Koerner, and G. R. Koerner, “Performance Tests for the Selection of Fabrics and Additives When Used as Geotextile Bags, Containers, and Tubes,” Geotechnical Testing Journal, Vol. 33, No. 3, p. 102686, 2010, https://doi.org/10.1520/gtj102686
About this article

This work was supported by the Key Research Project of Natural Science in Colleges and Universities of Anhui Province (KJ2021A1099), and the Natural Science Foundation of Shandong Province (ZR2019MEE106).
