Abstract
In order to explore the influence of the distribution of cracks in the rock on the stability of the rock, X-ray diffraction test and electron microscope scanning test were carried out. It was found that the cracks are highly developed under the microscopic view, and micro-cracks can be clearly observed. difficult to observe directly. PFC2D can solve this problem very well. It can generate fractures with different inclination angles and different numbers of different total lengths respectively; explore its influence on the compressive strength of rocks, and observe the development process of micro-fractures and the macro-fractures and micro-fractures after complete crushing. It is found that the inclination angle is linearly related to the compressive strength, and the micro-cracks generally have an X-shaped distribution after complete crushing.
1. Introduction
A large number of soft rocks are developed in the Hemaquan area of Urumqi. Soft rock not only has low compressive strength, but also is easy to expand and collapse when encountering water, which brings many engineering problems to tunnel excavation and slope support. Under the action of natural forces, weathered bedrock is widely distributed in Hemaquan area, with shallow burial depth at the top, belonging to Jurassic Sangonghe Formation (SG). It is mainly grayish yellow and light yellow, and the main lithology is mudstone. The instability of soft rock will bring huge losses to the project. The failure forms of soft rock mainly include disintegration under the action of dry wet cycle and failure after exceeding its own bearing limit under external pressure. Many scholars have discussed the failure of soft rock through various factors and found that the existence of cracks plays an important role in the stability of soft rock. Cai et al. [1] studied the disintegration resistance of mudstone minerals in combination with XRD diffraction test and mercury intrusion test, and found that the proportion of clay minerals has a significant impact on mudstone disintegration. Guo et al. [2], Deng et al. [3] and Liu et al. [4] studied the disintegration characteristics and mechanism of mudstone from the aspects of acid-base environment, hydrothermal metasomatism, energy dissipation principle, etc; Su and Zhang [5] proved through experiments that the premise of rock disintegration is the destruction of its internal microstructure; Liu et al. [6] found through laboratory tests that the uniaxial compressive strength is obviously affected by the form of cracks; Wang et al. [7] analyzed the influence of single fracture geometric characteristics on the compressive strength of composite rock mass.
The research on the influence of fissures on the stability of soft rock mainly focuses on the resistance to disintegration and the compressive failure of non soft rock, and the influence of fissures on the compressive strength of rock still needs to be improved. Therefore, based on the slope support engineering and tunnel engineering in Hemaquan area, this paper conducts the dry wet cycle test on the field test block to explore its disintegration resistance; PFC2D is used to generate soft rock samples to explore the compressive strength of different samples. The results can provide some reference for Hemaquan area project and other projects.
2. Test overview
2.1. Basic properties of rock samples
Samples were collected from different locations in Hemaquan area. The samples were mainly sandy mudstone. X-ray diffraction tests were carried out on the collected samples to obtain their mineral composition. The main component was quartz, accounting for up to 44.90 %. In addition, illite accounted for a large proportion. The other components included orthoclase, montmorillonite, kaolinite, etc., which were complex. Secondly, the scanning electron microscope (SEM) test was carried out. Fig 1 shows the SEM of soft rock. It is known from Fig. 1 that with the increase of magnification, it is obvious that the microstructure of soft rock is relatively loose, mainly composed of thin sections and flocs, with obvious distribution of micro pores and highly developed fractures. When the magnification is 950 times, 2.8 μm, this relatively loose microstructure is conducive to the entry of water molecules into the rock, which provides conditions for rock water absorption, water retention and water rock reaction.
Fig. 1SEM diagram of microscopic characteristics of soft rock
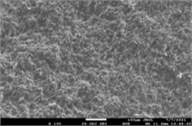
a) ×130
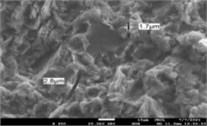
b) ×950
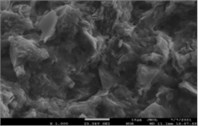
c) ×1500
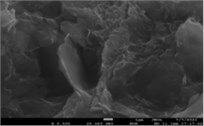
d) ×5500
2.2. Dry wet cyclic specimen and uniaxial compression test
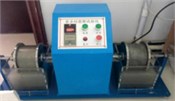
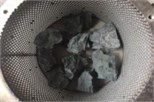
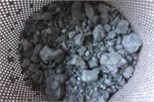
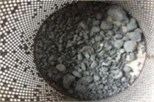
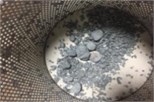
The rocks in Hemaquan area are mostly soft rocks. According to the field investigation, such rocks are easy to collapse in case of water. Through the anti collapse test of rock, the compressive capacity of rock in Hemaquan area is found out. Conduct three dry cycles and wet cycles on the sample. For each cycle, put the sample into the cylindrical screen of the anti disintegration tester (Fig. 2(a)), and operate according to the test steps. In this paper, only one group of soft rocks disintegrates under the dry wet cycle. As shown in Fig. 2, it can be clearly seen that the rock disintegration is the most obvious under the first dry wet cycle. With the increase of dry wet cycles, the disintegration amplitude decreases. This is because the internal defects of small particles are less and the strength is larger, so the rock disintegration is relatively not obvious after the third dry wet cycle.
Fig. 2a) Rock disintegration resistance tester, b) initial rock sample, c) first dry wet cycle, d) second dry wet cycle, e) third dry wet cycle
a)
b)
c)
d)
e)
The samples are taken from the tunnel construction site in Hemaquan area. The core samples with the pile number of yk7+750 and the sample numbers of Y1, Y2, Y3, Y4, Y5, Y6, Y7, Y8 are taken. The uniaxial compressive test results are shown in Table 1.
Table 1Uniaxial compression test results
Sample No | Y1 | Y2 | Y3 | Y4 | Y5 | Y6 | Y7 | Y8 |
Uniaxial compressive strength (MPa) | 45.4 | 28.9 | 21.9 | 26.8 | 29.54 | 31.2 | 23.5 | 37.2 |
3. Numerical simulation process
3.1. Establishment of numerical model and parameter calibration
In order to make the discrete element model more truly reflect the actual rock mechanics, the uniaxial compression test is used for parameter calibration. The average compressive strength of the indoor test is 28.43 MPa. After a large number of numerical tests, the calculated compressive strength of the model is 28.4305 MPa. The stress-strain curve is shown in Fig. 3, and the calibrated microscopic parameters are shown in Table 2.
Fig. 3Stress-strain curve
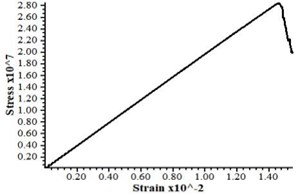
Table 2Microscopic parameters of soft rock in Hemaquan area
Linear bonding group | Parallel bonding group | ||||||||
Density / kg·m-3 | emod / GPa | Friction | kn ration | Radius ratio | emod / GPa | kn ration | Tensile strength / MPa | Cohesion / MPa | Friction angle / ° |
2500 | 10 | 0.577 | 1.6 | 0.67 | 10 | 1.6 | 9.205 | 60 | 15 |
3.2. Establishment of numerical model and parameter calibration
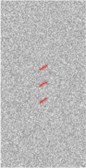
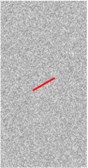
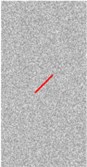
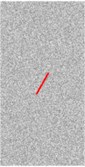
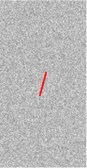
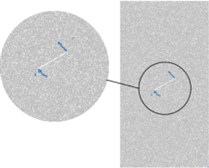
The numerical model is generated in PFC2D. The bonding mode between particles is parallel bonding. The main steps of numerical simulation are: sample generation, preloading, cementation and loading. Sample 20 cm×10 cm, generate 8 samples. There are 14534-14775 particles with different sizes in each sample, and the particle radius ratio is 0.67. After servo, there are 28242-28657 contacts. Each sample generates 1-3 cracks, with a total length of 3 cm, as shown in Fig. 4. Among them, A and B are two fractures, each of which is 1.5 cm long. The inclination of a fracture is 30° and –30° cross distribution, and the inclination of B two fractures is 30° vertical parallel distribution; C. D refers to the different distribution of three fractures, each of which is 1cm long and has an inclination of 30°; E. The length of F, G and H fractures is 3 cm, and the dip angles are 30°, 45°, 60° and 75°.
Fig. 4Soft rock samples with different fracture distributions under particle flow
a)
b)

c)
d)
e)
f)
g)
h)
3.3. Analysis of compressive strength of samples during loading
PFC2D is used to simulate the unconfined uniaxial compression process. The generated sample simulates the soft rock material in Hemaquan area. By controlling the speed of the wall, the soft rock material is pressurized. The pressurization process is shown in Fig. 5 (the loading process of each sample is the same as that of sample a). The whole process of compression failure of soft rock material can be recorded by PFC2D. The fish language of the software can record and calculate the force on the wall to obtain the axial stress, and record the vertical displacement of the wall to obtain the axial strain.
Fig. 5Sample loading process
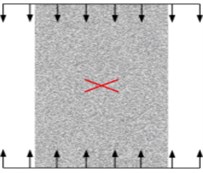
Fig. 6Each sample is destroyed by the load load
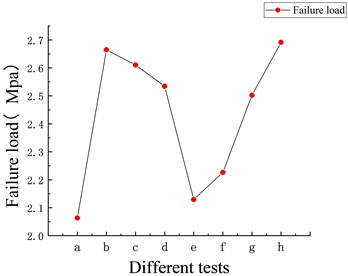
Fig. 6 shows the uniaxial compressive strength of each sample. It can be clearly seen that the uniaxial compressive strength of sample a is the lowest, which is 20.63 MPa. The minimum uniaxial compressive strength of sample h is 26.91 MPa. According to the analysis in Fig. 6, in the case of two prefabricated cracks, the influence of cross cracks is much greater than that of parallel cracks; For the three cracks, the influence of horizontal parallel distribution is less than that of vertical plane distribution, but the overall influence is small; The uniaxial compressive strength will also increase with the increase of the angle of a single prefabricated crack. The analysis shows that the closer a single crack is to 90°, the closer the crack direction is to the loading direction, so the influence of prefabricated cracks is also reduced.
4. Analysis of numerical simulation results
4.1. Analysis of fracture development process
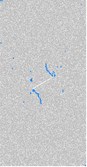
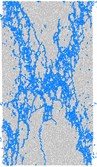
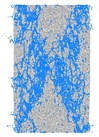
The DFN module is introduced into PFC2D to display the micro crack and its development process of the sample. In this paper, the micro crack development process of sample e is taken as an example. As shown in Fig. 7, it can be observed that the initial crack initiation direction of the micro crack is almost orthogonal to the direction of the prefabricated crack. With the continuous loading, the crack continues to develop, but the micro crack orientation changes slightly, and new cracks are generated at individual positions of the sample, so the loading continues; The micro cracks increase gradually and the cracks run through. The development of micro cracks promotes the rock failure. After the rock failure, new micro cracks are generated. Under the interaction of the two, the sample gradually collapses until it completely loses its strength.
Fig. 7Micro-fracture development process
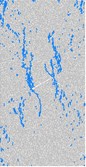
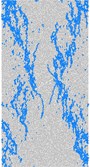
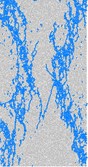
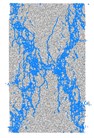
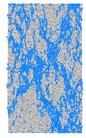
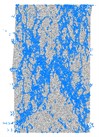
4.2. Micro and macro fracture characteristics of fractured soft rock
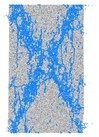
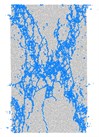
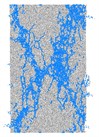
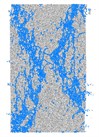
Fig. 8 shows the distribution of micro cracks in soft rock samples after continuous loading to complete failure, while the development of macro cracks after sample failure mainly depends on the distribution of blocks. After the sample is completely destroyed, the micro cracks are generally distributed in X-shape, and sample C is distributed in multiple X-shape. Because it is three 1 cm prefabricated cracks distributed horizontally and parallel, it can be understood that each prefabricated crack will generate a group of X-shape micro crack distribution.
Fig. 8Fractural characteristics of micro cracks after sample a-h crushing
5. Conclusions
1) Through the laboratory test, it is known that the soft rock in Hemaquan area of Urumqi contains a large number of clay minerals that expand with water, and there are a large number of micro fissures inside. The existence of fissures lays the foundation for the water rock reaction, which promotes the development of fissures, and the soft rock collapses under continuous circulation.
2) The numerical test results show that the existence of prefabricated cracks reduces the uniaxial compressive strength of rock. In the case of a single crack, the crack angle is linearly related to the compressive strength, while in the case of multiple crack distributions, the influence of the cross distribution of cracks on the compressive strength is much greater than the other distributions.
3) The micro cracks are perpendicular to the prefabricated cracks at the beginning of their development, and are mainly concentrated at both ends of the prefabricated cracks. With the loading, the micro cracks penetrate and the prefabricated cracks disappear. After the sample is completely broken, the micro cracks are generally X-shaped.
References
-
Z. Y. Chai, Y. T. Zhang, and X. R. Zhang, “Experimental investigations on correlation with slake durability and mineral composition of mudstone,” (in Chinese), Journal of China Coal Society, Vol. 40, No. 5, pp. 1188–1193, 2015, https://doi.org/10.13225/j.cnki.jccs.2014.0897
-
Y. C. Guo, Q. Xie, and J. Q. Wen, “Effect of the alternation of heat and water on the slaking phenomenon of redbeds,” (in Chinese), Hydrogeology and Engineering Geology, Vol. 39, No. 5, pp. 69–73, 2012, https://doi.org/10.16030/j.cnki.issn.1000-3665.2012.05.008
-
T. Deng, J. W. Zhan, M. Huang, and F. T. Fan, “Disintegration characteristics test of red-bed soft rock argillaceous shale in acid and alkali environment,” (in Chinese), Journal of Engineering Geology, Vol. 22, No. 2, pp. 238–243, 2014, https://doi.org/10.13544/j.cnki.jeg.2014.02.009
-
X. M. Liu, L. Xiong, J. H. Liu, and M. H. Zhao, “Slacking mechanism of red sandstone based on energy dissipation principle,” (in Chinese), Journal of Central South University (Science and Technology), Vol. 42, No. 10, pp. 3143–3149, 2011.
-
T. M. Su and Y. G. Zhang, “Phenomenon and mechanism of red bed mudstone disintegration,” (in Chinese), Journal of Highway and Transportation Research and Development, No. 2, pp. 9–13, 2014.
-
X. W. Liu, Q. S. Liu, Y. Chen, and Q. Li, “Experimental study of effects of fracture type on strength characteristics and failure modes of fractured rockmass,” (in Chinese), Rock and Soil Mechanics, Vol. 36, pp. 208–214, 2015, https://doi.org/10.16285/j.rsm.2015.s2.027
-
Q. H. Wang, J. Wang, Y. C. Ye, W. Q. Wang, C. C. Huang, and N. Y. Hu, “Effect of Single Fracture Geometric Characteristics of Composite Rock Samples on lts Failure Mode and Strength,” (in Chinese), Metal Mining, Vol. 524, No. 2, pp. 134–140, 2020, https://doi.org/10.19614/j.cnki.jsks.202002023
About this article

Thanks for the help provided by CSCEC Xinjiang Construction Engineering Group (Co., Ltd.) project (65000022859700x200166).
