Abstract
When the conductor is covered with ice on a non-circular section, and there is low-frequency, large-amplitude motion under wind excitation, it is usually called the transmission line galloping phenomenon. Due to the large amplitude, the galloping of the transmission line will lead to line fatigue, increase in tension, damage to hardware, or toppling of towers. In addition, it will also lead to flashover, tripping, and other transmission accidents caused by the short phase distance, which is not conducive to the safe operation of power grids. In order to improve the safety of power grid operation, this paper designed an online monitoring and early warning system for transmission line galloping on the basis of multi-source data and verified the system through implementation. It was found that the safety factor was 1.568, which determines its early warning level and affirms the feasibility of this study. This research has a positive role in improving the safe operation of the power grid.
Highlights
- The monitoring between poles and towers is accurate to millisecond, which makes the calculation results more accurate and reasonable and enhances the robustness of this study.
- the actual climate conditions such as wind speed, humidity and wind direction were taken into account in the study, which strengthened all kinds of possible practical problems in the study and made the study more comprehensive.
- from the perspective of economy and manpower, the systematic research in this paper can greatly improve the accuracy and validity of transmission line monitoring, save the monitoring cost and the loss of human resources in power transformation enterprises, and play a positive role.
1. Introduction
Online monitoring of transmission lines is an important means to realize state monitoring, diagnosis, and maintenance and is the key to the construction of a smart power grid. The realization of state maintenance largely depends on online monitoring and early warning technology [1-7]. Design line ontology and channel environment for the galloping online monitoring object of transmission lines [8-11]. Among them, the target of line body monitoring is to get the key data such as frequency and amplitude when the conductor is galloping. In particular, optical sensors can be used to obtain the trajectory of transmission line monitoring points, and then the characteristic parameters of their galloping can be obtained through analysis. Meteorological conditions such as wind speed, temperature, and wind direction should be obtained when galloping. By monitoring and processing the multi-source data of transmission lines, we can master the galloping situation of transmission lines in real time. On the one hand, the basic data on the galloping of transmission lines can be accumulated to provide important data basis for solving the galloping problem of transmission lines. On the other hand, according to the flapping characteristic parameters, the flapping state of the current line can be reasonably evaluated, and the corresponding warning prompt can be made to ensure the safe operation of the transmission line. Therefore, this paper started from the extraction of the galloping characteristics of transmission lines, built a transmission line galloping online monitoring and early warning system that met current needs, and tested the feasibility of its design by empirical means.
2. Extraction and model construction of galloping characteristic parameters of transmission lines
Because the flapping vibration of transmission lines is self-excited, it has the characteristics of low frequency and large amplitude, so the flapping amplitude and frequency of transmission lines can be determined directly by extracting the flapping parameters of transmission lines. Among them, the galloping amplitude directly expresses the galloping strength of the line, determines the minimum distance between the phase conductors and the ground wires, and also determines the maximum dynamic tension of the transmission line in this state. In general, the galloping frequency can be regarded as the natural frequency of a certain order of wire. By analyzing the galloping frequency of the line, the galloping problem induced by transverse vibration and torsional vibration can be avoided.
2.1. Spectrum analysis of galloping displacement sequence
In general, the discrete Fourier transform method is used to convert the time-domain data obtained from the galloping monitoring of transmission lines into frequency-domain data, as shown in Eq. (1), laying a foundation for the extraction of the galloping frequency and assigned characteristic parameters:
where, the input discrete signal with length is represented by , and the discrete Fourier transform result is represented by . The fast Fourier transform method of discrete Fourier transform is mainly used in the calculation. This method has the characteristics of low complexity and fast calculation, and the result of the calculated modulus can represent the amplitude distribution of the signal spectrum component expressed in the form of frequency function. In the amplitude spectrum, the first frequency = the amplitude of the 0 component/the DC component of the sampling points, and the corresponding amplitude of the other frequencies *2/ the sampling points = the true amplitude spectrum. In addition, the peak value in the amplitude spectrum can represent the main frequency component in the time series. In order to detect the displacement sequence with stable frequency as a whole, an additional short-time Fourier transform is needed, i.e., discrete Fourier transform is processed for time-domain windowing in the sliding window, and then the relationship between input signal frequency and time is determined according to the power density of each window.
2.2. Function model construction of galloping displacement sequence
In order to better deal with the displacement time series of the wire spacer's centroid in the and directions, the trigonometric function of Eq. (2) can be used here to process, i.e., to fit in the time domain:
where, the reference offset is represented by , the amplitude corresponding to is represented by , and the phase corresponding to is represented by . In the fitting process, the nonlinear least square method is used for parameter estimation. In addition, the original data can also be fitted by extracting the galloping eigenvalues, which can avoid the interference of non-integral period truncation. The advantages of these two methods are as follows: First, the error of extracting displacement frequency by these two methods is relatively small, and the spectral analysis method is simple to calculate, without an iterative solution. Second, is obtained by the two methods to extract harmonic amplitude will always be less than half of the actual maximum differential displacement value, angle of disaster monitoring and early warning on see, frequency response can be obtained by means of spectral analysis of , and then calculate the maximal displacement difference in sliding window (peak-to-peak value), choose the half wave amplitude can satisfy the actual security needs. Thirdly, the time-domain displacement fitting can be used for trajectory simulation and characteristic analysis of the galloping plane, and the harmonic amplitude obtained from spectrum analysis can be used as the initial value of displacement fitting to accelerate convergence.
3. Based on the weather and safety system conditions of transmission line galloping warning criteria
3.1. Galloping warning criteria based on meteorological conditions
The structural parameters of transmission lines, as internal factors affecting the movement, usually remain unchanged, so the early warning mainly focuses on the influence of changing meteorological conditions on the line. Since most of the power transmission lines have not installed galloping online monitoring devices, it is considered to use the time data of national ground stations shared by the China Meteorological Data Network for macro meteorological warnings. The data set includes hourly observation values of temperature, wind speed and direction, relative humidity, etc., and the site can basically cover all administrative units at the county level. Early warning based on meteorological elements is the most commonly used model for monitoring and early warning of power grid meteorological disasters. However, meteorological elements are not the direct index to measure micrometeorological power disasters, so a targeted early warning model needs to be established based on relevant knowledge. Therefore, at present, there is no universal galloping classification warning standard for transmission lines, and there are certain differences in indicators and grade classification used in different galloping warning methods, so there is no direct comparison between different kinds of warning standards. Generally, meteorological disaster warning in China is distinguished by four levels (blue), three levels (yellow), two levels (orange), and one level (red). This paper refers to a similar meteorological disaster warning system, combined with the weather conditions of transmission lines galloping and the possible hazards brought by galloping. It decided to adopt the model of “meteorological warning + interphase safety factor warning” to construct a two-level warning system of the occurrence possibility and intensity of galloping. Specifically, before the occurrence of galloping, the possibility of galloping with different combinations of meteorological elements is determined by referring to the warning levels of meteorological departments, and the regions exceeding the threshold are given early warning. For the area with the galloping phenomenon, the key monitoring is carried out, the galloping track of the conductor is obtained by online detection means, and the galloping amplitude is extracted, which is used to calculate the minimum interphase distance. Finally, according to the safety factor of interphase, the warning level is divided to determine the galloping strength of each wire and the existing electrical threat to give early warning to transmission lines exceeding the threshold value.
3.2. Galloping warning criteria based on the same safety factor
Online monitoring data extracted from the wave amplitude is a key indicator to determine the intensity of transmission line galloping. When all the phase conductors have different wave behaviors, and the wave amplitude decreases with the increase of distance, flashover and trip problems may occur due to the small phase spacing after the wave reaches a certain strength. Therefore, it is necessary to set up early warning standards for real-time warning to avoid the occurrence of such problems. According to the safety factor of phase, four warning standards can be divided, and the corresponding values are determined comprehensively according to the systematic error and reservation margin of the measurement. When the minimum interphase distance during galloping is 1.5-2 times of the minimum safety distance, a four-level warning can be issued, indicating that the strength of galloping of transmission lines is small and the line operation is relatively safe. In this environment, flashover problems generally do not occur, but bolts loosening or metal wear may still occur. Galloping down to a safe distance and minimum distance of 1.2 to 1.5 times can be regarded as a level 3 alert, showing that the strength of the transmission line galloping is large, the operation has a threat, and the wave amplitude and duration should be closely concerned. In addition, the maximum dynamic tension can be estimated based on the feature of galloping value caused by transmission line galloping. When the minimum galloping phase spacing is 1.0-1.2 times the safety distance, it can be regarded as a second-level warning, indicating that there is serious galloping behavior on the transmission line, which poses a major threat to the safety of its operation. Therefore, it is necessary to strengthen inspection and make emergency plans. If necessary, the transmission line can be de-iced to destroy the mechanical conditions of galloping. When the minimum interphase distance of galloping is less than the safe distance, it can be regarded as a first-level warning, indicating that tripping and flashover problems may occur on the gravel of transmission lines, and corresponding intervention measures should be taken to formulate emergency treatment plans, as shown in Table 1. The discriminant method of interphase safety factor has the advantages of simple calculation, effectiveness, and accuracy, so it is feasible to use the discriminant method of interphase safety factor in online monitoring and warning of transmission line galloping state in the galloping monitoring and warning system.
Table 1Setting of early-warning grading standards for a safety factor of galloping phase
The warning level | Level 1 warning | Level 2 warning | Level 3 warning | Level 4 warning |
Safety factor of galloping |
4. Design of online monitoring and early warning system for transmission line galloping
4.1. System function design
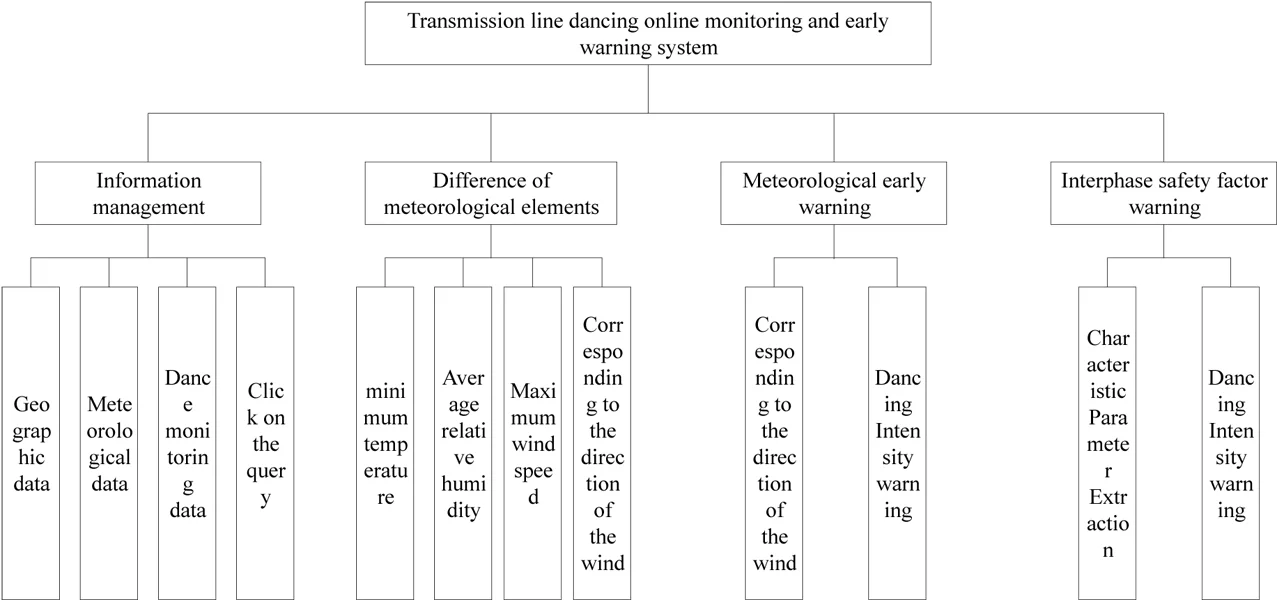
Aiming at the problem of transmission line galloping, this paper took YN province as an example to design and study its online monitoring and early warning system here, so that the system has a number of functions, such as data management, data analysis, system early warning, and visualization. The design steps are as follows. First, ArcGISDesktop software was used to construct the research object database and two-dimensional scene, and GIS development technology was used for secondary development. Secondly, the geographically weighted regression (GWR) software was used to batch process the trend modeling of meteorological elements. Finally, Matlab software was used to process the images of the galloping video to facilitate the subsequent platform invocation. The system is shown in Fig. 1.
It is seen that the system includes modules such as information management, meteorological element interpolation, meteorological warning, and interphase safety factor warning. In the system management module, it includes the storage, query and management of geographic data, meteorological data, and galloping test data. In the difference value module of meteorological elements, it contains the query function of the minimum temperature, average relative temperature, maximum wind speed, corresponding wind direction, and other key parameters. In the meteorological warning module, the function of hourly meteorological difference and the warning of galloping intensity are given. In the warning module of interphase safety factor, feature parameter extraction function and galloping intensity warning function are included.
Fig. 1System function design
4.2. System framework design
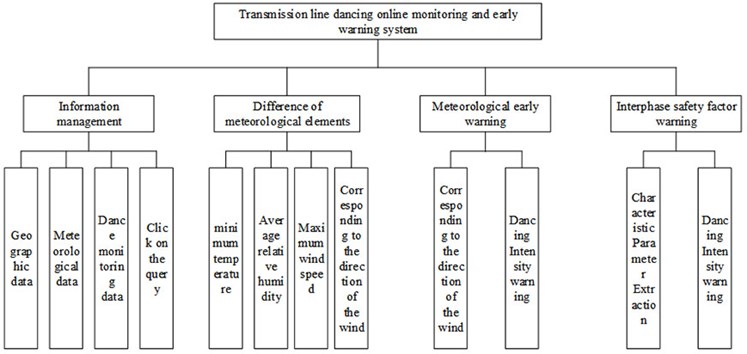
The system framework is mainly composed of the presentation layer, business layer, driver layer, and data layer, as shown in Fig. 2.
Fig. 2System framework design
As can be seen from Fig. 2, the presentation layer provides users with a system visualization module, i.e., users can intuitively understand the results after parameter processing at this level. In addition, users can invoke tasks at the business layer and display the results of tasks in different ways on this interface. As for the business layer, it is a key link in the system framework and plays a bridging role. The driver layer is composed of a series of data access, processing, spatial analysis, and visualization components, which can provide editing, query, add and delete operations for the data layer downward, and provide specific functions for the performance layer and business layer upward. The data layer is mainly composed of two modules, Geodatabase and Access, which are mainly responsible for storing corresponding information or data. Among them, image base map, administrative division, power transmission line, and micro-terrain factors are stored in Geodatabase for management, while meteorological data and galloping data are stored in Access for management.
4.3. Database design
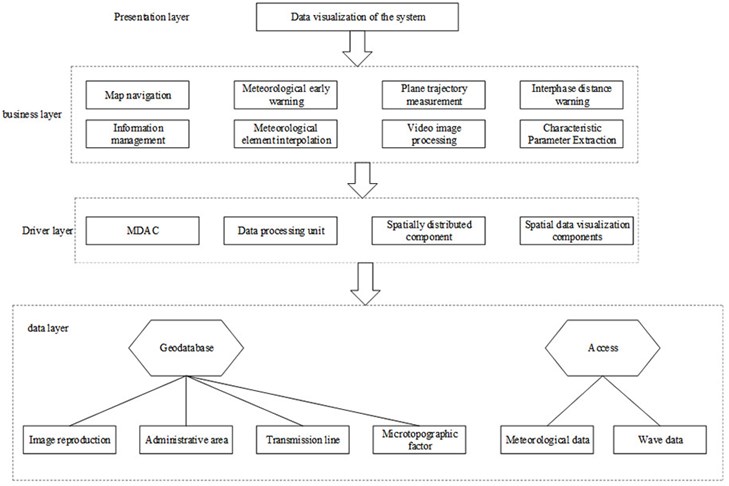
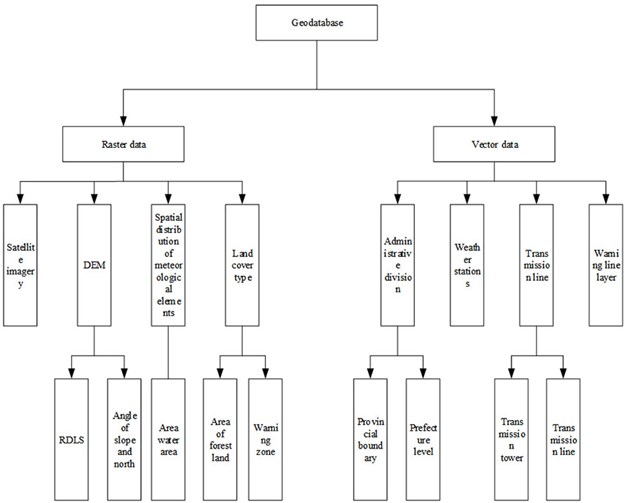
Database design is divided into geographic database design and relational database design. Although there are two types of data in the geographic database (grid data and vector data), these data need to be uniformly projected to the same projection coordinate system and follow the EGM96 (geoid height, geoidal undulation) elevation standard. The source data of grid type includes satellite image, digital elevation model (DEM), land cover type, spatial distributions of meteorological elements, and other information. Through further calculation of DEM, information of relief degree of land surface (RDLS), angle between urban direction and covered area can be obtained. Through calculation of land cover type, regional water area, and area forest area of active research target can be obtained. Through calculation and analysis of spatial distribution of meteorological elements, regional information of time warning can be obtained. Vector type of source data include administrative divisions, weather stations, transmission line and warning lines layer data. The research target of provincial boundary and prefecture level information can be understood through the analysis of the administrative division data calculation. Through the study of target calculation and analysis of data for transmission lines, transmission tower, and power line information can be obtained. The specific design of the geographic database is shown in Fig. 3.
Fig. 3Geographical database framework design
For the relational database, it is responsible for storing the site location information corresponding to the galloping monitoring data and meteorological monitoring data, and the information need to be associated query during the visualization. The maximum number of stations with meteorological time data of the research target is 119, and all stations are stored in the form of table. The format of table name is “site ID+ name”, as shown in Table 2.
In Table 2, ObsTime indicates the observation time, and the fixed string format is YYYYMMDDHH. The maximum wind speed per hour is represented by WindSmax. Hourly precipitation was represented by Pre, hourly minimum temperature and average temperature were represented by Tmin and Tmean respectively. The wind direction Angle corresponding to the maximum wind speed is represented by WindD. When there is still wind, it can be marked with a serial number of 999017. The hourly relative humidity is denoted by RH. The galloping monitoring data involve different galloping monitoring positions and need to be collected from multiple galloping monitoring positions. The monitoring scope of all monitoring points belongs to the first wire, such as N3_N4. When storing these galloping monitoring data, it also needs to be processed in the form of tables, as shown in Table 3.
Table 2Meteorological database design
Field | ObsTime | WindSmax (m/s) | Pre (mm) | Tmin (℃) | Tmean (℃) | WindD (°) | RH (%) |
String | Float | Float | Float | Float | Int | Int | |
The sample | 2021011510 | 4.1 | 0 | 7.2 | 7.2 | 106 | 85 |
Table 3Galloping database design
Field | ObsTime | L_dY (m) | L_AmpY (m) | L_FreY (Hz) | C_dY (m) | C_Ampy (m) | C_FreY (Hz) | R_dY | R_Ampy | R_FreY |
String | Float | Float | String | Float | Float | String | Float | Float | String | |
The sample | 20201109095714040 | 0.145 | 0.188 | 1.042 | 0.095 | 0.081 | 0.378 | 0.923 | 0.378 | 0.924 |
In Table 3, the sampling frequency of galloping monitoring data is set at 25 Hz, i.e., data will be refreshed every 40 mm to generate new galloping monitoring data. The content of Table 3 is set as follows. The observation time is ObsTime, and the fixed string format is yyyymmddhhMMssmmm. The galloping displacement in the Y direction is represented by L_dY, which is the measurement result of the spacer bar centroid plane in each frame image. The amplitude is represented by L_AmpY, which is half of the peak value of the periodic sliding window. The frequency is represented by L_FreY, which is the result of spectrum analysis. L, C, and R in the table represent the spacer positions of amplitude values on the left, middle, and right three-phase wires, respectively. Columns in the table can be expanded to store multiple -direction data.
5. Realization of online monitoring and early warning system for transmission line galloping
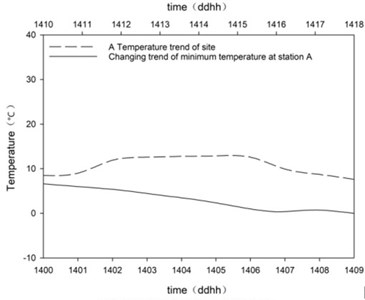
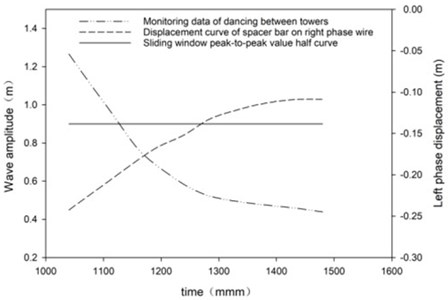
In order to verify the feasibility of the system design, the effect of online monitoring and early warning on transmission line galloping was tested. Firstly, the time data of national meteorological stations and the galloping data of video detection were taken as research objects to carry out information management. The specific steps are as follows. First, monitoring data were imported. Second, the specified site and period were queried. Third, on the basis of historical data, line charts were drawn. Parameters including average relative humidity, minimum temperature, wind direction corresponding to maximum anemometer, and reserved rainfall were observed. Fig. 4(a) shows the temperature trend of site A and the lowest temperature trend from 10:00 to 1800 on January 14, 2021. Fig. 4(b) plots the trend of wire galloping monitoring data between towers of N3_N4, the displacement of the spacer bar on the right wire, and the curves of half of peak-to-peak value of the sliding window.
It was seen from Fig. 4(a) that the minimum temperature dropped to 0 ℃ at 16:00. Fig. 4(b) also shows the specific trend of galloping monitoring data, confirming that the system designed fully displayed the online galloping monitoring situation of transmission lines. Secondly, the trajectory and characteristic parameters of the galloping plane of the transmission line were extracted, and the displacement sequence analysis results of the spacer on the three-phase wire in the and directions were obtained, as shown in Fig. 5.
Fig. 4A temperature change curve of station and trend of galloping data of video monitoring
a)
b)
Fig. 5Plane trajectory extraction of video monitoring
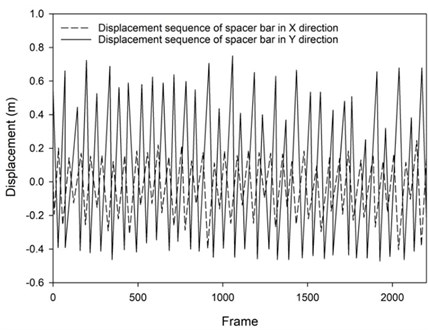
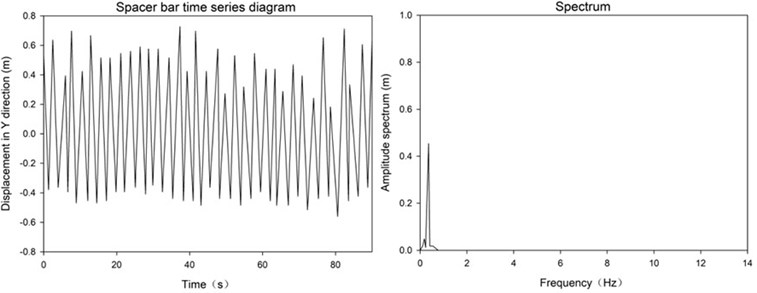
It was seen from Fig. 5 that the motion of the spacer bar was periodic, and the motion amplitude in the direction was greater than that in the direction. Therefore, spectrum analysis of direction displacement was required, and the results obtained are shown in Fig. 6.
Fig. 6Spectrum analysis results of galloping displacement
Finally, based on image processing of galloping monitoring video and extraction of galloping feature values, the galloping warning system of transmission lines was tested, and the final results are shown in Table 4. Among them, the standard of the galloping safety factor is as follows: the level 1 warning standard was 0-1.0, the level 2 warning scale was 1-1.2, the level 3 warning scale was 1.2-1.5, and the level 4 standard was 1.5 to 2.0.
It was seen that in the case of no significant difference in external meteorological conditions of the same conductor, the amplitude of b phase conductor was 1.625 m, and the corresponding galloping safety factor was 1.568. In this case, the galloping warning intensity of the transmission line was level 4 and close to the level 3 warning standard.
Table 4Warning results of the safety factor of galloping phase
Tower no. | Data length (s) | Traverse spacing (m) | Safe spacing (m) | A phase amplitude | B phase amplitude | Safety factor | The warning level |
N3_N4 | 2186/87.4 | 6.7 | 2.2 | 1.625 | 1.625 | 1.568 | 4 |
6. Conclusions
In general, this paper firstly analyzed the frequency spectrum of the flapping displacement sequence of transmission lines, which lays a foundation for the extraction of flapping characteristic parameters, and then constructed the corresponding mathematical model. Secondly, the early warning criteria of galloping were given under different conditions: the level 1 early warning standard was 0-1.0, the level 2 warning scale was 1-1.2, the level 3 warning scale was 1.2-1.5, and the level 4 early-warning standard was 1.5-2.0, which provides a basis for the subsequent early-warning judgment. Finally, the framework of the online monitoring and early warning system for transmission line galloping and the database were designed. The system was verified by taking YN province as an example. It was found that the safety coefficient was 1.568, belonging to the phase state, i.e., and the intensity of transmission line galloping was low in this case. In this system, the flashover problem will not occur; however, bolt loosening or metal wear may still occur, which requires attention.
References
-
S. D. Yu, B. X. Ye, Y. Q. Feng, T. T. Yi, X. J. Han, and C. Shi, “Research on online monitoring technology of overhead transmission line based on front-end identification,” Communications Power Supply Technology, Vol. 38, No. 3, pp. 44–46, 2021.
-
Y. Yang, “Development and application of online monitoring system for 110 kV transmission line in Shengli Oilfield,” Electronic Design Engineering, Vol. 29, No. 1, pp. 157–162, 2021.
-
G. Q. Ye, X. Bao, and Z. Y. Cai, “Research on intelligent on-line monitoring of high voltage transmission line,” Microcomputer Application,” Application of Microcomputer, Vol. 36, No. 12, pp. 97–99, 2020.
-
S. Zhang, F. Cui, X. Liu, B. Huo, A. Zhou, and R. Shi, “Galloping behavior analysis of transmission line with thin ice accretions,” Vibroengineering Procedia, Vol. 20, pp. 30–35, Oct. 2018, https://doi.org/10.21595/vp.2018.20274
-
H. R. Zeng, X. Y. Mao, X. H. Ma, Q. Yang, H. Huang, and Z. H. Gao, “Design and application of intelligent fault monitoring and early warning system for transmission lines,” Electrotechnical Engineering, Vol. 2021, No. 5, pp. 50–52, 2021.
-
X. F. Liu, Y. P. Wang, J. H. Yang, H. H. Zhang, and X. S. Gong, “Development of transmission line online monitoring device and its application in communication networking,” Electronic Production, Vol. 2020, No. 21, pp. 91–92, 2020.
-
Y. L. Duan, “Construction and application of geological disaster monitoring and early warning system for transmission line based on Beidou System,” Engineering Construction and Design, Vol. 2021, No. 2, pp. 153–154, 2021.
-
L. Chen, “Analysis of transmission line real-time monitoring technology in power system,” Electronic Components &Information Technology, Vol. 4, No. 8, pp. 82–83, 2020.
-
F. Guo, Z. J. Fan, and W. Z. Yu, “Research ongallopingmonitoring technology of 110 kV transmission line based on Power Internet of Things,” Electrotechnical Engineering, Vol. 2020, No. 22, pp. 113–115, 2020.
-
Z. H. Zhang, J. J. Yan, L. Y. Zhang, C. H. Liu, and T. Y. Shi, “Transmission line dancing monitoring system based on Beidou ground reinforcement system,” Electric Power Information and Communication Technology, Vol. 18, No. 10, pp. 42–47, 2020.
-
Q. Li, X. H. Yang, Z. S. Liu, Z. Li, S. J. Zhao, and X. G. He, “Transmission line dancing grading warning scheme based on grey cluster analysis,” Electric Measurement and Instrumentation, Vol. 57, No. 17, pp. 45–51, 2020.
Cited by
About this article

This study was supported by multimode adaptive intelligent fusion terminal for transmission line monitoring and its data heterogeneity analysis and application (51051K212001).
The datasets generated during and/or analyzed during the current study are available from the corresponding author on reasonable request.
Kai Dong, Qingbin Shen and Chengyi Wang contributed the central idea, analysed most of the data, and wrote the initial draft of the paper. Yanwu Dong and Ziqiang Lu contributed to refining the ideas, carrying out additional analyses, and finalizing this paper.
The authors declare that they have no conflict of interest.
