Abstract
Aiming at the problems of poor resolution and low precision in traditional health diagnosis of Marine engine room equipment, this paper proposes a health diagnosis method of intelligent Marine engine room equipment based on BP neural network and D-S evidence theory. Firstly, the time-domain parameters of the obtained acceleration signal are extracted and the energy in frequency domain after wavelet decomposition is calculated. Then the eigenvectors of time domain and wavelet packet energy were constructed respectively, and the normalized processing was input into two BP neural networks to obtain the classification results. Finally, the fault classification results in time domain and frequency domain are combined with the D-S evidence theory and output diagnosis. Through experimental analysis and verification of rolling bearing data from electrical Engineering Laboratory of Case Western Reserve University, the accuracy of the proposed method is better than that of time domain and frequency domain analysis alone, which improves the accuracy and reliability of fault classification.
Highlights
- Extract the time domain parameters of the obtained vibration signal and calculate the frequency band energy after wavelet decomposition.
- The feature vectors of time domain and wavelet packet energy are constructed respectively, and the classification results are obtained by inputting two BP neural networks after normalization processing.
- Based on BP neural network and D-S evidence theory, a decision level fusion health diagnosis method is proposed, which can be combined with the DCS components of the ship intelligent integration platform and the integrated management and control system of intelligent engine room auxiliaries.
1. Introduction
With the continuous improvement of the intelligent level, the intelligent ship has become the mainstream development direction of the ship in the future, which also puts forward higher requirements for the health management of the equipment in the ship engine room. In addition, the electromechanical equipment in the engine room is very complicated. The bad working environment and short-time high-power operation conditions can easily lead to equipment failure and irreversible damage of the equipment [1]. Therefore, it is necessary to extract fault signal for health diagnosis.
Abnormal vibration is the earliest indication of equipment failure. Some slight mechanical defects or damages will cause abnormal vibration of equipment in the engine room. At present, the on-line vibration monitoring system or hand-held vibration detection device used in the ship engine room is mainly used to judge the operation status of the equipment manually, and it is difficult to realize the automatic identification and early warning function of the equipment fault in the engine room.
From the overall demand analysis of intelligent ship development, different feature vectors constructed based on time domain parameters and energy distribution after wavelet decomposition are respectively used as the input of two BP neural networks. Based on the basic probability assignment of statistical prior information and D-S evidence theory, the health diagnosis model of Marine engine room equipment is designed to improve the accuracy, reliability and linearity of health diagnosis of engine room equipment, so as to complete the auxiliary decision-making tasks of fault diagnosis and visual maintenance.
2. Introduction to the basic model
2.1. BP neural network
BP neural network is a kind of multilayer feedforward neural network, including input layer, hidden layer and output layer. There are two kinds of signal, function signal and error signal, in the forward and back propagation of the network. In forward transmission, the input sample is processed layer by layer through each hidden layer until the output layer. When the output does not conform to the expectation, it turns into error backpropagation, which transmits the output back to the input layer layer by layer through the hidden layer and distributes the error to all units of each layer, so as to obtain the error signal of units of each layer and adjust the weight of each unit [2]. The structure of BP neural network is shown in Fig. 1.
Fig. 1Structure of BP neural network
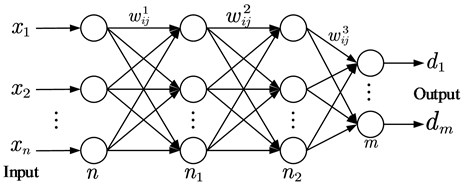
In the BP neural network, assume that the input vector is dimension vector , and the expected output is , Calculate the output of the network under input:
Correct the weights with the following formula: , until the output is as expected.
2.2. D-S evidence theory
Evidence theory is a kind of uncertainty reasoning method. It transforms the uncertainty of propositions into the uncertainty of sets, and forms the mathematical theory of evidence deduction. It provides a powerful tool for the representation and fusion of uncertain information at decision level [3]. Under the identification framework , function is defined, if function satisfies:
I call it function of defined on . The set function is the confidence given to subset itself. Define confidence function: if function satisfies:
I call it confidence function defined on . Set function means that confidence is assigned to the subset and all subset , is the sum of the probability measures of all subsets of . Suppose , is two trust functions under the same recognition framework, and , assigns values to their corresponding basic probabilities respectively, then is:
where, symbol represents Dempster combination rule; is the normalization factor, after generating the combined quality function, the corresponding confidence function and likelihood function can be further obtained, so as to obtain the combined confidence interval and complete the reasoning of evidence.
3. Construction of feature vectors
3.1. Construction based on feature vector of time domain parameters
In the fault diagnosis of engine room equipment, the basic digital characteristics of time domain signals and their probability distribution characteristics are generally used for analysis and diagnosis. Through the analysis and recognition of vibration signal time domain waveform, can effectively distinguish the failure of mechanical equipment, Digital filtering is performed on the original vibration time domain signal , collected, and the calculation formula of the dimensionless characteristic parameters extracted in the time domain is shown in Table 1[4].
Table 1Time domain characteristic quantity
Parameter | Expression | Parameter | Expression |
Root mean square | Kurtosis | ||
Peak | Pulse index | ||
Margin index | Peak index | ||
Waveform index | Kurtosis index |
Select the dimensional and non dimensional parameters in the time domain information to construct the real-time monitoring eigenvector of vibration acceleration: .
The feature vector contains rich information on vibration state, which can comprehensively reflect the amplitude and energy of time-domain vibration and the time-series distribution of time-domain signals. When it changes weakly, the vibration state will be greatly different [5].
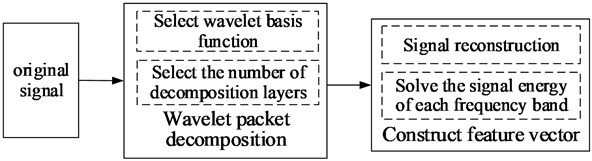
3.2. Feature vector construction based on wavelet packet decomposition
Wavelet packet is an important part of wavelet analysis theory, which is widely used in non-stationary signal feature detection and fault diagnosis. Wavelet packet transform has higher frequency resolution and lower time resolution in the low frequency part, and higher time resolution and lower frequency resolution in the high frequency part. When different faults occur, the wavelet packet energy distribution of the vibration signal of the equipment is different. The corresponding energy at the fault characteristic frequency is large, while the energy at other frequencies is small. Therefore, after the wavelet packet is decomposed into several frequency bands, the energy in each frequency band can represent the failure of the equipment [6].
The wavelet packet in frequency domain is decomposed into three layers and eight bands. eight parameters of energy in each frequency band of wavelet decomposition are calculated to form energy feature vector Energy calculation formula is as follows:
where, (1, 2,…, , 1, 2,…, ) is the amplitude of discrete points of reconstructed signals in each frequency band, is the node value of wavelet packet in layer , and the feature vector is constructed based on the relative energy parameters of each frequency band after wavelet decomposition:
where, is the normalized feature vector of single sample, and is reconstructed signals of the third layer.
Fig. 2Wavelet decomposition process
4. Experimental verification
4.1. Experimental data set
In order to verify the effectiveness of the fault diagnosis method combined with BP neural network and evidence theory, data collected by the driver accelerometer in the rolling bearing data collection of Western Reserve University bearings DE, he normal reference data of Normal_0, inner ring fault IR007_0, rolling body fault B007_0 and outer ring fault OR007@6_0 of the motor at 1797 rpm were selected [7].
After the data is imported, the vibration data is preprocessed by filtering and denoising, and the data is divided into 4096 data points as an example. 40 feature vectors of normal data and 120 feature vectors of inner ring fault, rolling body fault and outer ring fault were constructed. A total of 400 sample data were collected. Then, the time domain characteristic parameters are extracted to construct the time domain characteristic parameter vector ; Then, the multilayer wavelet transform is applied to the signal, and the energy value of each frequency band is extracted to construct the energy characteristic parameter vector of the wavelet packet. Finally, the samples were randomly divided into 360 training sets and 40 test sets.
After sample division, two BP neural networks are established for fault diagnosis of time domain characteristic parameters and wavelet packet energy respectively. In order to improve the accuracy of diagnosis, D-S is used for decision level fusion diagnosis, and the fault diagnosis model is shown in Fig. 3.
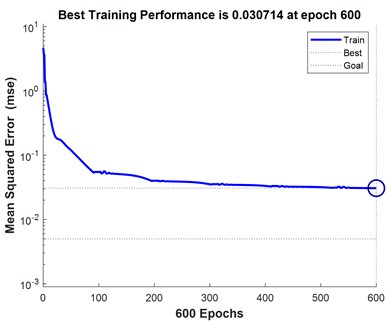
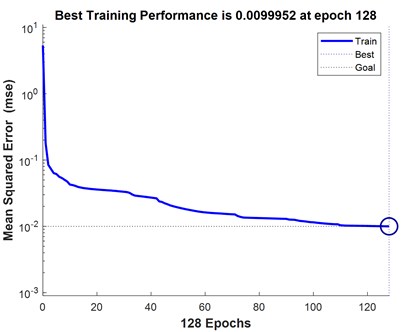
The normalized samples are trained in BP neural network, considering moderate computational complexity and short simulation time. It is very important to choose reasonable hidden layer structure. According to the empirical formula A for the number of hidden layer nodes, there are and . Then gradually test the number of nodes in the hidden layer, and find that the performance is the best when the number of nodes is 19 and 16. The neural network error variation diagram is shown in Fig. 4.
Fig. 3Fault diagnosis model
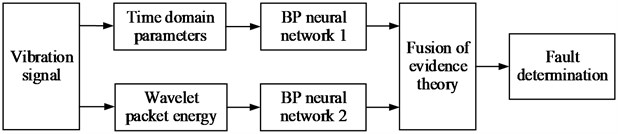
Fig. 4Error variation diagram of networks 1 and 2
4.2. Research and analysis of results
According to the output results of neural network, the identification framework of fault diagnosis is established: , where is in normal state, is the inner ring failure, is the fault of the rolling body, is the outer ring fault, Then the construction of BP neural network evidence body , , are the evidence bodies constructed by network 1 and Network 2 respectively. Then determine the trust allocation function in identification frame [8]. The basic probability distribution of each evidence body is shown in Table 2. Finally, the diagnosis results are fused according to D-S evidence theory, and the basic probability distribution and diagnosis results obtained are shown in Table 3.
Table 2Partial diagnosis results of BP neural network
Sample | Diagnosis | |||||
Network 1 | 0.079617 | 0.482392 | 0.042378 | 0.312278 | 0.083333 | Not sure |
0.062616 | 0.041671 | 0.140851 | 0.671527 | 0.083333 | Outer ring fault | |
0.045117 | 0.062592 | 0.110387 | 0.698569 | 0.083333 | Outer ring fault | |
0.044536 | 0.082493 | 0.479469 | 0.310166 | 0.083333 | Not sure | |
Network 2 | 0.079617 | 0.642320 | 0.191303 | 0.048854 | 0.022916 | Not sure |
0.010703 | 0.012293 | 0.012293 | 0.959022 | 0.022916 | Outer ring fault | |
0.049032 | 0.048854 | 0.048949 | 0.927955 | 0.022916 | Outer ring fault | |
0.048973 | 0.048911 | 0.048854 | 0.928052 | 0.022916 | Outer ring fault |
Table 3Diagnosis results after network fusion
Sample | Diagnosis | |||||
1 | 0.073548 | 0.809245 | 0.055996 | 0.059151 | 0.002058 | Not sure |
2 | 0.026924 | 0.011365 | 0.024927 | 0.935428 | 0.001353 | Outer ring fault |
3 | 0.010703 | 0.012293 | 0.016747 | 0.959022 | 0.001233 | Outer ring fault |
4 | 0.019031 | 0.025312 | 0.091114 | 0.862334 | 0.002206 | Outer ring fault |
4.3. Accuracy analysis
After obtaining the classification results of time domain characteristic parameters and wavelet packet energy, in order to intuitively display the fusion effect of D-S evidence theory, the prior information is counted and fault classification is made as shown in Figs. 5-6.
Fig. 5Time domain and wavelet statistical classification diagram
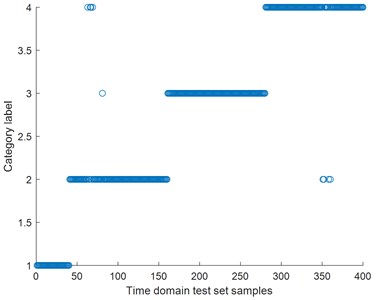
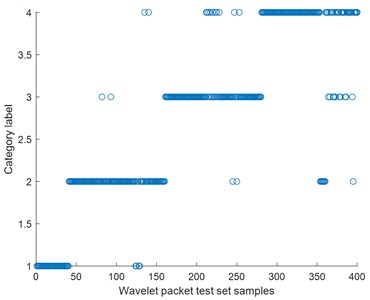
Fig. 6D-S fusion statistical classification diagram
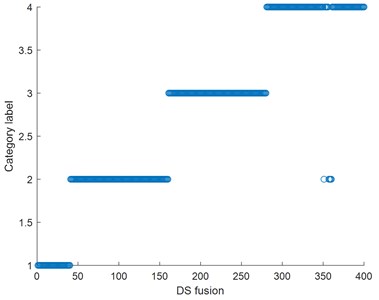
Combining the above classification diagram, calculate the time domain, the wavelet analysis and evidence fusion accuracy, as shown in Table 4, through the data contrast, overall fault diagnosis of bearing, the time domain analysis of accuracy is higher than the accuracy of wavelet analysis, after D-S fusion, fault classification accuracy than single time domain or wavelet analysis to better [9].
Table 4Fault diagnosis accuracy rate
Fault type | Wavelet accuracy | Time accuracy | D-S accuracy |
Normal state | 100 % | 100 % | 100 % |
Inner ring fault | 97.5 % | 95.8 % | 99.16 % |
Ball wear | 93.3 % | 100 % | 100 % |
Outer ring fault | 86.7 % | 95.8 % | 97.5 % |
5. Conclusions
Based on BP neural network and D-S evidence theory, the health diagnosis method of intelligent ship engine room equipment established in this paper can effectively extract signal characteristic information, and provide decision basis for the health management of complex equipment in intelligent ship engine room in the future. The time domain characteristic parameters and wavelet decomposition frequency band energy extracted and calculated by the neural network can be used for preliminary diagnosis of the fault separately. Then the neural network output combined with the information fusion method of D-S evidence theory can effectively improve the accuracy of diagnosis. At the same time, the system is verified by the bearing data set of Western Reserve University. The results show that the diagnosis method can effectively solve the problem of probability distribution of bearing fault diagnosis, and has better diagnosis accuracy, robustness and system reliability.
References
-
Shuhua Hong and Nong Jiao, “Status quo and prospect of Marine auxiliary information,” Journal of Marine Engineering, Vol. 33, No. 4, pp. 88–92, 2017.
-
Peng Yang, “Simulation of a ship power station simulator research,” Jiangsu University of Science and Technology, 2021.
-
Xia Fei, Meng Juan, Yang Ping, Yuliang Qian, Hanzhou Ding, and Haifeng Tie, “Improved D-S evidence theory in vibration fault diagnosis application,” Journal of Electronic Measurement and Instrument, Vol. 32, No. 7, pp. 171–179, 2018.
-
Yang Peng, “Research on a ship type power station simulation simulator,” Jiangsu University of Science and Technology, 2021.
-
Shiqiang Wang, Min Hu, Wenbin Chen, Gang Yang, Jiajie Ye, and Weilin Deng, “Application of polynomial fitting method based on time domain characteristic quantity in fault diagnosis,” in National Natural Gas Academic Annual Conference Proceedings, pp. 2901–2906, 2016.
-
Zuopeng Lu, Jian Luo, Xiaotong Yang, Juncong Su, Xiaoyu Li, and Rui Zhan, “Application of HHT time-frequency analysis method based on wavelet packet and EMD in bearing fault diagnosis of aviation tester,” Measurement and Control Technology, pp. 1–9, 2021.
-
Gang Zhang, Fuqing Tian, Weige Liang, and Bo She, “Rolling bearing fault diagnosis based on improved d-s evidence theory,” Journal of Naval University of Engineering, Vol. 31, No. 4, pp. 42–47, 2019.
-
Weixiao Xu, Jiwen Tan, and Yan Wen, “Research on rolling bearing fault diagnosis method based on BP neural network and D-S evidence theory,” Machine Tool and Hydraulics, Vol. 42, No. 23, pp. 188–191, 2014.
-
Shuiquan Lin, “Research on rolling bearing fault diagnosis of petrochemical unit based on BP neural network and D-S evidence theory,” South China University of Technology, 2018.
About this article

