Abstract
This study aims to investigate the barrier effect of front wall-soil-barrier interactions in barrier sheet pile wharf structures. Berth 32 of the Jingtang Port was taken as the prototype structure, and the prototype observation experiment, centrifugal model test, and numerical calculation analysis were performed to study the influence of the length of the barrier pile, the spacing between wall piles, and the net spacing of the barrier pile on the barrier effect. The results show that, to maximize the barrier effect, the ratio of the pile length of the full barrier pile to the depth of the front wall should be between 1.0 and 1.1. To maximize the barrier effect, the top elevation of the semi-barrier pile should not be excessively low. When the bottom elevation is fixed, the ratio of the length of the semi-barrier pile to the depth of the front wall is approximately 0.7. The change in the wall pile spacing has a considerable impact on the barrier effect. Moreover, has a logarithmic relationship to the horizontal displacement of the front wall. When exceeds 3 m, the change in the barrier effect can be ignored. The part of the earth pressure shared by the sea and land sides of the barrier pile to the soil between the barrier pile and the barrier pile has a logarithmic relationship to the net spacing of the barrier pile. The smaller the , the better the barrier effect. When exceeds 2 m, the earth pressure shared by the two parts tends to be average, and the barrier effect can be ignored.
Highlights
- When maximizing the barrier effect, the pile length of the full-barrier pile should not be excessive. It is most appropriate to control the ratio 𝑁 of the pile length of the full-barrier pile to the depth of the front wall to 1.0-1.1.
- The distance 𝐷 between wall piles is logarithmic to the horizontal displacement of the front wall. In terms of the stability of the front wall, the smaller the distance 𝐷 between the wall piles, the better the stability of the front wall in the soil, and the lower the elevation of the excavated mud surface at the front of the front wall.
- The part of the earth pressure shared by the sea and land sides of barrier piles on the soil between barrier piles has a logarithmic relationship to the net spacing 𝐿 of barrier piles: the smaller the 𝐿, the better the barrier effect.
1. Introduction
The sheet pile wharf, one of the three wharf structural forms, is widely used because of its several advantages such as simple structure, low cost, and convenient and rapid construction. However, because of the thin-walled structural characteristics of the traditional sheet pile wharf and its limited flexural stiffness [1], it is contrary to the “deep-water, large-scale, and modernized” development direction of port wharves; thus, its application scenario is limited. Two approaches can be used to increase the excavation depth of the wharf apron to satisfy the demand for deep-water ship berthing. The first is to increase the bending stiffness of sheet pile by increasing the section size of the sheet pile, but this can cause instability at the embedded end of the sheet pile. The second approach is based on the horizontal stress characteristics of sheet pile, and involves reducing the earth pressure at the back of the sheet pile because, which is more reliable. Therefore, in 2002, the Design Institute of China Communications Construction Co., Ltd. proposed the type of structure of deep-water barrier sheet pile wharf [2]-[3] in which a row of rectangular cast-in-place piles (barrier piles) is set on the land side of sheet piles to reduce the horizontal earth pressure on the sheet piles through the barrier effect. The aim was to meet the requirements for increasing the excavation depth of the sheet pile front [4].
Through nearly two decades of development, from Jingtang Port [5]-[6] to Zhoushan Port [7] and then to Yancheng Port [8], barrier sheet pile wharf structures have been constructed in major ports in China, from 100,000 to 200,000 and then to 300,000 tons, respectively. The barrier effect of the barrier pile on the land side of the front wall is evident, but no qualitative analysis of the impact of the barrier effect has been conducted. There are serious deficiencies in the mechanism of the barrier effect, and the design parameters urgently need to be optimized.
To study the law of the barrier effect of barrier sheet pile wharves, a prototype monitoring experiment, centrifuge model experiment, and numerical simulation calculation were performed to systematically study the influences of wall pile spacing, barrier pile spacing on the load transfer mechanism, a sensitivity analysis of the main parameters was also conducted. The results provide a reference basis for structural optimization de-sign and the establishment of a theoretical calculation method.
2. Prototype monitoring experiment
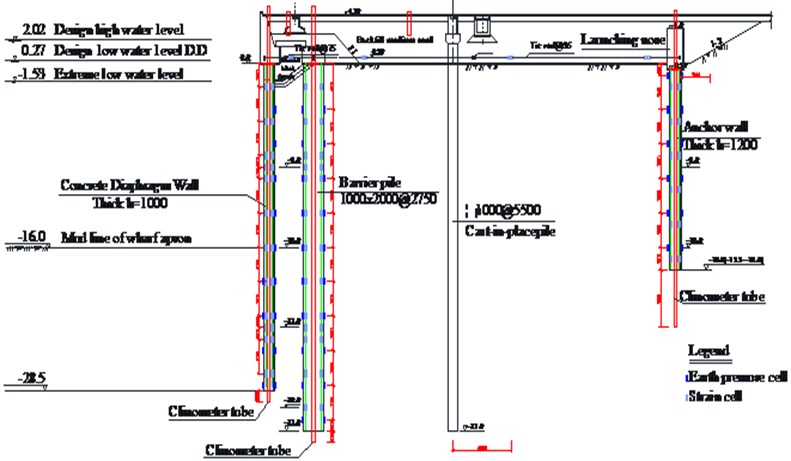
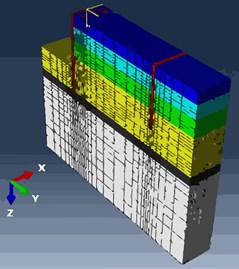
Taking the berth 32 of the Jingtang Port as the prototype case [9]-[10], the wharf is a 100,000 ton general bulk cargo berth wharf that adopts the diaphragm wall full barrier sheet pile structure. According to the engineering geological conditions, three prototype observation sections were selected (shown in Fig. 1). Among them, the YK29 borehole with the best geological conditions of Section 2 is close to berth 31. Section 3 is near the middle of berth 32. Section 4 is close to berth 33. The layout of each section is shown in Fig. 2. The anchor wall of Section 2 is 15.5 m deep, and the anchor walls of Sections 3 and 4 are 18.0 m deep. The other arrangements are the same.
Fig. 1Layout plan of observation instrument
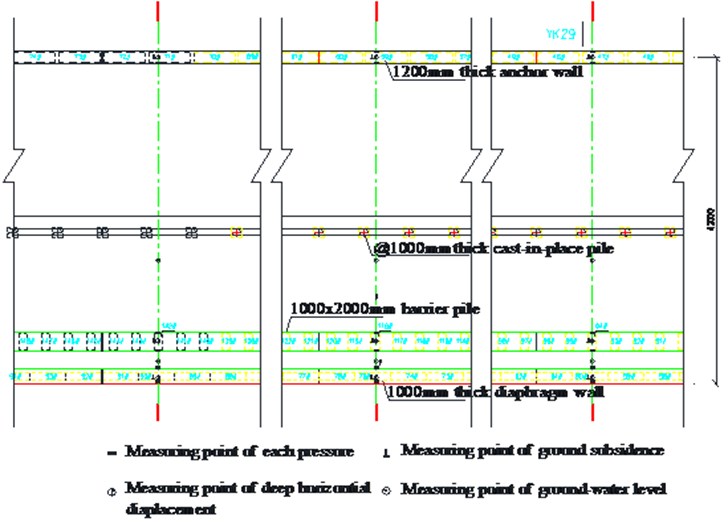
2.1. Observation contents
All monitoring instruments were buried in the construction process. In the observation stage, from the initial value measurement to the dredging of the wharf apron to the stacking of the wharf surface, the main contents of the observation included the following.
Fig. 2Layout of section observation instrument
2.1.1. Deformation and displacement
A mobile inclinometer was used to observe the horizontal deformation of the wall body and pile body of the diaphragm wall, barrier pile, and anchor wall in the dredging stage and use stage of the wharf apron. Displacement observation points were embedded in the front wall, barrier pile, and anchor wall to observe the horizontal displacement of anchor points on the front diaphragm wall, barrier pile, and anchor wall at the dredging stage and use stage of the wharf apron.
2.1.2. Internal force of tie rod
The strain gauges were used to measure the internal force changes of the small tie rod with a diameter of 75 mm between the front wall and the barrier pile and the large tie rod with a diameter of 95 mm between the barrier pile and the anchor wall at the dredging stage and use stage of the wharf apron. The influence of tie rod tension on the stress of the structure was analyzed [11].
2.1.3. Earth pressure
The earth pressure cells were installed on the sea and land sides of the front diaphragm wall, barrier pile, and anchor wall by using the cylinder jacking method [12], and the earth pressure distribution and changes were observed on the sea and land sides of the front diaphragm wall, barrier pile, and anchor wall at the dredging stage and use stage of the wharf apron.
2.1.4. Vertical reinforcement stress and bending moment [13]
The vertical reinforcement stresses on the sea and land sides of the front wall, barrier pile, and anchor wall were observed by cutting the connecting reinforcement in the front diaphragm wall, barrier pile, and anchor wall.
2.2. Observation location, workload, and frequency
Table 1 shows the locations of observation points, observation contents, and work-load of each section, and Table 2 provides the observation frequency of each stage.
Table 1Location, content, and workload of observation points
Section | Wall/Pile | Point | Observation Contents and Workload | ||||
Deformation | Lateral deformation | Earth pressure | Vertical reinforcement | Tie rod tension | |||
(Point) | (Hole) | (Number) | (Number) | (Number) | |||
2 | Front Wall | 60 | 1 | 1 | – | 20 | Rear-2 |
Barrier | 94 | 1 | 1 | – | 22 | ||
Anchor Wall | 47 | 1 | 1 | – | 10 | ||
3 | Front Wall | 75 | 1 | 2 | 10 | 20 | Rear-2 |
Barrier | 118 | 1 | 2 | 16 | 22 | ||
Anchor Wall | 59 | 1 | 2 | 9 | 12 | ||
4 | Front Wall | 90 | 1 | 1 | 10 | 20 | Front-1 Rear-2 |
Barrier | 142 | 1 | 1 | 16 | 22 | ||
Anchor Wall | 71 | 1 | 1 | 9 | 12 | ||
Total | 9 | 12 | 70 | 160 | 7 | ||
Table 2Observation frequency
Stage | Date | Horizontal Displacement | Lateral Deformation | Earth Pressure | Vertical Reinforcement Stress |
Before Excavation | 03/01/2005-06/30/2005 | Once/7days | Once/7days | Once/7days | Once/7days |
Excavation Period | 07/01/2005-12/14/2005 | Once/2days | Once/2days | Once/2days | Once/2days |
Service Life | 12/15/2005-12/31/2019 | Once/7days | Once/7days | Once/7days | Once/7days |
3. Centrifugal model experiment
Owing to the limitations of site conditions, interference of construction conditions, and measurement methods, the observation and research contents could not be completed. Therefore, the centrifugal model experiment was used to supplement the data.
In the centrifugal model experiment [10]-[11], the 400 gt geotechnical centrifuge of the Nanjing Water Conservancy Research Institute was used, and the effective size of the model box used in the experiment was 1100×40×600 mm with 10 cm thick plexiglass on one side, which was the window for photographing and monitoring the model during the experiment. Six schemes were studied. The structure and working condition combinations of the test schemes are shown in Tables 3 and 4.
Table 3Structure and working condition combination of centrifugal model test scheme (I)
Scheme | Front wall | Barrier pile | Wall and barriers | ||||||
Thickness | Top | Bottom | Section | Top | Bottom | Distance | Distance | Connection | |
m | m | m | m×m | m | m | / m | / m | – | |
1 | 0.8 | 4.2 | –27.0 | 2.0×1.0 | 0.5 | –32.0 | 3.00 | 2.0 | Parapet |
2 | 1.5×1.2 | 0.0 | –32.0 | 2.70 | 4.5 | Ф95 Tie Rod | |||
3 | 1.5 | 4.2 | –30.0 | – | – | – | – | – | – |
4 | 1.1 | 4.0 | –22.5 | – | – | – | – | – | – |
5 | 1.0 | 4.2 | –28.5 | 1.5×1.3 | 0.0 | –32.0 | 2.75 | 3.0 | Parapet |
6 | 1.0 | 4.2 | –28.5 | 2.0×1.0 | 0.0 | –32.0 | 2.75 | 3.0 | Ф75 Tie Rod |
Table 4Structure and working condition combination of centrifugal model test scheme (II)
Scheme | Anchor wall | Anchor wall connect | Elevation of mud surface | Water level elevation | Wharf surface load | Geological section | ||||
Thickness | Top | Bottom | Diameter | Distance | Front | Behind | ||||
m | m | m | mm | m | m | m | kPa | kPa | ||
1 | 1.2 | 2.0 | –18.0 | 95 | 1.5 | –17.0 | –1.53 | – | – | YK2 |
2 | 100 | – | – | |||||||
3 | 105 | – | – | |||||||
4 | 1.1 | 1.8 | –11.5 | 90 | 1.7 | –13.0 | –1.40 | – | – | |
5 | 1.2 | 3.0 | –15.0 | 95 | 1.5 | –17.0 | –1.53 | 20 | 20 | |
6 | 80 | 80 | ||||||||
The foundation soil layer was the prototype YK2 section, in which the particle composition and relative density of sandy soil were taken as the control standard. For cohesive soil, the foundation strength index was taken as the control index. This means that the stress state of the foundation soil layer was like that of the prototype. The following consolidation methods were adopted. The soil weight required for each layer of soil was obtained according to the bulk density and thickness. Then, it was sliced, soaked, and stirred into a slurry and consolidated on a centrifuge from bottom to top. The thickness of each layer was simulated according to the similar scale of the model test. After the foundation soil layer formed, the harbor basin was formed according to the design elevation. The front diaphragm wall, barrier pile, and anchor wall were installed, and the pull rod was connected. Finally, the upper backfilling was simulated to form the test model [16]. An indoor test was conducted on the cohesive soil layer after the centrifugal model test, and the test results are shown in Table 5.
Table 5Main physical and mechanical indices of cohesive soil layer of model foundation after test
Soil layer name | Moisture content | Wet density | Dry density | Void ratio | Saturation | Coefficient of compressibility | Compression modulus | Model scheme |
% | g/cm3 | g/cm3 | – | % | MPa-1 | MPa | ||
②2 Muddy Clay | 43.4 | 1.82 | 1.27 | 1.142 | 100 | 0.77 | 2.8 | Undisturbed |
33.7 | 1.90 | 1.42 | 0.916 | 98 | 0.52 | 3.9 | 1 | |
27.0 | 1.96 | 1.54 | 0.762 | 96 | 0.48 | 3.7 | 2 | |
34.1 | 1.89 | 1.41 | 0.930 | 100 | 0.37 | 5.2 | 3 | |
33.5 | 1.91 | 1.43 | 0.912 | 98 | 0.50 | 4.0 | 4 | |
32.8 | 1.94 | 1.46 | 0.909 | 97 | 0.47 | 3.9 | 5 | |
33.1 | 1.95 | 1.48 | 0.906 | 96 | 0.46 | 3.8 | 6 | |
④ Silty Clay | 25.1 | 2.01 | 1.61 | 0.687 | 99 | 0.29 | 6.2 | Undisturbed |
19.6 | 2.07 | 1.70 | 0.618 | 98 | 0.15 | 10.4 | 1 | |
20.4 | 2.01 | 1.67 | 0.629 | 98 | 0.29 | 5.5 | 2 | |
20.3 | 2.02 | 1.68 | 0.620 | 100 | 0.17 | 9.8 | 3 | |
20.4 | 2.04 | 1.68 | 0.633 | 98 | 0.18 | 9.5 | 4 | |
20.5 | 2.00 | 1.66 | 0.631 | 97 | 0.18 | 9.6 | 5 | |
20.4 | 2.01 | 1.66 | 0.629 | 98 | 0.17 | 9.6 | 6 |
The tie rod was connected to the front wall, barrier pile, and anchor wall by a bolt structure. The uniformly distributed load on the wharf surface was calculated directly according to similarity theory and simulated with a fixed load. According to the water-level elevations of different test schemes, different overflow water-level control methods were used to control the test water level. The measurement accuracy of the no spindle front wall contact sensor was better than that of 20 μm horizontal points. A BE120-1AA-W foil resistance strain gauge was pasted directly on the model tie rod, and the sensitive size was 1.0-2.0 mm. Each measuring point had two working chips and two compensation chips to form a full bridge circuit. The model tie rod tension was calibrated before and after the test, and the tie rod tension of the model test was obtained according to the calibration results. The bending moments of the wall and pile body were calculated by sticking BE120-4FB and BE120-5AA foil resistance strain gauges on both sides of the wall and pile body, respectively, with a resistance value of 119.9 ± 0.3 Ω. Four pieces, two compression and two tension working pieces, at each measuring point formed a full bridge circuit. The bending moment of the wall and pile body was converted according to the calibration results before and after the test.
4. Numerical analysis
ABAQUS large-scale finite-element software was used to verify the reliability of the results of the numerical model through a comparative analysis of the two-dimensional (2D) [17] three-dimensional (3D) model [18]-[19], prototype observation, and centrifugal test results.
4.1. Parameter selection
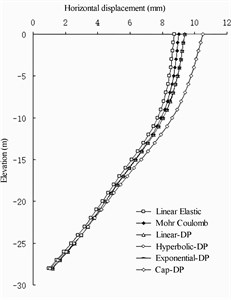
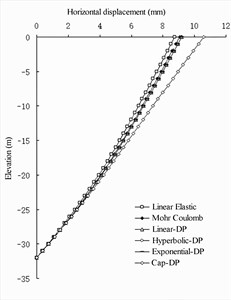
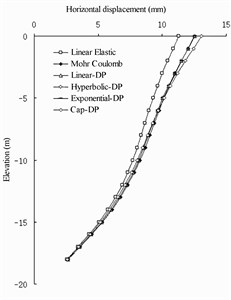
Overall showed in Fig. 3, the lateral deformation of the linear elastic model was the smallest and most consistent with the prototype observation experimental results. How-ever, for long-term operation, the observation results were small, the lateral deformation of the cap Drucker-Prager (DP) model was the largest, and the lateral deformation of Mohr–Coulomb model and extended DP model was between those of the linear elastic model and cap DP model. The gap between them was very small and can almost be ignored.
Fig. 3Under different soil constitutive model numerical wharf structural horizontal displacements
a) Front wall
b) Barrier pile
c) Anchor wall
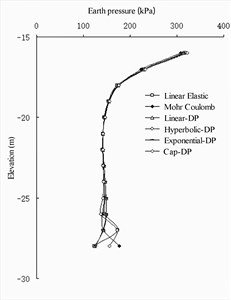
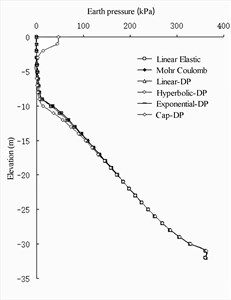
For the earth pressure distribution on the seaside of the front wall (As shown in Fig. 4(a) and 4(b)), the calculated values of the four soil constitutive models [20]-[21] were basically the same. Near the excavated mud surface, the value of the Coulomb model was the smallest and the value of the cap DP model was the largest. At the bottom of the front wall, the value of Mohr-Coulomb model was the largest, and the value of linear elastic model was the smallest. In the earth pressure distribution on the land side of the barrier pile (As shown in Fig. 4(c) and 4(d)), the calculated values of the four soil constitutive models were basically the same, except that the cap DP model was slightly different from the other three models in the area above the excavated mud surface. In the earth pressure distribution on the seaside of the barrier pile, the earth pressure value of the Mohr-Coulomb model was slightly smaller than that of the other three models in the area below the excavated mud surface. On the land side of the anchor wall (As shown in Fig. 4(e) and 4(f)), the earth pressure values of the four models exhibited no evident difference, al-most showing a curve distribution.
A comprehensive comparison of the lateral deformation of the structure and the earth pressure on the front wall, barrier pile, and anchor wall indicated that the hyperbolic and exponential simulation results of the Mohr-Coulomb model and extended DP model were better. Considering the selection and input of model parameters, the Mohr-Coulomb model is the most suitable for soil.
Fig. 4Earth pressure distribution of wharf structure under numerical calculation of different soil constitutive models
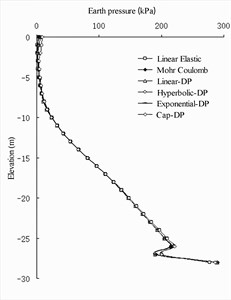
a) Land side of front wall
b) Seaside of front wall
c) Land side of barrier pile
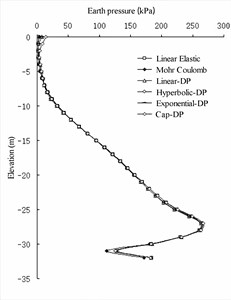
d) Sea side of barrier pile
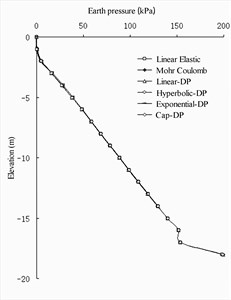
e) Land side of anchor wall
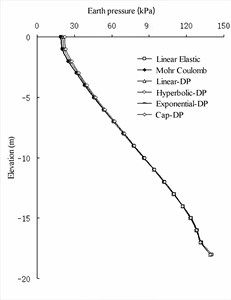
f) Sea side of anchor wall
The calculation parameters of each component according to the geological data pro-vided are shown in Table 6 [22]. The life and death elements were used to simulate the harbor basin excavation process, six sub steps were used for simulation, and the interaction between the contact pair setting structure and soil was employed. The face-to-face discrete method was used for the contact surface, and the finite sliding method was utilized to track the relative movement of the reaction contact surface. The normal model of the contact surface adopted hard contact, and the friction model of the contact surface employed the penalty stiffness algorithm, which considers elastic slip deformation. The friction coefficient was changed from tan (0.75) according to the internal friction angle of the corresponding soil layer decision. For the boundary conditions, the seaside of the front sheet pile wall was taken as the excavation depth distance, the land side of the anchor wall as the excavation depth distance, the bottom of the curtain pile as the depth distance of the front sheet wall, and the -direction as the range of three curtain piles. The boundary condition was set to be free in the upper part, the sea and land sides of the front sheet pile wall were constrained in the -direction, the -direction constraints were limited on both sides of the -direction of the model, and the bottom of the model was completely fixed. Considering that there was no horizontal displacement at the bottom of the diaphragm wall, curtain pile, and anchor wall in the prototype observation, in the model simulation, the constrained horizontal () displacement of the bottom of the diaphragm wall, curtain pile, and anchor wall was 0. The grid division is shown in Fig. 5.
Table 6Material physical and mechanical parameters
Material number | Material type | Depth range | Bulk density | Elasticity | Poisson’s ratio | Cohesion | Internal friction angle | Dilatancy angle |
m | kN·m3 | MPa | Pa | ° | ° | |||
1 | Front wall | – | 25.0 | 2.80×10⁴ | 0.17 | – | – | – |
2 | Barrier pile | – | 25.0 | 2.80×10⁴ | 0.17 | – | – | – |
3 | Anchorage wall | – | 25.0 | 2.80×10⁴ | 0.17 | – | – | – |
4 | 75 mm pull rod | – | 78.5 | 2.00×10⁵ | 0.30 | – | – | – |
5 | 95 mm pull rod | – | 78.5 | 1.90×10⁵ | 0.30 | – | – | – |
6 | Backfill silty fine sand | 4 to 0 | 18.0 | 14.75 | 0.30 | 5000 | 30.0 | 0.1 |
7 | Silty fine sand | 0 to –6 | 18.0 | 14.75 | 0.30 | 5000 | 27.0 | 0.1 |
8 | Silty clay | –6 to –11 | 19.3 | 4.87 | 0.35 | 27000 | 18.9 | 0.1 |
9 | Fine sand | –11 to –25 | 19.1 | 10.85 | 0.35 | 5000 | 32.2 | 0.1 |
10 | Silty clay | –25 to –28 | 19.7 | 3.45 | 0.35 | 31000 | 26.8 | 0.1 |
11 | Fine sand | –28 to –35 | 19.7 | 13.50 | 0.30 | 5000 | 32.7 | 0.1 |
Fig. 53D Model finite-element mesh division for overall structure
a) Overall structure
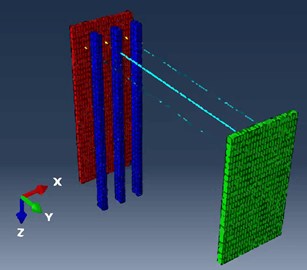
b) Barrier sheet pile wharf
4.2. Result analysis
The numerical results are compared with the prototype observation results for Jing-tang Port berth 32 section 4 and the centrifugal model test results to reveal the action mechanism of the barrier sheet pile wharf structure.
4.2.1. Overall settlement and horizontal displacement of structure
The settlement comparison results of various components of the wharf structure after excavation to –16 m are shown in Table 7. The settlement law reflected by the finite-element simulation results is roughly the same as the prototype observation values. The settlement of the anchor wall is the largest, and the result of the 3D model is approximately 1.05 ‰ of the depth of the anchor wall. The front sheet pile wall is approximately 0.32 ‰ of the depth of the front sheet wall. The settlement of the barrier pile was the smallest, approximately 0.03 ‰ of the depth of the barrier pile. The comparison results of the horizontal displacement of the anchor point are shown in Table 8, indicating that the horizontal deformation of the overall structure is not large, and the numerical simulation results were less than the prototype observation results. This is because the constraint of the horizontal deformation at the bottom of the front wall is set in the numerical model; thus, the horizontal displacement of the anchor point of the front wall is slightly smaller than the prototype observation result.
Table 7Settlement comparison between wharf components
Front wall | Barrier pile | Anchor wall | |
mm | mm | mm | |
2D simulation | 9.4 | 1.2 | 20.0 |
3D simulation | 8.8 | 1.1 | 18.9 |
Prototype observation | 5.0 | 2.0 | 16.0 |
Table 8Comparison of horizontal displacements of anchor point
Horizontal displacement of anchor point | Mud surface displacement | |
mm | mm | |
2D model | 16.8 | 9.9 |
3D model | 16.2 | 9.7 |
Prototype observation | 22.4 | 9.8 |
Centrifugal scheme 1 | 175.0 | - |
Centrifugal scheme 3 | 105.0 | - |
4.2.2. Lateral displacement of wharf structure
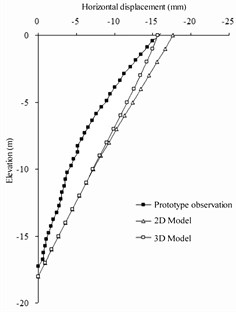
The numerical simulation results of the deformation law of the barrier pile and front wall are like the observation data of the prototype barrier pile and front wall at the end of the period. Fig. 6 shows a comparison between the deformation law of the barrier pile and the front wall and horizontal anchor wall at the end of the period. On the front wall, because the front plate wall is flexible, the prototype observation data show that the horizontal deformation of the front wall is distributed in a curve along the depth direction, which intersects with the results of finite-element simulation at an elevation of –16 m from the excavation surface, indicating that the front plate wall is restrained by the bottom, excavation surface, and pull rod. On the barrier pile, the horizontal deformation variation law of the horizontal displacement of the finite-element model along the depth of the barrier pile is more consistent with the horizontal deformation observed by the field prototype than the front wall. Because of the large stiffness of barrier pile, it changes approximately linearly. On the anchor wall, the horizontal displacement observed for the prototype is slightly smaller than that simulated by the finite-element method owing to the action of the pull rod. Because the anchor wall is far from the excavation area, it is less affected by the excavation, mainly because of the pull rod tension after the horizontal deformation of the front wall and barrier pile. The horizontal displacement changes linearly along the depth direction.
Fig. 6Horizontal displacement of numerical simulation and prototype observations
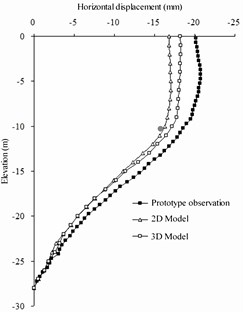
a) Front wall
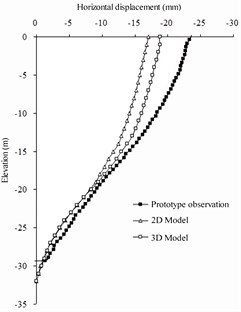
b) Barrier pile
c) Anchor wall
4.2.3. Earth pressure distribution
The earth pressure distribution on each member at the end of excavation and dredging at the wharf apron is shown in Fig. 7. The numerical calculation results have the same variation law as the prototype observation results, showing an evident “R”-shaped distribution [13]. The numerical results are larger than the prototype observation results because of the factors of filling behind the wall and the influence of the tide level on the water-soil separation method in the prototype observation. There is a space between the barrier piles. Because of the action of horizontal soil arching, the earth pressures shared on the barrier pile and on the soil between the barrier piles are different. Because the stiffness of the barrier pile is larger and the horizontal displacement of the barrier pile is smaller than that of the soil between the barrier piles, the earth pressure shared on the barrier pile is slightly larger and that shared on the soil between the barrier piles is slightly smaller.
Fig. 7Earth pressure comparison
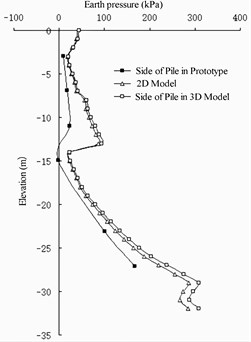
a) Pile side of front wall
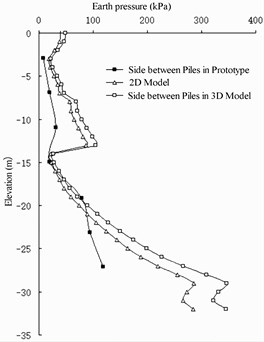
b) Side between piles of front wall
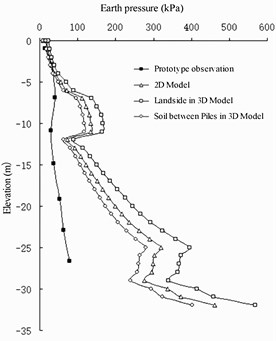
c) Land side of barrier pile
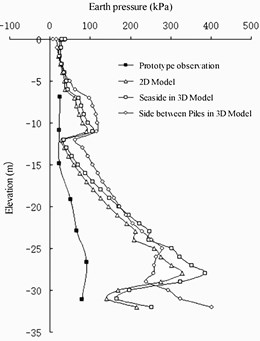
d) Seaside of barrier pile
4.2.4. Tie rod tension
Table 9 shows the tensile force of the small tie rod between the front wall and the barrier pile and of the large tie rod between the barrier pile and the anchor wall. The numerical calculation results are between the values of the prototype observation test and those of the centrifugal model test, and the tensile force values of the large and small tie rods in the prototype observation results are quite different. In the centrifugal model test, because the front and rear tie rods are the same, the tie rod tension is the same. However, in the numerical calculation results, the tension values of large and small tie rods are relatively close.
Table 9Rod tension comparison
Research methods | Pull force of small tie rod-75 mm | Pull force of small tie rod-95 mm |
kN | kN | |
Prototype observation | 276 | 470 |
2D model | 529 | 652 |
3D model | 574 | 702 |
Centrifugal test | 750 | 750 |
4.2.5. Overall bending moment of structure
As shown in Fig. 8, the bending moment distribution of the front wall is basically the same law, the negative bending moment is distributed in the area with an elevation of 0 to –15 m, and the positive bending moment is distributed in the area with an elevation between –15 and –28 m. The numerical calculation results show that there is a small positive bending moment range in the upper part of the front wall, but the prototype observation test does not, mainly because the prototype observation test is converted based on the stress of the reinforcement. In this area, the axial stress of the reinforcement is extremely small, and the converted bending moment can basically be ignored. The peak value of numerical calculation is close to that of the centrifugal model test, and the value of proto-type observation test is small. The peak value is roughly distributed in the area with an elevation between –8 and –11 m. The distribution of the positive bending moment shows that the distribution tendency is the same as that of the negative bending moment. The numerical results are slightly larger. The bending moment distribution on the barrier pile is shown in Fig. 9 with the same distribution law. The negative bending moment is distributed in the area above an elevation of –16 m, and the positive bending moment is distributed in the area below an elevation of –16 m. The numerical calculation results are be-tween those of the prototype observation test and the centrifugal model test data, and the peak value is distributed in an area of elevation between –9 and –11 m. The positive moment distribution reveals that the numerical results are quite close to the centrifugal model test results.
Fig. 8Comparison of bending moment on the front wall
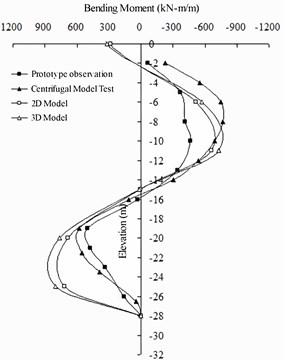
Fig. 9Compared comparison of bending moment on the barrier pile
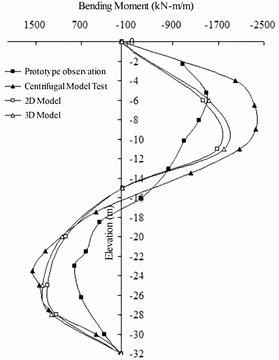
Generally, the centrifugal model test is used to investigate the extreme state of the structure; thus, the centrifugal model test value is the largest. The prototype observation test used to determine the actual state of the structure. The bending moment value is obtained by the conversion of the reinforcement stress. The measurement of the reinforcement stress directly affects the converted bending moment. The numerical results are between the results of the centrifugal model test and those of the prototype observation test, which shows that the numerical results are in good agreement with the structural deformation characteristics.
5. Analysis of barrier effect
The use of the barrier sheet pile wharf, a structural type of sheet pile wharf, particularly because of the covered pile, makes the transmission mechanism of earth pressure in the structure more complex. It is not known how much lateral earth pressure the barrier pile reduces on the front wall and what the barrier effect is, which makes it wasteful to use the original sheet pile structure design method in the structural design of the barrier sheet pile wharf because it cannot reflect the advantages of this structural type. Therefore, it is necessary to analyze the influence of the barrier pile on the barrier effect in barrier sheet pile wharves.
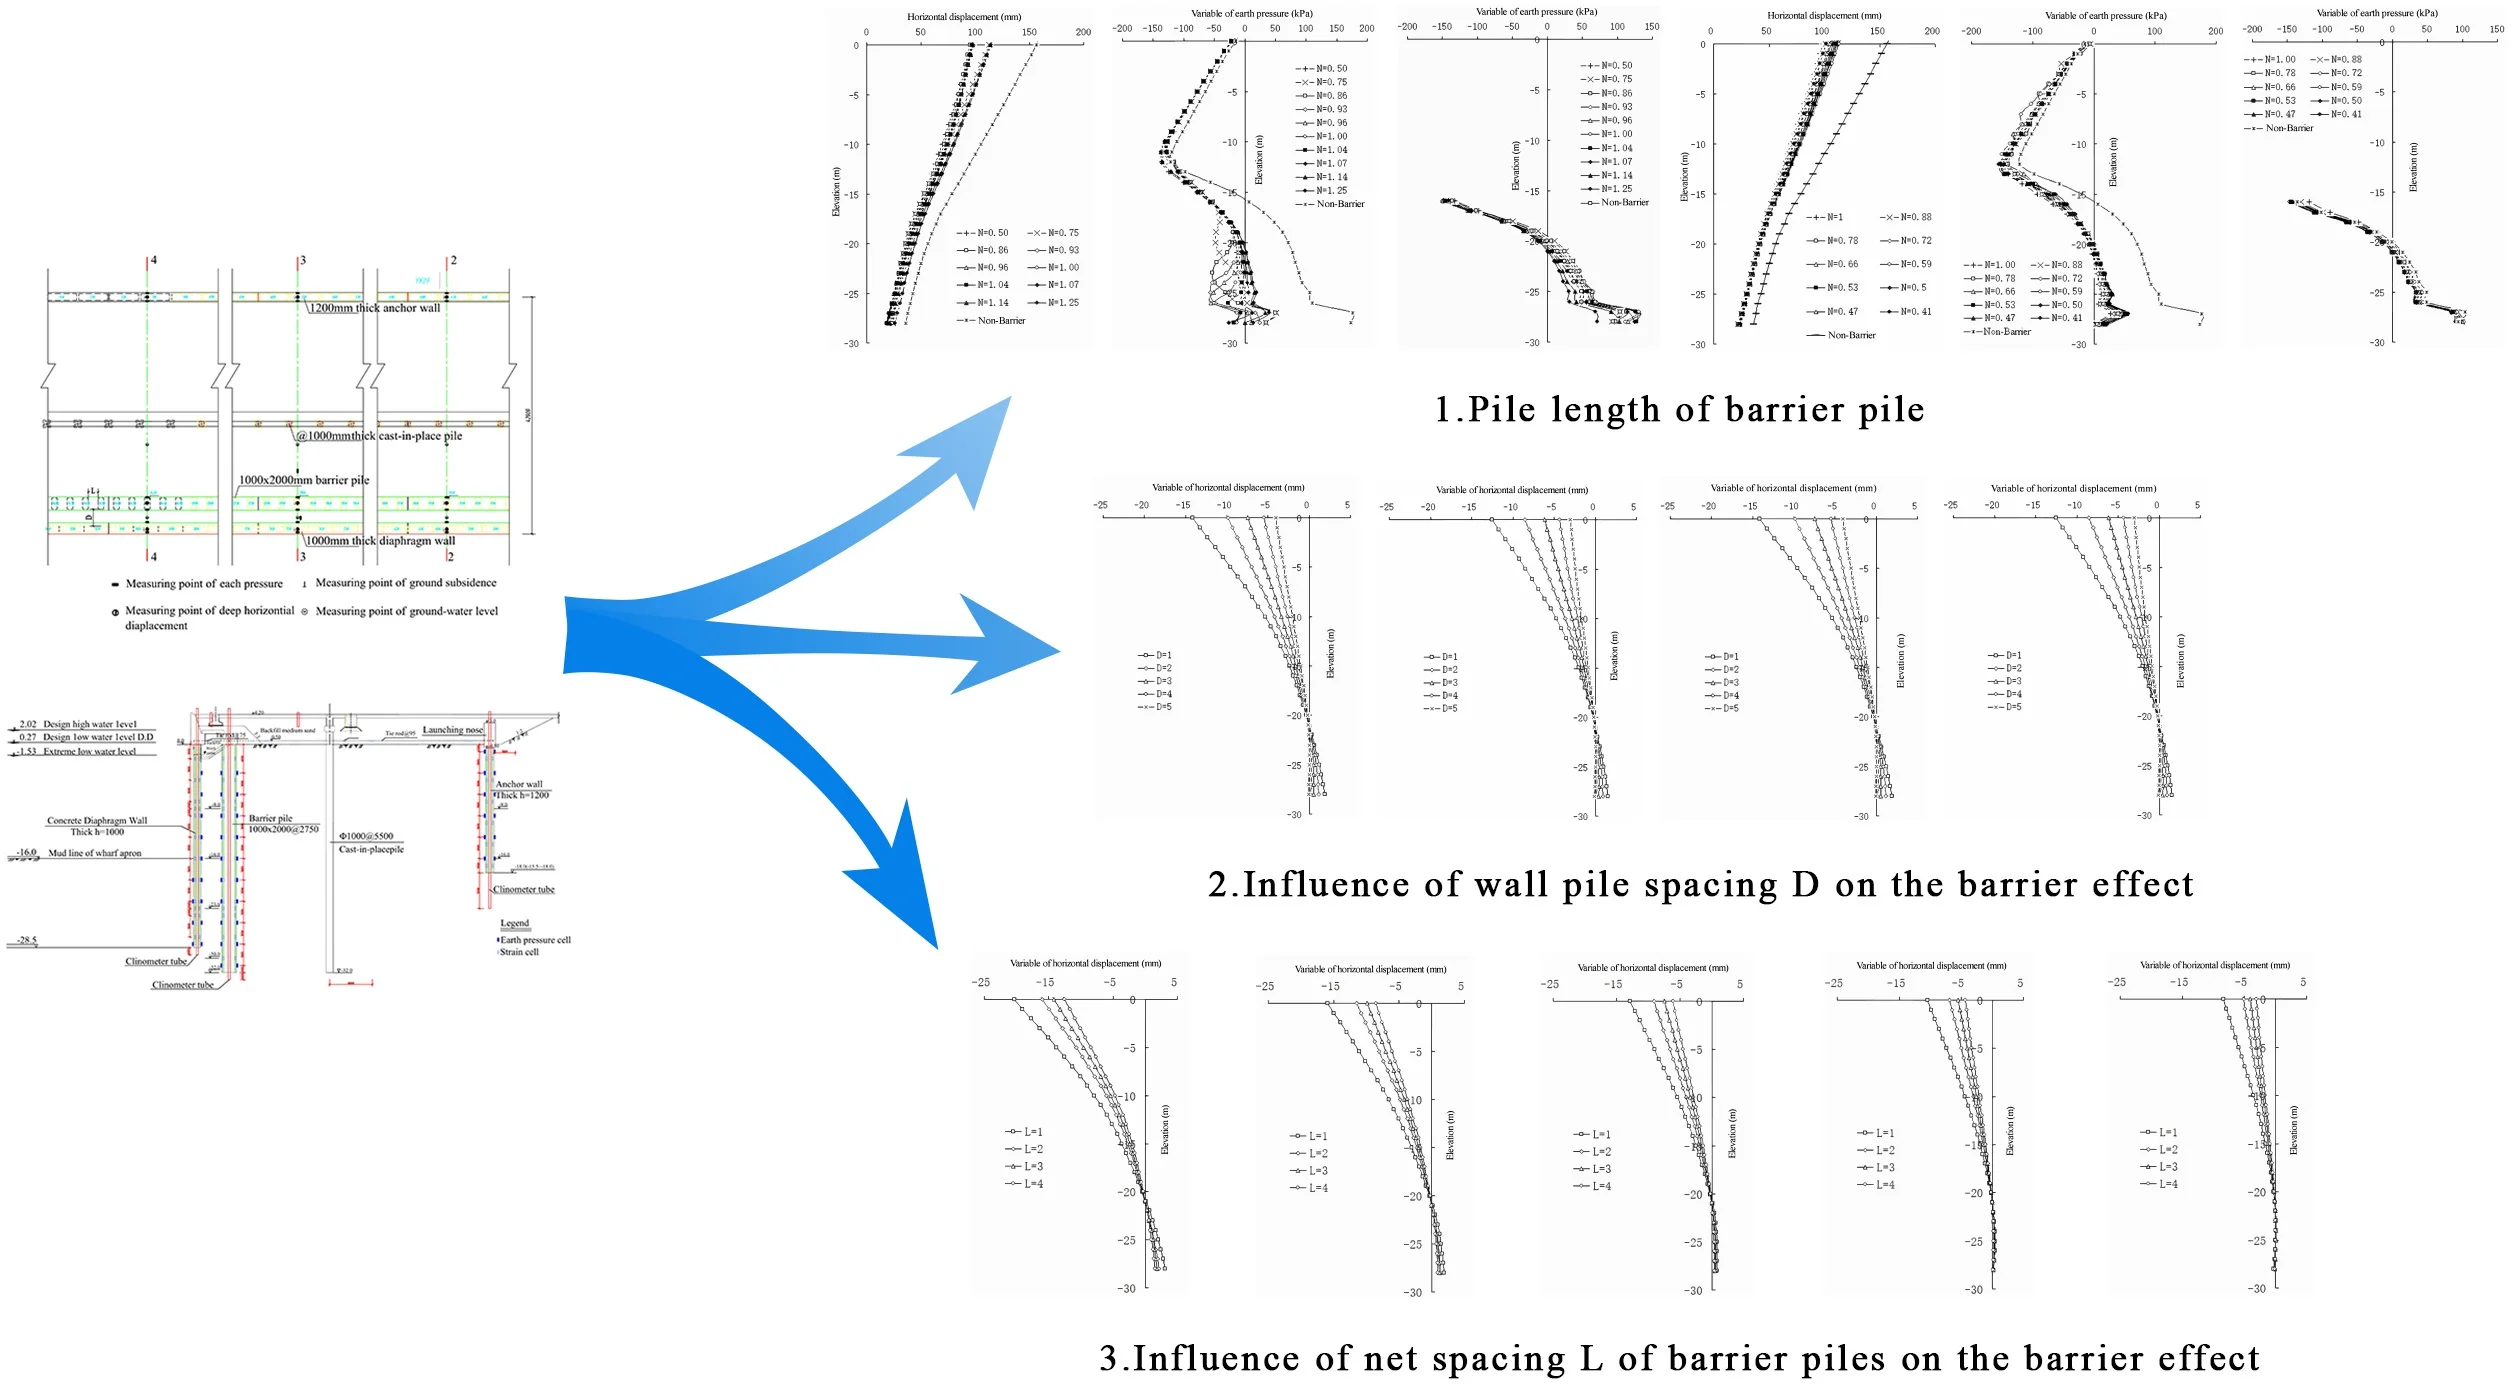
5.1. Pile length of barrier pile
The pile length of the barrier pile is an important design index in the structural design of a barrier sheet pile wharf. The length of the barrier pile directly affects the form of displacement of the overall structure of the wharf and the influence of the barrier pile on the front wall. According to the type of barrier pile-full-barrier pile and semi barrier pile – the above modeling method was adopted for numerical calculation and analysis in two cases. Through the numerical calculation of various working conditions, the influence of the change in pile length of different barrier piles on the horizontal displacement of the front wall and barrier piles and the change in their lateral earth pressure were analyzed. Table 10 shows the change in pile length of a full-barrier pile. The pile length was 32 m, which was the same as that of the prototype of the Jingtang Port berth 32. The research results for the pile length of the full-barrier pile reveal that the bottom elevation of the semi barrier pile is –30 m. The change in pile length of the semi barrier pile is shown in Table 11.
Table 10Barrier pile length change
Working condition | 1 | 2 | 3 | 4 | 5 | 6 | 7 | 8 | 9 | 10 |
Length of barrier pile / | 14 m | 21 m | 24 m | 26 m | 27 m | 28 m | 29 m | 30 m | 32 m | 35 m |
Length ratio between wall with pile / | 0.50 | 0.75 | 0.86 | 0.93 | 0.96 | 1.00 | 1.04 | 1.07 | 1.14 | 1.25 |
Table 11Semi barrier pile length change
Working condition | 1 | 2 | 3 | 4 | 5 | 6 | 7 | 8 | 9 | 10 | 11 |
Top | 0 m | –4 m | –7 m | –9 m | –11 m | –13 m | –15 m | –16 m | –17 m | –19 m | Non-Barrier |
N | 1.00 | 0.88 | 0.78 | 0.72 | 0.66 | 0.59 | 0.53 | 0.50 | 0.47 | 0.41 |
In the sheet pile structure, the displacement form of the front wall is mainly rotation around the bottom of the wall. Above the excavation mud level, the front wall is mainly affected by the earth pressure on the land side and the pull force of the pull rod on the land side. The earth pressure pushes the front wall toward the seaside. The pull rod is used to pull the upper part of the front wall without causing a large horizontal displacement. Be-low the elevation of the excavated mud surface, the front wall is mainly affected by the earth pressure on the sea and land sides. The role of the earth pressure on the seaside is to resist the movement of the buried section of the front wall to the sea side. The land side earth pressure is divided into two parts. 1) The upper part of the buried section of the front wall continues to push the front wall toward the sea. 2) The lower part of the buried section of the front wall has a role in resisting the danger of overturning from the bottom of the front wall to the land side. The higher the dividing point elevation of the two parts, the better the stability of the front wall.
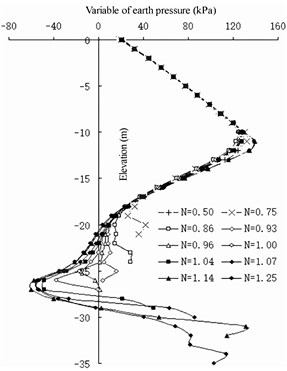
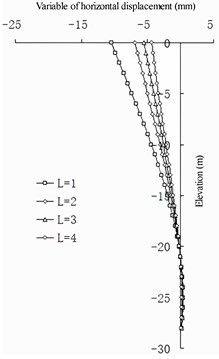
For the full-barrier sheet pile wharf structure (Fig. 10 and 11), the setting of the barrier piles significantly reduces the earth pressure on the land side of the front wall, thereby reducing the horizontal displacement of the front wall. The position with the best barrier effect is at an elevation of –11 m.
Fig. 10Horizontal displacement of full-barrier type
a) Front wall
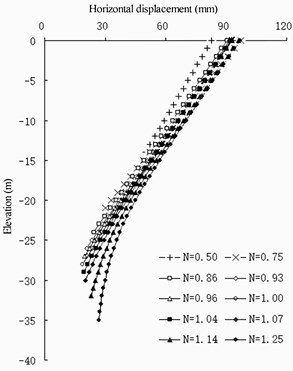
b) Barrier pile
Fig. 11Earth pressure variation of full-barrier type
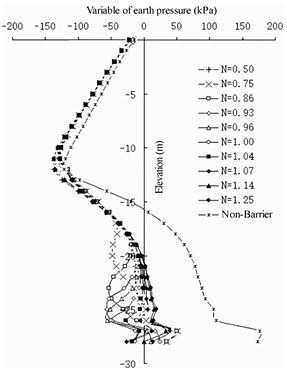
a) Land side of front wall
b) Seaside of front wall
c) Land side of barrier pile
d) Seaside of barrier pile
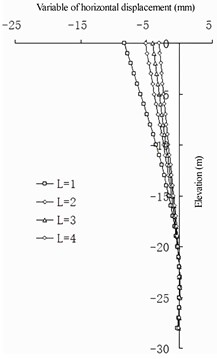
Fig. 12Horizontal displacement of semi-barrier type
a) Front wall
b) Barrier pile
Fig. 13Earth pressure variation of semi-barrier type
a) Land side of front wall
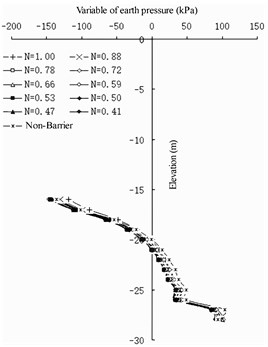
b) Seaside of front wall
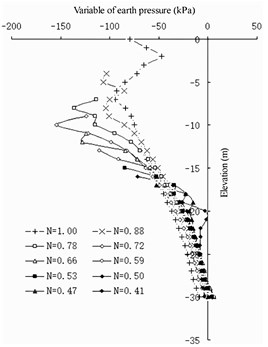
c) Land side of barrier pile
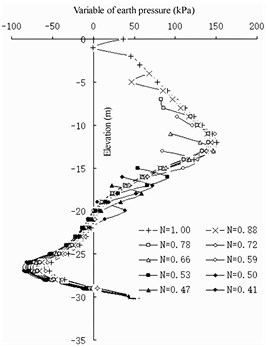
d) Seaside of barrier pile
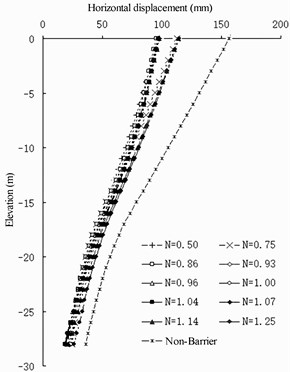
Comparing the pile lengths of different barrier piles, when the pile length of the barrier pile is less than 30 m, the earth pressure on the land side at the bottom of the front wall basically does not increase. Currently, the setting of the barrier pile reduces the stability of the front wall. When the length of the barrier pile is more than 30 m, the landside earth pressure of the front wall below –22 m increases gradually; however, with the increase in the length of the barrier pile, the increase in the land side earth pressure of the front wall is very slow. Therefore, it is considered that the ratio between the length of the barrier pile and the depth of the front wall is greater than 1.07. If the barrier pile is excessively long, the design cost performance is poor. In the design of berth 32 of the Jingtang Port, the depth of the front wall is 28 m, the thickness is 1 m, the elevation of the front excavation mud surface is –16 m, the cross-section size of the barrier pile is designed to be 1×2 m, and the length of the barrier pile is designed to be 32 m. Considering the actual geological conditions, 1.143 is reasonable.
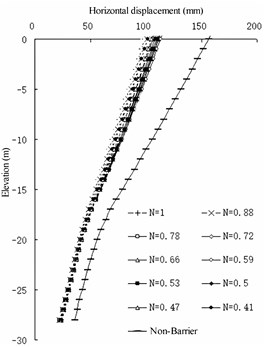
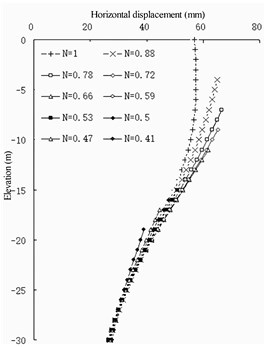
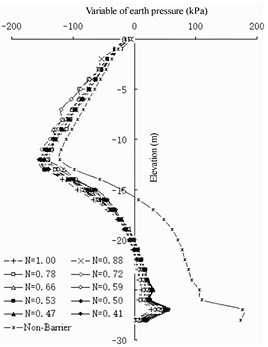
For the semi-barrier sheet pile structure (Fig. 12 and 13), because the pile bottom elevation of the semi-barrier pile is fixed, the stability of the front wall after setting the semi-barrier pile can be guaranteed. The change in earth pressure on the land side of the front wall shows that the maximum barrier effect of the semi-barrier pile occurs at an elevation of –12 m. Therefore, it can be considered that the top elevation of the semi-barrier pile should not be lower than an elevation of –12 m to ensure that the semi-barrier pile can fully play its role of being a barrier – that is, the ratio of the pile length of the semi-barrier pile to the height of the front wall. In the design of the Jingtang Port berths 14 and 15, the front wall is 21 m deep and 1 m thick, the front excavation mud surface has an elevation of –13.5 m, the cross-section size of the semi-barrier pile is designed to be 1-2 m, and the length of the semi-barrier pile is designed to be 17.4 m. Considering the actual geological conditions, 0.83 is reasonably safe.
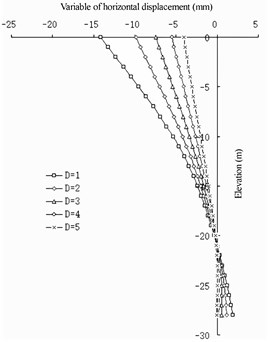
5.2. Influence of wall pile spacing on the barrier effect
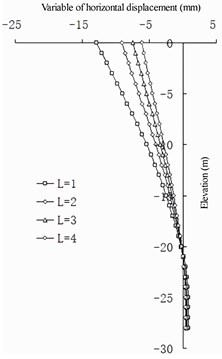
In the case of a fixed net spacing of the barrier piles, from the perspective of horizontal displacement (show in Fig. 14), there is a logarithmic relationship between the spacing between the wall with piles and the change in horizontal displacement of the front wall: the smaller the value, the smaller the horizontal displacement of the front wall. Com-pared with the case without barrier piles, the change in the horizontal displacement of the front wall is greater. With the increase in , the change gradually decreases. The value has a linear relationship with the change in the horizontal displacement of the barrier pile: the smaller the value, the greater the horizontal displacement of the barrier pile. With the increase in , the change in the horizontal displacement of the barrier pile remains approximately the same. For the entire structure, the smaller the value, the better the barrier effect of the structure. When is greater than 3 m, the barrier effect of the barrier pile is not evident from the perspective of horizontal displacement [24]-[25].
Fig. 14Horizontal displacement of front wall compared with non-barrier Pile
a) 1
b) 2
c) 3
d) 4
Fig. 15Differences in earth pressure between pile side and pile side on front wall
a) 1
b) 2
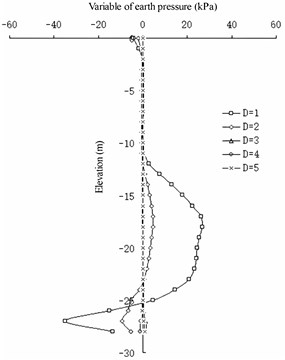
c) 3
d) 4
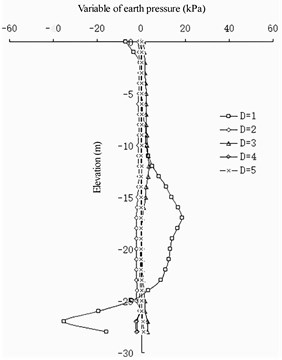
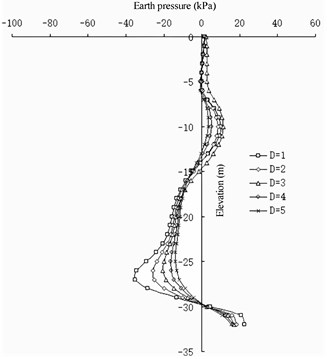
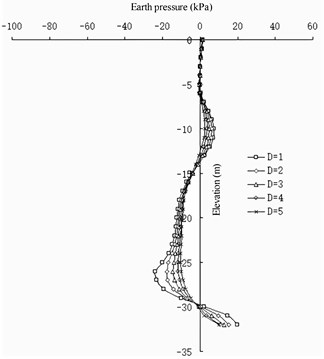
From the change in the earth pressure (Fig. 15 and 16), the influence of the wall pile spacing on the change in the earth pressure in the area shallower than a –10 m elevation on the front wall is not evident. At an elevation of –10 to –25 m, the greater the value, the greater the earth pressure on the land side of the front wall. Deeper than –25 m, the greater the D value, the smaller the earth pressure on the land side of the front wall. In the area with elevation between –16 to –20 m, the greater the value, the greater the earth pressure on the seaside of the front wall. At an elevation deeper than –20 m, the greater the value, the smaller the earth pressure on the seaside of the front wall. The greater the value of , the smaller the difference in the earth pressure between the corresponding pile side and the corresponding pile spacing on the land side of the front wall. For the earth pressure on the barrier pile, has no evident influence on the earth pressure distribution on the sea and land sides of the barrier pile. It only has a barrier influence on the difference between the barrier pile and the earth pressure between the barrier piles: the greater , the less evident the difference between them.
Fig. 16Differences in earth pressure between pile side and pile side on barrier pile
a) 1
b) 2
c) 3
d) 4
The wall pile spacing has a greater impact on the front wall and less impact on the barrier pile. It has a slight impact on the upper part of the structure and a great impact on the lower part of the structure. In terms of the barrier effect, the smaller the value, the better the effect. When the distance between the wall piles exceeds 3 m, the barrier effect can be ignored. In terms of the stability of the front wall, the smaller the value, the better the stability of the front wall in the soil, and the lower the elevation of the excavated mud surface at the front of the front wall.
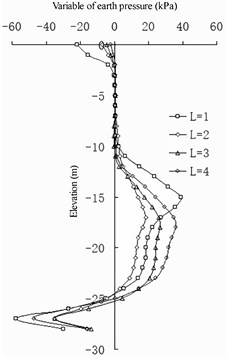
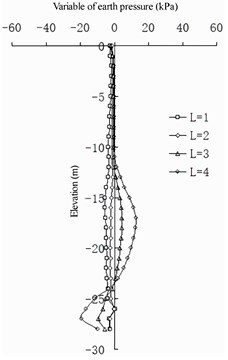
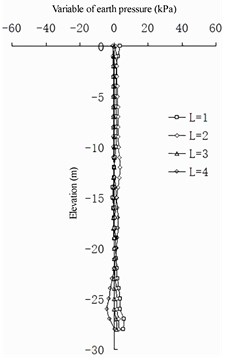
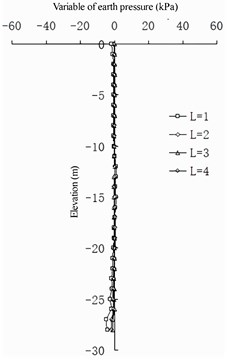
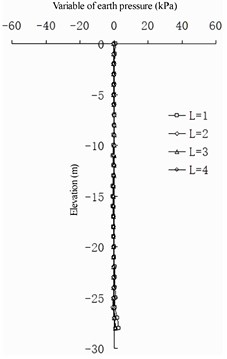
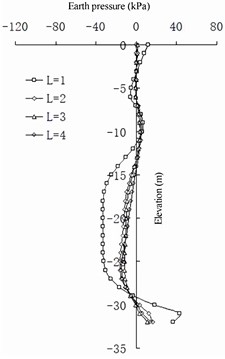
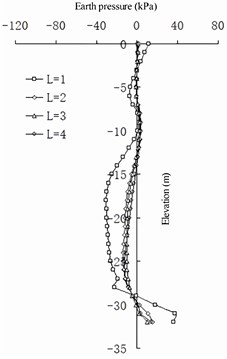
5.3. Influence of net spacing of barrier piles on the barrier effect
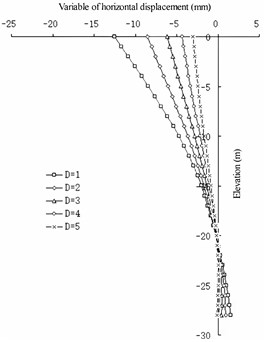
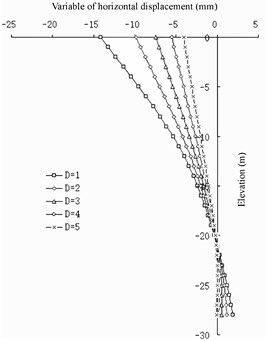
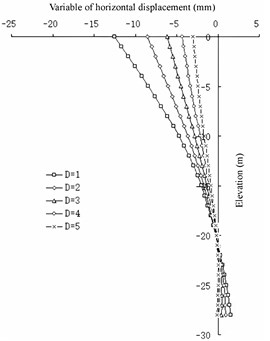
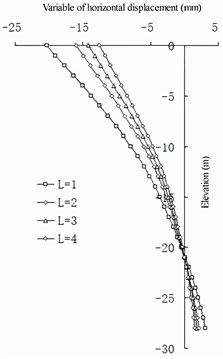
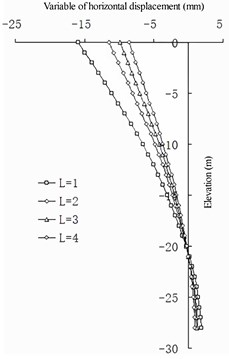
In the case of a fixed wall pile spacing , from the perspective of horizontal dis-placement (show in Fig. 17), the net spacing of the barrier piles has a linear relationship to the change in horizontal displacement of the front wall: the smaller the value, the smaller the horizontal displacement of the front wall. Compared with the case without barrier piles, the change in the horizontal displacement of the front wall is greater, and the change gradually decreases with the increase in . The value of the barrier pile is independent of the change in the horizontal displacement of the barrier pile. For the entire structure, the smaller the value, the better the barrier effect of the structure. When is greater than 2 m, the barrier effect of the barrier pile is not evident from the perspective of horizontal displacement.
Fig. 17Horizontal displacement of front wall compared with non-barrier pile
a) 1
b) 2
c) 3
d) 4
e) 5
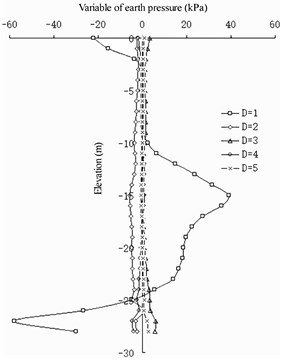
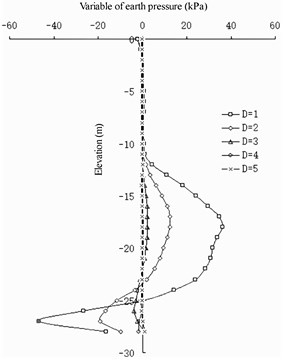
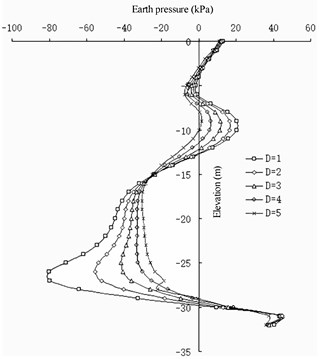
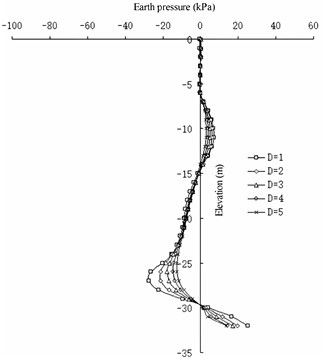
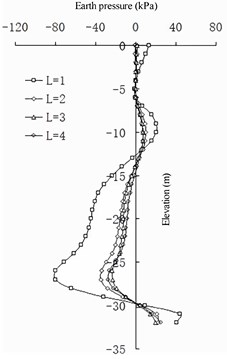
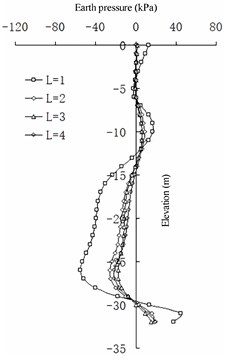
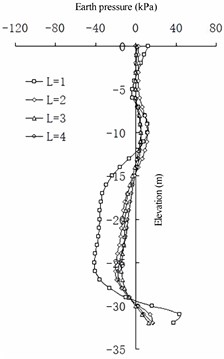
The change in the earth pressure (Fig. 18 and 19) reveals that the net spacing of the barrier piles has no evident effect on the change in earth pressure in the area shallower than –10 m on the front wall. Between –10 and –24 m, the greater the , the greater the earth pressure on the land side of the front wall. Deeper than –25 m, the greater the , the smaller the earth pressure on the land side of the front wall. At an elevation of –16 to –20 m, the greater the , the greater the earth pressure on the seaside of the front wall. Deeper than –20 m, the greater the , the smaller the earth pressure on the seaside of the front wall. The larger the , the smaller the difference in earth pressure between the pile side and the corresponding pile spacing on the land side of the front wall. For the earth pressure on the barrier pile, when is greater than 2 m, the influence on the earth pressure distribution on the sea and land sides of the barrier pile is not evident. When is less than 2 m, the earth pressure on the land side of the barrier pile increases with a decrease in of the barrier pile at an elevation of –6 to –14 m, and it decreases with a decrease in in the area deeper than –14 m. The seaside earth pressure of the barrier pile decreases with a decrease in at an elevation of –11 to –25 m, and it increases with a decrease in deeper than –25 m. The net spacing of barrier piles has a logarithmic relationship to the difference between barrier piles and earth pressure between barrier piles: the greater the value of , the less evident the difference between them (that is, the horizontal soil arching effect [26]).
In summary, the net spacing of barrier piles mainly affects the land and sea measured earth pressures of barrier piles. The part of the earth pressure shared by the sea and land sides of barrier piles and the soil between barrier piles has a logarithmic relationship to the net spacing of the barrier piles: the smaller the value, the better the barrier effect. When exceeds 2 m, the earth pressure shared by the two parts tends to be average, and the barrier effect can be ignored.
Fig. 18Differences in earth pressure between pile side and pile side on the front wall
a) 1
b) 2
c) 3
d) 4
e) 5
Fig. 19Differences in earth pressure between pile side and pile side on the barrier pile
a) 1
b) 2
c) 3
d) 4
e) 5
6. Discussion
Data from a prototype observation and centrifugal model experiments for a barrier sheet pile wharf were combined with the results of multiple groups of finite-element calculations conducted using ABAQUS software. The effects of the changes in barrier pile length, top elevation position of a semi-barrier pile, wall pile spacing , and barrier pile net spacing on the barrier effect of a barrier sheet pile head structure were compared, and the following conclusions were drawn.
1) The setting of a full-barrier pile and semi-barrier pile can reduce the earth pressure on the land side of the front wall, thereby reducing the horizontal displacement of the front wall, deepening the excavation depth of the front wall, and maintaining the stability of the front wall in the soil. When maximizing the barrier effect, the pile length of the full-barrier pile should not be excessive. It is most appropriate to control the ratio of the pile length of the full-barrier pile to the depth of the front wall to 1.0-1.1. To maximize the barrier effect, the top elevation of the semi-barrier pile should not be excessively low. When the bottom elevation is fixed, the ratio of the length of the semi-barrier pile to the depth of the front wall is approximately 0.7.
2) The distance between wall piles has a greater impact on the front wall and less impact on the barrier pile. It has a slight impact on the upper part of the structure and a considerable impact on the lower part of the structure. In terms of the barrier effect, the smaller the distance between wall piles, the better the barrier effect. The distance between wall piles is logarithmic to the horizontal displacement of the front wall. When exceeds 3 m, the change of the barrier effect can be ignored. In terms of the stability of the front wall, the smaller the distance between the wall piles, the better the stability of the front wall in the soil, and the lower the elevation of the excavated mud surface at the front of the front wall.
3) The net spacing of barrier piles mainly affects the earth pressure measured on the land and sea sides of barrier piles. The part of the earth pressure shared by the sea and land sides of barrier piles on the soil between barrier piles has a logarithmic relationship to the net spacing of barrier piles: the smaller the , the better the barrier effect. When the of barrier piles exceeds 2 m, the earth pressure shared by the two parts tends to be average, and the barrier effect can be ignored.
References
-
X. Ye and L. Yang, “A brief introduction to design method of sheet pile wharf based on European code,” (in Chinese), Port Engineering Technology, Vol. 52, No. 2, pp. 30–32, 2015, https://doi.org/10.16403/j.cnki.ggjs20150209
-
L. Yong-Xiu, W. Li-Dan, and L. Yuan-Yin, “A new type of wharf structure the structure of semi-covered type of deep-water sheet pile wharf,” (in Chinese), Port Engineering Technology, Vol. 12, pp. 16–19, 2005.
-
Y. X. Liu, “Design conception and practice of building sheet pile wharfs in deep waters-development of a new structure of covered type of sheet pile wharf,” (in Chinese), Port Engineering Technology, Vol. Z1, pp. 12–15, 2005.
-
Z. Y. Cai, W. Hou, and Y. F. Guan, “Mechanism of sheet-pile wharf with barrier piles,” (in Chinese), Chinese Journal of Geotechnical Engineering, Vol. 37, No. 10, pp. 1745–1750, 2015, https://doi.org/10.11779/cjge201510001
-
W. C. Dong, “Practice in construction of deep-water sheet-pile diaphragm-wall wharfs in jingtang port and experiential study,” (in Chinese), Port Engineering Technology, Vol. Z1, pp. 20–24, 2005.
-
Z. Hui and L. Jia, “Jingtang port underground continuous wall wharf construction pilots technology innovation of sheet pile wharf,” (in Chinese), Port Engineering Technology, Vol. 48, No. 3, pp. 37–40, 2011, https://doi.org/10.16403/j.cnki.ggjs2011.03.018
-
H. Yan et al., “Research on sheet pile wharf structure,” (in Chinese), Science and Technology of Ports, Vol. 1, pp. 6–9, 2016.
-
Y. Zhang and J. Zhang, “Sheet pile structure in form of concrete diaphragm wall applying to Yancheng port Binhai harbor,” (in Chinese), Port Engineering Technology, Vol. 54, No. 3, pp. 34–36, 2017, https://doi.org/10.16403/j.cnki.ggjs20170309
-
Z. B. Jiao et al., “Study on prototype observation technique of semi-covered type of sheet pile,” (in Chinese), Port Engineering Technology, Vol. Z1, pp. 56–59, 2005.
-
H. Tan, Z. Jiao, and Z. Cai, “Long term field test on structure forces of sheet-pile wharf with barrier piles,” Journal of Coastal Research, Vol. 73, No. sp1, pp. 242–247, Mar. 2015, https://doi.org/10.2112/si73-043.1
-
F. Chen, H. Tan, J. Chen, and Z. Jiao, “Influences of earthquake characteristics on seismic performance of anchored sheet pile quay with barrette piles,” Journal of Coastal Research, Vol. 85, No. sp1, pp. 701–705, May 2018, https://doi.org/10.2112/si85-141.1
-
H. Tan, Z. Jiao, F. Chen, and J. Chen, “Field testing of anchored diaphragm quay wall supported using barrette piles,” Journal of Waterway, Port, Coastal, and Ocean Engineering, Vol. 144, No. 4, p. 05018004, Jul. 2018, https://doi.org/10.1061/(asce)ww.1943-5460.0000456
-
Z. B. Jiao and Y. X. Liu, “Calculation methods of bending moment in diaphragm wall tests,” (in Chinese), Chinese Journal of Geotechnical Engineering, Vol. 28, pp. 1485–1488, 2006.
-
Z. Y. Cai et al., “Experimental study of centrifugal models to test earth pressure on covered sheet pile wharfs,” (in Chinese), Port Engineering Technology, Vol. Z1, pp. 51–55, 2005.
-
L. Jing-Lin et al., “Centrifuge model tests on sheet-piled wharf renovated by barrier pile project,” (in Chinese), Chinese Journal of Geotechnical Engineering, Vol. 28, No. 8, pp. 978–982, 2006.
-
J. Li et al., “Centrifuge modelling test on covered sheet-piled structure of wharf,” (in Chinese), Chinese Journal of Rock Mechanics and Engineering, Vol. 26, No. 6, pp. 1182–1187, 2006.
-
H. Zhang, Y. F. Gao, and W. Yong-Xin, “Two-dimensional numerical simulation of covered sheet pile wharf structure deformation in excavation process,” (in Chinese), Journal of Disaster Prevention and Mitigation Engineering, Vol. 34, No. 4, pp. 505–509, 2014, https://doi.org/10.13409/j.cnki.jdpme.2014.04.036
-
H. Zhang et al., “Finite element analysis on deformation mechanism of sheet-pile quay wall with barrier piles,” (in Chinese), Journal of Yangtze River Scientific Research Institute, Vol. 31, No. 7, pp. 81–85, 2014.
-
H. Si, Z. Cai, and J. Yu, “3d numerical modeling of pile-soil interaction for covered sheet-piled wharf,” (in Chinese), China Civil Engineering Journal, Vol. 45, No. 5, pp. 182–190, 2012, https://doi.org/10.15951/j.tmgcxb.2012.05.010
-
W. P. Liu et al., “Finite element numerical analysis of covered sheet pile wharfs,” (in Chinese), Chinese Journal of Geotechnical Engineering, Vol. S1, pp. 135–141, 2010.
-
P. Ren, L. I. Xiong, and J. Tao, “Numerical simulation study of soil parameters on lateral deformation of covered type of sheet piled wharf,” (in Chinese), Low Temperature Architecture Technology, Vol. 41, No. 1, pp. 118–121, 2019, https://doi.org/10.13905/j.cnki.dwjz.2019.01.030
-
S. L. Zhou et al., “The pile-soil interaction analysis about bank connecting structure of blind sheet-pile,” (in Chinese), Port and Waterway Engineering, Vol. 6, pp. 161–165, 2013, https://doi.org/10.16233/j.cnki.issn1002-4972.2013.06.031
-
S. Li, “Determination of rational length of covered pile for covered sheet pile wharf,” (in Chinese), Chinese Journal of Underground Space and Engineering, Vol. 11, pp. 591–595, 2015.
-
Z. Hao et al., “Influence analysis of wall pile spacing on barrier effect of sheet-pile barrier wharf structure,” Journal of Southeast University (Natural Science Edition), Vol. 45, No. 5, pp. 947–951, 2015.
-
H. Wei, P. Hong, and Y. Wang, “Determination on rational spacing of barrier pile for all-covered type of sheet pile wharf,” (in Chinese), Chinese Journal of Underground Space and Engineering, Vol. 8, No. 1, pp. 129–128, 2012.
-
L. L. Zhang and H. Lin, “Design calculation on spacing of barrier piles for sheet-pile wharf based on soil-arching effect,” (in Chinese), Chinese Journal of Geotechnical Engineering, Vol. 35, pp. 1134–1137, 2013.
About this article

The authors are grateful for the support from the Key research project of Anhui Provincial Department of Education (No. KJ2021A1097), the Key R&D Project of Anhui Science and Technology Department (No. 202004b11020026), the Nanjing International Joint Research and Development Program (No. 202112003), and the International Science and Technology Cooperation Project of Jiangsu Province (BZ2022010).
The datasets generated during and/or analyzed during the current study are available from the corresponding author on reasonable request.
Conceptualization, Hao. Zhang; methodology, Hao. Zhang; experiment, Hao. Zhang; software, Defeng. Zhang and Huaxin Zhu; validation, Hao. Zhang, Defeng. Zhang and Huaxin Zhu; data curation, Jie Wang and Chenxing Zhang; writing – original draft preparation, Drahomir NO-VAK and Chenxing Zhang; writing – review and editing, Hao. Zhang; funding acquisition, Hao. Zhang and Drahomir Novak. All authors have read and agreed to the published version of the manuscript.
The authors declare that they have no conflict of interest.
