Abstract
Quadcopters are playing an increasingly important role in a variety of industries due to their numerous advantages over other types of aircraft. Additionally, quadcopters are susceptible to damage, and their repair can be costly. On the other hand, today, reliability is recognized as a critical design feature in most industries. A device's reliability is one of the most important and complex issues in the field of engineering since it provides engineers with an insight into how a device performs. Due to the fact that reliability is a major factor in all industries and can significantly affect the quality and life of products, we analyzed the reliability of a quadcopter using statistical relationships, mathematical models, and previous experiences. After examining the failure modes and their effects on the system, the effects of the quadcopter failures are analyzed using the FMEA method, in order to determine the cause and mode of the failure. Finally, to determine the causes of failure, we have checked the quadcopter by the FTA method to minimize the possibility of failure. The purpose of this article is to discuss definitions and concepts in the field of reliability, followed by an analysis of the quadcopter and its components.
Highlights
- Reliability is an old concept and a critical characteristic in the design of systems, which has been taken into consideration in many industries today for the development and improvement of quality.
- FMEA is a method based on the law of "prevention before it happens". It is a tool that is used with the least risk to predict problems and fix defects in the stages of designing or developing processes and services. By using this method, the items that cause the failure of a product or process can be identified before that product reaches the production stage.
- FTA, while being a qualitative graphical model, can be quantified to provide useful information about the probability of occurrence, importance of incidents and their causes.
1. Introduction
Engineers in many industries have been focused on reliability as an old concept and a new discipline for the development and improvement of quality. The greatest concern of engineers throughout history has been the ability of the tools to perform their tasks best. This concern prompted the emergence of the science of reliability since it aims to determine a project’s success rate if it is implemented. As a result of this science, engineers are able to identify a system’s weaknesses and eliminate them, improving the desired performance and reducing system costs by choosing the best possible design out of a variety of alternatives. Historically, reliability assessment methods have been used by the aerospace industry and German rockets during World War I and II, but have rapidly spread into other industries, including the nuclear industry, which is under intense pressure to ensure nuclear reactor safety for the provision of electricity [1, 2].
On the other hand, today we are witnessing the emergence of a new and different generation of birds in the aviation industry, which has caused tremendous changes in this field. Among this new equipment, we can mention quadcopters, which due to their special characteristics, such as high stability, controllability, small dimensions, etc. have caused it to play many roles in various industries [3]. Quadcopters, due to their high functionality, the presence of numerous high-tech components, as well as special flight standards have created a situation in which even the smallest fault can be costly [3-5].
Reliability can be defined as the probability of satisfactory system performance under certain operating conditions for a certain period. The first part, probability, is determined by a number that is the same as the reliability assessment index. A mathematical definition of probability states that it is a numerical index whose value can range from 0 to 1. The probability of an event occurring is zero when there is no possibility and one when there is a definite probability of it occurring [1, 2]. The probability theory does not provide assistance in the other three areas, including satisfactory performance, a specific time frame, and working conditions, which are all engineering parameters, and only engineers and specialists can provide information about satisfactory performance, and time may be continuous or intermittent. Eventually, the working conditions will become monotonous or will undergo drastic changes. Thus, probability theory is only a means by which the information of a system is transformed into a possible performance prediction [1-3].
For reliability studies, it is crucial to gain a thorough understanding of the criteria for determining the success or failure of the system, as well as its engineering concepts and performance. In the absence of a complete understanding of these concepts and criteria, an analysis of this kind would become nothing more than a series of mathematical exercises, and the results may be inaccurate and misleading. Therefore, engineering is the reliability of a measurement and a system for engineering [1-3].
Ku et al. in 2000, reliability refers to the long-term quality or the probability of a device’s optimal performance under specific operating conditions over a given peperiod [6].
Today, multirotor drones have found many applications in numerous fields, including aerial filming, rescue, cargo transport, traffic control, etc., due to their advantages over other types of drones [7]. Due to the fact that many multi-rotor missions take place in areas where there are large numbers of people, it is necessary to have high reliability for a safe landing. [8].
Today, there are various methods to evaluate the reliability index in aerospace systems. In this research, we use failure mode analysis methods (FMEA and FTA) to evaluate quadcopter reliability. In the following paragraphs, a brief literature survey on the research of faults and failures in quadcopters is provided.
According to Juliana de Oliveira Martins Franco et al. in 2007, multi-rotor reliability can be increased and improved through failure mode analysis (FMEA) and fault tree analysis (FTA) [9]. Murtha in 2009 states that to improve reliability, FTA can be used to analyze the dynamic behavior of multi-rotors rotors by using Markov models instead of static behavior [10]. In addition to Olson et al. in 2013 analyzed the failure of the Michigan quadrotor, the remaining useful lifemulti-rotore was estimated through FTA. The reliability of multirotors with various configurations was investigated based on the controllability degree [11].
In this research, we investigated the reliability of the electronic board of one of the most famous DJI quadcopters, the Phantom 3, which has received little attention so far, then we analyzed it with FMEA and FTA methods. We have done the failure so that we can identify the failure modes and use them to improve reliability.
1.1. Quadcopter
The quadcopter, also known as a drone or unmanned aerial vehicle (UAV), consists of four motors fixed at the end of the frame structure. The arms of the frame rotate in a clockwise direction while the remaining pair of rotors rotate in a counter-clockwise direction [12].
1.2. DC brushless motors
Drone lifting thrust is provided by the motors that spin the propellers. The majority of drones are powered by brushless DC motors, which provide superior thrust-to-weight ratios in comparison to DC motors that are brushed. Motors are typically given two ratings: Kv ratings and current ratings. The Kv rating indicates how fast the motor will spin (RPM) for 1 V of applied voltage.
1.3. Propellers
A propeller is a type of fan that produce the lift force required to fly the drone. The physical characteristics of Multi-rotor propellers have a significant impact on their performance. Most of the propellers of cheap drones are usually plastic. In cheap drones, the propellers are plastic, soft and flexible and can be easily replaced. On the other hand, in expensive drones, carbon fiber propellers are usually used, which create less noise and more stability.
1.4. Electronic speed controller
In multi-rotors, the propellers are connected to the motors separately. These motors are controlled by an electric speed controller (ESC) to adjust the rotation speed of each motor. By changing the rotation speed of the individual motors, the ESC can help the multirotor to maneuver in different possible directions.
1.5. Battery
One of the most important components of a quadcopter is its battery, which is effective in improving the performance and flight quality of the quadcopter. The flight energy of the quadcopter is provided by lithium polymer batteries. Lithium battery has a long life. On average, these batteries can be charged at least 300 times.
1.6. Video link
To make image processing, we must use a camera and also a video link in our project. We selected a video link.
1.7. Remote control
The main objective of R/C is to control the quadcopter remotely, and there are two conditions for selecting the suitable one. The first is the number of channels you need, and, in our research, we need four channels (X for Roller, Y for Pitch, Z for Yaw, and Throttle (to control the speed of motors)). The second condition is the range of control.
Fig. 1Diagram of quadcopter subsystems
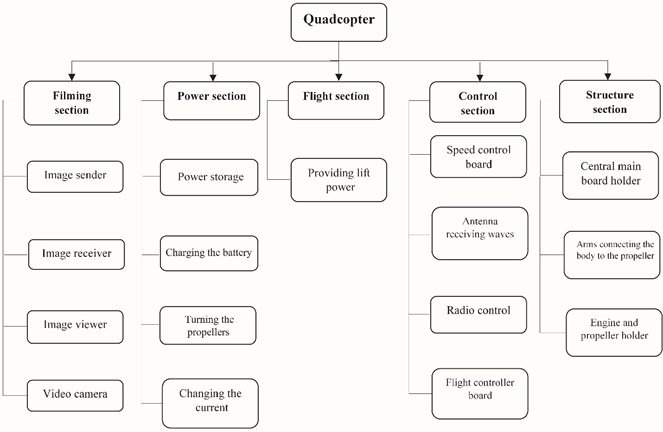
1.8. Block diagrams of quadcopter
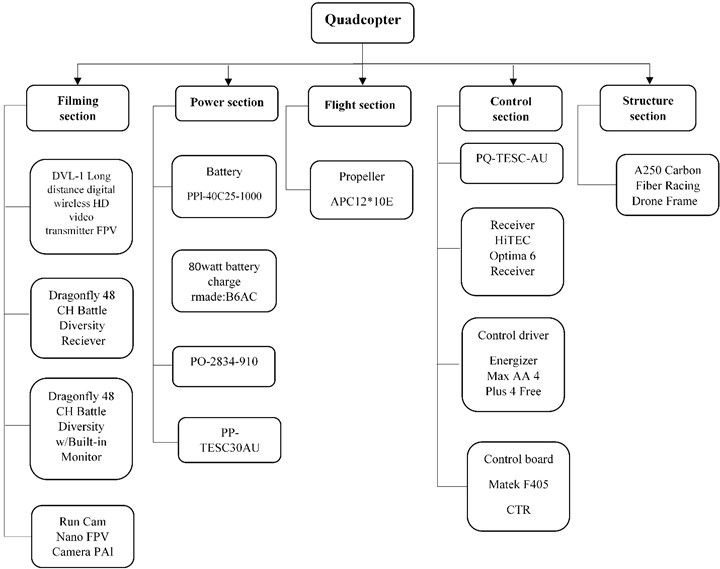
Fig. 1 shows the subsystems and components of the quadcopter, and Fig. 2 shows the type of each component.
Fig. 2Identification diagram of quadcopter components
2. Methodology
The required information should be in accordance with the needs of evaluation methods. In the sense that information should be comprehensive enough to be able to use numerical and experimental methods and also limited enough to avoid gathering unnecessary information and evaluating irrelevant statistics.
In this research, we want to solve our problem by means of numerical methods and using the standards of the field of reliability. Given that for each problem, a suitable indicator should be used to express the reliability of a system in accordance with its user concepts and efficiency, there are various evaluation methods in relation to the appropriate characteristics of the problems. In general, there are two main groups for reliability assessment methods [13].
In general, there are two main groups for reliability assessment methods:
1) Analytical method is in which we resort to mathematical models and express the problem through mathematical formulas and solutions.
2) It is a simulation method. In this method, the estimation of reliability indicators is based on the simulation of real processes and the study of variable behavior and events that occur in a system and therefore includes a series of real tests [3, 4].
We examined and solved the problem based on the first method in the reliability section.
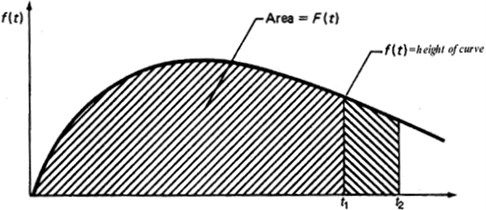
2.1. System life time distribution model
The system life model is expressed as a probability distribution. In order to calculate it, an uncertain and random life with a number n is chosen by overlapping the failure times in this example. The system lifetime model will be obtained as a density function , as shown in Fig. 3.
In the figure above, the area below is the density function between the two times and equal to the value . This value represents the ratio of the total statistical population that is broken between two and times [13, 14].
Fig. 3Life time distribution model
2.2. Reliability function
Mathematically speaking, assuming a random variable that the system reaches a certain failure time, then reliability is defined as follows in Eq. (1):
where, and , is. This can be expressed as follows in Eq. (2):
where, and . as the cumulative distribution function of the probability of failure before the cumulative distribution is the probability of failure before time :
Assuming no defect occurs at the beginning of the system operation, the above relation is rewritten as follows:
If has a fixed value, the final reliability relation is rewritten as follows in Eq. (3):
2.2.1. Parts failure rate
Accurate prediction of the reliability of a system is possible when the failure rate of that system's components or base units is known. The failure rate is defined as the number of failures per unit of time, so if we know the failure rate of a component or base unit, we can determine its reliability based on its relationships and related functions. Under the same environmental conditions, the difference between system applications may be significant. The failure rate may depend on how it is used, user specifications, maintenance operations, measurement methods, and possible differences in the definition of failure [13]. The failure rate of the part in the time interval means the probability of failure in each unit of time, provided that there is no failure or failure to time and is described by the following relation to Eq. (4):
Based on the parts counting method, the failure rate is calculated through the relationship stated in the MIL-217 standard in Eq. (5) [15]:
where equipment failure rate in terms of , element in failure rate in terms of , , is element of quality factor, is element quality of factor, is element of environmental factor to take into account environmental stresses , the number of elements i and n is the total number of different elements in the equipment. Standard tables are used to calculate factor coefficients. We will use the MIL-HDBK-217F and IEC62380 standards here [16,17].
Table 1 shows the failure rate of the electronic parts of the quadcopter board along with the number of parts based on MIL-HDBK-217F and IEC62380 standards.
The temperature inside the quadcopter is calculated based on thermal analysis. After calculating the amount of temperature changes inside the quadcopter, the temperature coefficient was obtained using the MIL-HDBK-217F standard, which is shown in Table 2.
Table 1Defective rate of electronic components and their number [15], [18]
Component | Failure rate (in 106 hour) | Number used |
MC | 0.3920 | 1 |
OC | 0.007 | 11 |
BT | 0.01 | 8 |
ZD | 0.02 | 2 |
GPD | 0.05 | 3 |
PD | 0.01 | 1 |
C | 0.002 | 10 |
R | 0.001 | 20 |
CON | 0.001 | 12 |
REL | 0.002 | 10 |
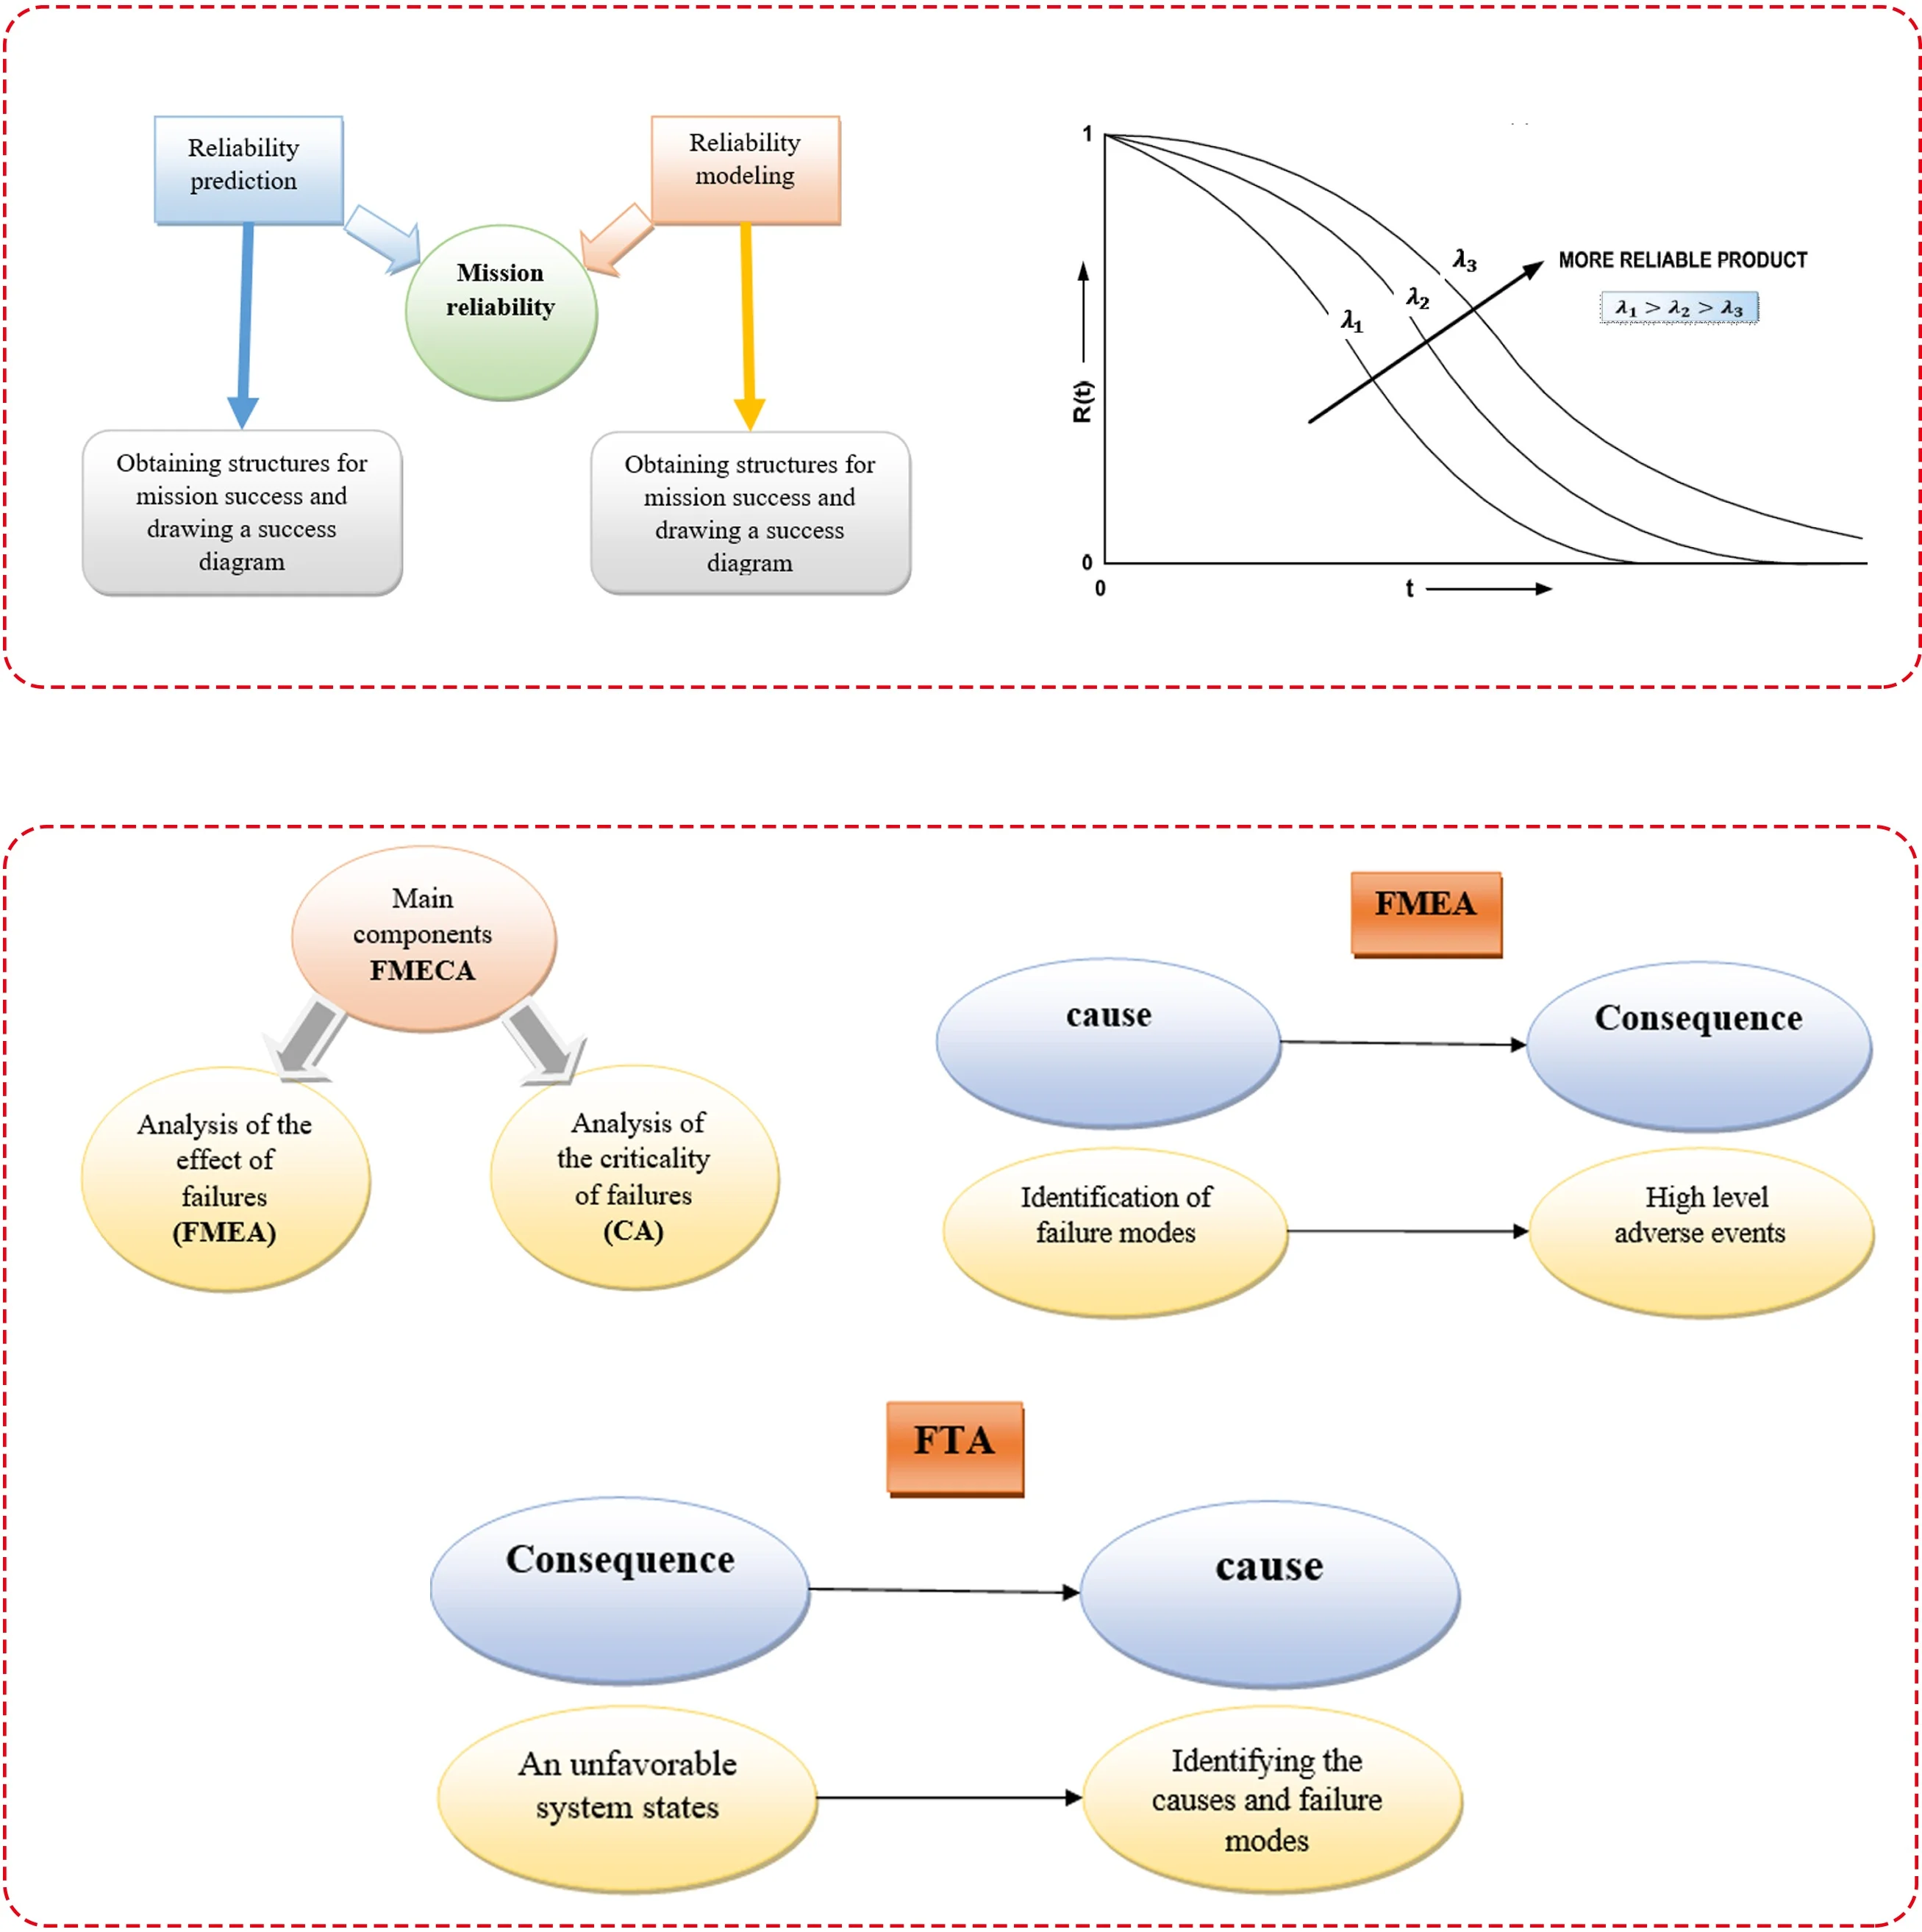
2.3. Failure modes and effects analysis (FMEA, FMECA)
FMEA is generally the analysis of any potential failure in a product, performance or process to determine its effects. FMEA is a method based on pre-occurrence prevention law. FMEA is a tool that is used with the least risk to predict problems and fix defects in the design or development stages of processes and services. By using this method, the search for items that cause a product or process to fail is provided before that product reaches the production stage [19].
FMEA can improve quality, increase reliability, reduce the need for necessary post-construction changes, and reduce manufacturing and assembly costs. This method was formalized in the 1950s as a failure analysis method, and FMEA training programs were developed by Ford in 1972 and used by 3 major US automakers.
Criticality analysis (FMECA) examines and classifies the severity of the impact of each failure on the success of the mission and equipment. In this method, failure modes are investigated and classified according to their probability of occurrence. In FMCEA analysis, the goal is to find critical items in this analysis, critical items are determined based on three parameters: intensity number (Sn), probability number (PN) and critical number (). In the following tables, we examine the FMECA indicators based on the ECSS)Q-ST-30-02C( standard:
The severity number (SN) is proportional to the classification of the damage severity, with the difference that the number 4 is used for the catastrophic state and the number 1 for the negligible state.
Table 2Temperature factor value by temperature [15]
°C | |
20 | 0.91 |
30 | 1.1 |
40 | 1.3 |
50 | 1.5 |
60 | 1.8 |
70 | 2 |
80 | 2.3 |
90 | 2.7 |
100 | 3 |
110 | 3.4 |
120 | 3.7 |
130 | 4.1 |
140 | 4.6 |
150 | 5 |
160 | 5.5 |
170 | 6 |
180 | 6.5 |
190 | 7 |
200 | 7.5 |
Based on this, the catastrophic state of the fault mode is assigned, the effect of which is on the final contractual level of the disaster system and it leads to the loss of the system or its death. Critical mode is assigned to a fault mode whose impact leads to serious damage to the mission but it does not lead to the loss of the mission. The critical mode is assigned to the fault mode, the impact of which leads to less serious injuries system and also leads to temporary loss of mission or transient failure in it. And finally, the ignorable mode is assigned to the fault mode, which does not have a serious impact on the damage to the system, but will still need to be repaired [20].
The probability number (PN) is also between 1 and 4, and the number 4 is for the most probable mode of failure. The critical number (CN) is also the product of the intensity number and the probability number [20].
Table 3Values related to SN based on severity of defects results [20]
SN | The severity of the error result | Intensity level |
4 | Disastrous | 1 |
3 | critical | 2 |
2 | Important | 3 |
1 | Negligible | 4 |
Table 4Values related to PN based on the probability of failure [20]
PN | Range of possibilities | Level |
4 | 10 % | probable |
3 | 1 % 10 % | accidental |
2 | 0.001 % 1 % | unprobeable |
1 | 0.001 % | impossible |
2.3.1. Steps to do FMECA
1 – General knowledge of the system (definition of levels – system components and their functions and operational modes), 2 – determination of failure modes and their causes, 3 – identifying the effects of failures and determination local influence and influence on higher level, 4 – determining the criticality of failures, 5 – classification.
2.4. Fault tree analysis
Fault tree analysis is one of the widely used methods in reliability and risk assessment. Due to its logical nature, this method covers both qualitative and quantitative evaluations and is considered a good supplement for qualitative methods. While the fault tree is a qualitative graphical model, it can be quantified to provide useful information about the probability of occurrence, importance events and their causes. This method uses Boolean logic (zeros and ones) to combine a set of low-level events and is essentially a top-down approach to identify component-level failures that cause system failures [21-24].
Fault tree analysis can be used to perform the system risk assessment process. The purpose of FTA is to identify the effective causes of system failure and reduce risks before they occur. An invaluable tool for complex systems, which visually shows a logical approach to problem identification. In addition, the efficiency of the system can be obtained with this analysis. This method can be implemented alone or as a complement to the Failure Mode and Effects Analysis (FMEA) method [22-27].
2.4.1. Steps to do FTA
1 – goal setting, 2 – determination of the final incident, 3 – determining the context covered, 4 – determination of accuracy analyze, 5 – determining main regulations, 6 – preparation of the fault tree, 7 – analysis of the fault tree.
3. Results
3.1. Reliability
For this project, and according to the temperature conditions inside the quadcopter, the average temperature is about 30 degrees Celsius, so the temperature factor coefficient is 1.1. Also, for the environmental factor that the quadcopter is one of the birds with rotating propellers (), the value of the environmental factor is equal to 8. For the quality factor, the mission is divided into two parts, military and civilian. In the military part, the quality factor is 1 and in the civilian part, the quality factor is 2, and we choose the value 1 for it [13, 16, 21].
Therefore, the final failure rate of each part according to Eq. (5) is expressed in Table 3.
Table 5Electronic components failure rate
Component | Total failure rate (in 106 hours( |
MC | 3.4496 |
OC | 0.6776 |
BT | 0.704 |
ZD | 0.352 |
GPD | 1.32 |
PD | 0.088 |
C | 0.176 |
R | 0.176 |
CON | 0.1056 |
REL | 0.176 |
Table 6Reliability of electronic components
Component | Percentage of reliability |
MC | 85.97 |
OC | 97.07 |
BT | 96.65 |
ZD | 98.31 |
GPD | 93.82 |
PD | 99.57 |
C | 99.1 |
R | 99.1 |
CON | 99.49 |
REL | 99.1 |
3.2. FMEA and FMCEA
Table 7 shows the failure effects analysis for a quadcopter, in which we examined some of the most common quadcopter failures and identified and noted the effect of each failure on quadcopter performance. By doing this, if we observe any of these effects, we can quickly find the cause of the failure and fix it [28-31].
Table 7Damage analysis for a quadcopter
Row | Failure | Failure Effect | SN | PN |
1 | Lightbridge breakdown | Incompetence of remote quadcopter | 2 | 2 |
2 | Speed driver failure | No current in the motor | 3 | 2 |
3 | Controller driver malfunction | Do not divide the input voltage to the motor | 3 | 2 |
4 | Radio controller transmitter board malfunction | No signal received at the receiver | 1 | 1 |
5 | Electric motor failure | Engine overheating | 4 | 3 |
6 | Electric motor failure | Lack of production of rotational mechanical force | 4 | 3 |
7 | Failure of the battery charger | Inability to recharge the battery | 1 | 4 |
8 | Radio controller transmitter board malfunction | The frequency of movement of the motor does not change | 3 | 2 |
9 | GPS sensor failure | Inability to determine status | 1 | 3 |
10 | Anti-interference board failure | Possibility of signal interference and inability to control the quadcopter | 3 | 3 |
11 | IOSD mini board failure | Autopilot capability crashes | 2 | 2 |
12 | IC failure | Quadcopter failure | 4 | 1 |
13 | Battery failure | Quadcopter does not turn on | 2 | 4 |
14 | Defective wiring | Possibility of short circuit and burning of boards | 3 | 4 |
Failure modes that have a severity number of 4 or a critical number higher than 6 are critical. Therefore, cases 2, 3, 5, 6, 8, 10, 13, and 14 are critical cases. Based on the plan's risk-taking policy, the parts that have a greater risk are further analyzed in detail.
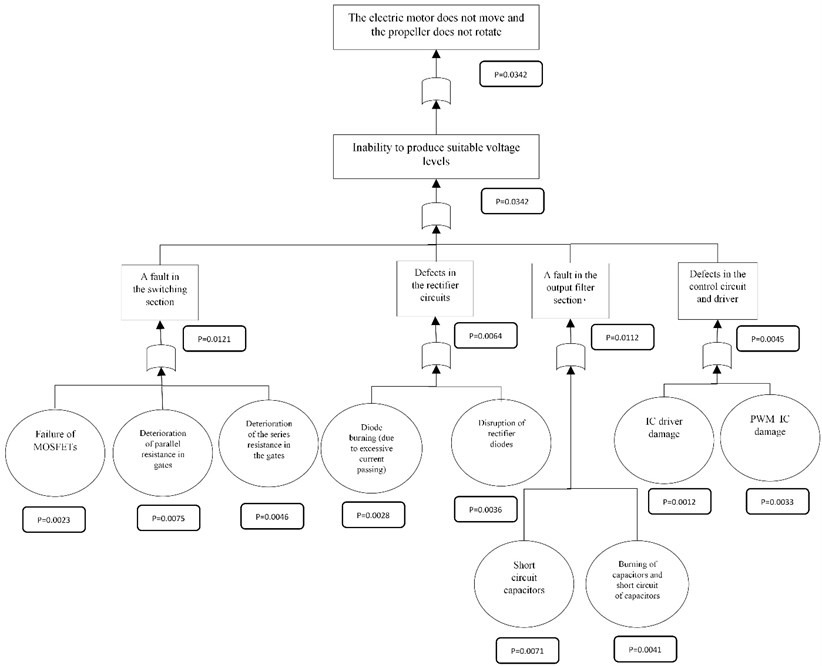
3.3. FTA
In Fig. 4-6, the fault tree for the battery and electric motor and the electric board of the quadcopter are drawn.
Fig. 4Error tree for batteries
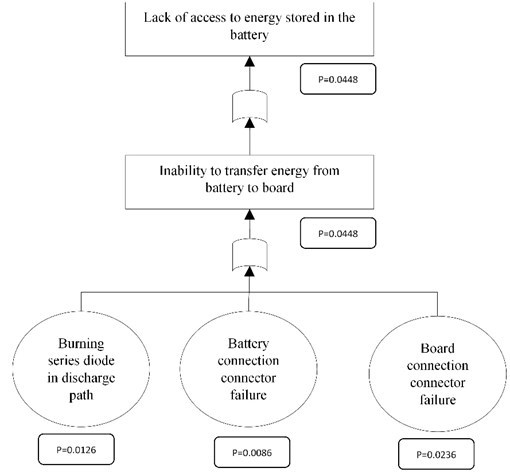
Fig. 5Error tree for electric motor
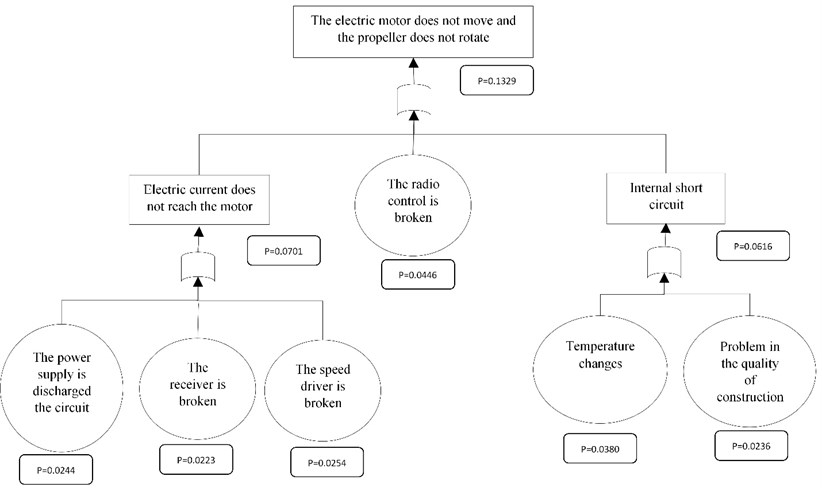
Fig. 6Error tree for electrical board
4. Conclusions
The findings of this study showed how to calculate and quantify the reliability of a quadcopter power board. On the other hand, using FMEA and FMECA and FTA techniques, we investigated possible problems and problems leading to the power system of a quadcopter and identified the critical factors that have a high probability and severity of failure.
In the FMECA investigation, it was found that Speed driver failure, Controller driver malfunction, Electric motor failure, Radio controller transmitter board malfunction, Anti-interference board failure, Battery failure, and Defective wiring can have the highest severity.
In the FTA review, the probability of Lack of access to energy stored in the battery is equal to 0.0448 and the probability of the electric motor does not move and the propeller does not rotate is equal to 0.1329 and finally the probability of The electric motor does not move and the propeller does not rotate is equal to 0.0342.
References
-
Ronald N. Billinton and Roy Allan, Realibility Evaluation of Engineering Systems. Pitman Advanced Publishing Program, 1992.
-
A. Birolini, Reliability Engineering: Theory and Practice. Springer, 2014.
-
V. B. Larin, “Improving the reliability of the control system of a quadcopter,” International Applied Mechanics, Vol. 54, No. 4, pp. 454–462, Jul. 2018, https://doi.org/10.1007/s10778-018-0898-7
-
D. Papadimitriou et al., “Reliability based aerodynamic shape optimization of a quadcopter,” in 2018 AIAA Non-Deterministic Approaches Conference, Jan. 2018, https://doi.org/10.2514/6.2018-0664
-
A. V. Javir, Ketan Pawar, Santosh Dhudum, Nitin Patale, and Sushant Patil, “Design, analysis and fabrication of quadcopter,” Journal of Advance Research in Mechanical and Civil Engineering (ISSN: 2208-2379), Vol. 2, No. 3, pp. 16–27, 2015.
-
W. Kuo and V. R. Prasad, “An annotated overview of system-reliability optimization,” IEEE Transactions on Reliability, Vol. 49, No. 2, pp. 176–187, Jun. 2000, https://doi.org/10.1109/24.877336
-
C. M. Belcastro, D. H. Klyde, M. J. Logan, R. L. Newman, and J. V. Foster, “Experimental flight testing for assessing the safety of unmanned aircraft system safety-critical operations,” in 17th AIAA Aviation Technology, Integration, and Operations Conference, pp. 1–55, Jun. 2017, https://doi.org/10.2514/6.2017-3274
-
Y. Zhang et al., “Fault diagnosis, fault-tolerant and cooperative control for unmanned systems,” IFAC Proceedings Volumes, Vol. 45, No. 20, pp. 564–569, Jan. 2012, https://doi.org/10.3182/20120829-3-mx-2028.00216
-
B. J. Franco and L. C. Goes, “Failure analysis methods in unmanned aerial vehicle (UAV) applications,” in 19th International Congress of Mechanical Engineering, 2007.
-
B. Justin and F. Murtha, “An evidence theoretic approach to design of reliable low-cost UAVs. An evidence theoretic approach to design of reliable low-cost,” Jun. 2009.
-
I. Olson and E. M. Atkins, “Qualitative failure analysis for a small quadrotor unmanned aircraft system,” in AIAA Guidance, Navigation, and Control (GNC) Conference, pp. 1–11, Aug. 2013, https://doi.org/10.2514/6.2013-4761
-
D. I. I. M. Ostrava, Design and Manufacturing of Tools. 2019, p. 86.
-
J.-F. Castet and J. H. Saleh, “Beyond reliability, multi-state failure analysis of satellite subsystems: A statistical approach,” Reliability Engineering and System Safety, Vol. 95, No. 4, pp. 311–322, Apr. 2010, https://doi.org/10.1016/j.ress.2009.11.001
-
J. C. Barbero-Álvarez, A. Coutts, J. Granda, V. Barbero-Álvarez, and C. Castagna, “The validity and reliability of a global positioning satellite system device to assess speed and repeated sprint ability (RSA) in athletes,” Journal of Science and Medicine in Sport, Vol. 13, No. 2, pp. 232–235, Mar. 2010, https://doi.org/10.1016/j.jsams.2009.02.005
-
D. O. Defense, MIL-HDBK-217F. Realibility Prediction of Electronic Equipment. 2010.
-
I. Häring, Technical Safety, Reliability and Resilience. 2021.
-
S. T. Sitompul and P. Pariatmono, “Reliability of simple space truss structure,” Astonjadro, Vol. 11, No. 3, pp. 600–607, Sep. 2022, https://doi.org/10.32832/astonjadro.v11i3.7399
-
“IEC62380, Universal model for reliability prediction of electronics components, PCBS and equipment,” International Electrotechnical Commission, 2004.
-
L. Ouyang, Y. Che, L. Yan, and C. Park, “Multiple perspectives on analyzing risk factors in FMEA,” Computers in Industry, Vol. 141, p. 103712, Oct. 2022, https://doi.org/10.1016/j.compind.2022.103712
-
“Spacecraft Mechanical Loads Analysis Handbook ECSS-Q-ST-30-02C,” ECSS, 2013.
-
J. Metsämuuronen, “Attenuation-corrected estimators of reliability,” Applied Psychological Measurement, Vol. 46, No. 8, pp. 720–737, Nov. 2022, https://doi.org/10.1177/01466216221108131
-
M. Farahmand, M. Ganji, and S. M. Sajadi, “Reliability evaluation and improvement of manufacturing helicopter in an aircraft manufacturing company – case study: skid types helicopter landing gear,” International Journal of Industrial and Systems Engineering, Vol. 31, No. 1, p. 95, 2019, https://doi.org/10.1504/ijise.2019.10017868
-
J. Halme and A. Aikala, “Fault tree analysis for maintenance needs,” Journal of Physics: Conference Series, Vol. 364, No. 1, p. 012102, May 2012, https://doi.org/10.1088/1742-6596/364/1/012102
-
L. Ostrom and C. Wilhelmsen, “Basic fault tree analysis technique,” Risk Assessment, pp. 185–202, Aug. 2019, https://doi.org/10.1002/9781119483342.ch14
-
S. Xin, X. Zhu, S. Liu, and J. Guo, “Research on fault tree reconstruction based on contingency,” Processes, Vol. 10, No. 2, p. 427, Feb. 2022, https://doi.org/10.3390/pr10020427
-
D. F. Haasl, N. H. Roberts, W. E. Vesely, and F. F. Goldberg, “Fault tree handbook,” Division of Systems and Reliability Research, 1981.
-
“ECSS-Q-ST-40-12C, Fault tree analysis,” FMEA, 2013.
-
T. A. Carbone and D. D. Tippett, “Project risk management using the project risk FMEA,” Engineering Management Journal, Vol. 16, No. 4, pp. 28–35, Dec. 2004, https://doi.org/10.1080/10429247.2004.11415263
-
M. Domagala, Power Components Semiconductors. 2022, p. 5947.
-
H. Razouk and R. Kern, “Improving the consistency of the failure mode effect analysis (FMEA) documents in semiconductor manufacturing,” Applied Sciences, Vol. 12, No. 4, p. 1840, Feb. 2022, https://doi.org/10.3390/app12041840
-
C.-I. Pascu, R. Malciu, and I. Dumitru, “Perspective chapter: defining and applying the FMEA process method in the field of industrial engineering,” Failure Analysis [Working Title], Oct. 2022, https://doi.org/10.5772/intechopen.107401
Cited by
About this article

The authors have not disclosed any funding.
The datasets generated during and/or analyzed during the current study are available from the corresponding author on reasonable request.
Kazem Imanin contributed as a formal analyst. Amirhossein Gholami assisted with Conceptualization, Data Curation, Investigation, Methodology, Project Administration, Resources, Supervision, Validation, and Visualization. Mahdi Bagherian Dehaghi contributed to Methodology, Writing Original Draft Preparation, Writing Review, and Editing.
The authors declare that they have no conflict of interest.
