Abstract
Considering the uncertainties of seismic excitation and stochastic parameters of the Inter-story Isolation Structure, the implicit structural response function is transformed into an explicit one by the Stochastic Response Surface Method (SRSM), combined with a probabilistic collocation method based on the linear independence principle. By using the reliability analysis method based on the first-passage failure, the reliability of isolation structure is analyzed and the sensitivity of the reliability of each sub-structure is further analyzed. The results show that conducting sensitivity research based on reliability analysis can provide an important theoretical basis for an optimized and robust design of a random vibration system. The changes of the stiffness and damping ratio of the Isolation Layer have a great influence on the reliability of the system and have different effects on the reliability of different parts of the system. The analysis results of reliability sensitivity could provide system reliability indexes to rank stochastic parameters by their importance, thus improving the efficiency of the structure reliability analysis and optimization design.
Highlights
- Reliability sensitivity analysis of stochastic structures is introduced into the Inter-story Isolation System.
- Considering the uncertainties of seismic excitation and stochastic parameters of the Inter-story Isolation Structure.
- The random response surface method and the reliability analysis method based on the first over failure are used to study the influence of random variables on reliability sensitivity.
1. Introduction
Reliability sensitivity reflects the impact of the change of design parameters on failure probability, which is often used in the reliability-based optimization design of structures to determine a search direction for an optimal solution and plays an important role in reliability-based optimization design of structures. Reliability sensitivity is defined as the ratio of the variation of the failure probability caused by change in the distribution parameters of basic random variables [1-3]. Mathematically, it is the partial derivative of the failure probability to the distribution parameters of basic random variables. In multivariate reliability analysis, Hohenbichler and Rackwitz [4] first put forward the traditional concepts of sensitivity and importance. Karamchandani and Cornell [5] analyzed the reliability sensitivity of structures of distributed parameters based on first-order and second-order reliability analysis. Wu [6] put forward an effective adaptive importance sampling method to analyze the reliability and reliability sensitivity of structures. Robert et al. [7] put forward the MPPSS (Most Probable Point System Simulation), which is suitable for calculating series systems, parallel systems, and series-parallel hybrid systems and can be used to determine the system sensitivity factor, that is, the importance of each random variable to the system reliability. Lu et al. [8] used the point estimation method and high-order moment standardized technology to analyze the sensitivity of the failure probability to the change of randomly distributed parameters. Due to the low efficiency of the Monte Carlo method, Wu et al. [9] put forward the adaptive importance sampling method for calculating structure reliability and reliability sensitivity, in which sampling density in proportion to the joint probability density of random variables was used to improve the sampling efficiency. Lu et al. [10] put forward the reliability sensitivity analysis method for subset sampling and line sampling.
For the description of uncertain factors, Guo et al. [11] analyzed the sensitivity of structure parameters under the variables of mixed types, i.e., random variables and interval variables. Song et al. [12] developed a method based on a matrix to transform the solution of system reliability into matrix operation and analyzed the sensitivity of each distributed parameter under system reliability on this basis. Zhang et al. [13-15] dealt with the reliability sensitivity problem of single degree-of-freedom nonlinear vibration systems with random parameters and put forward a numerical method for reliability sensitivity analysis of mechanical parts with multiple failure modes. Yuan et al. [16] developed two reliability sensitivity analysis methods under the non-normal random variables for non-linear limit state equations. Valdebenito et al. [17] analyzed linear systems under random excitations in depth and put forward a new method for analyzing reliability and reliability sensitivity of linear systems. Song et al. [18] developed fuzzy reliability sensitivity by using the moment method on the basis of the fuzzy theory. Qiao et al. [19, 20] established the reliability sensitivity analysis method based on the stochastic response surface method and applied it to the reliability-based optimization design of structures. In order to quantitatively evaluate the contribution of various uncertainties to the uncertainty of wind-induced response of structures. Wu et al. [21] conducted parametric sensitivity studies on wind-induced response of typical long-span roof structures. Sun et al. [22] took the stiffness ratio, the post-yield stiffness coefficient, the yield displacement of the isolation layer, the friction coefficient, the mass ratio and the natural period of the superstructure as the influencing factors, sensitivity analysis of the total earthquake input energy is carried out for rural building structures supported on sliding base-isolation systems. Dong et al. [23] deduced the recursion formula of honeycomb-type cable dome with two struts under prestress distribution state, and studied the distribution characteristic and rule of prestress distribution state through parameter analysis, and deeply analyzed the sensitivity of each parameter. Khaneghahi et al. [24] used global sensitivity analysis based on improved Latin hypercube sampling to indicate the influence of each random variable and their interaction on variance of the responses, which could show how each random variable and its interactions affect the response variance.
As a new type of structural system, the Inter-story Isolation System shows the different working mechanisms and main parameters affecting structural reliability due to the different locations of the Isolation Layer. Therefore, it is of great significance to study the main parameters affecting the structural reliability due to the change of the Isolation Layer location for the economy and safety of the Inter-story Isolation System. In this paper, reliability sensitivity analysis of stochastic structures is introduced into the Inter-story Isolation System. Considering the uncertainty of seismic excitation and random parameters, the random response surface method and the reliability analysis method based on the first over failure are used to study the influence of random variables on reliability sensitivity. Through the sensitivity analysis of structural reliability, it can be determined which design parameter is the most effective to adjust, so as to select as few optimization variables as possible, to help engineers and technicians reasonably establish the safety tolerance of the structural system and control the impact of random parameters on the safety of the structural system. This analysis has guiding significance for the reliability design, modification, and optimization of the Inter-story Isolation System.
2. Modeling of the Inter-story isolation system
2.1. Equations of motion
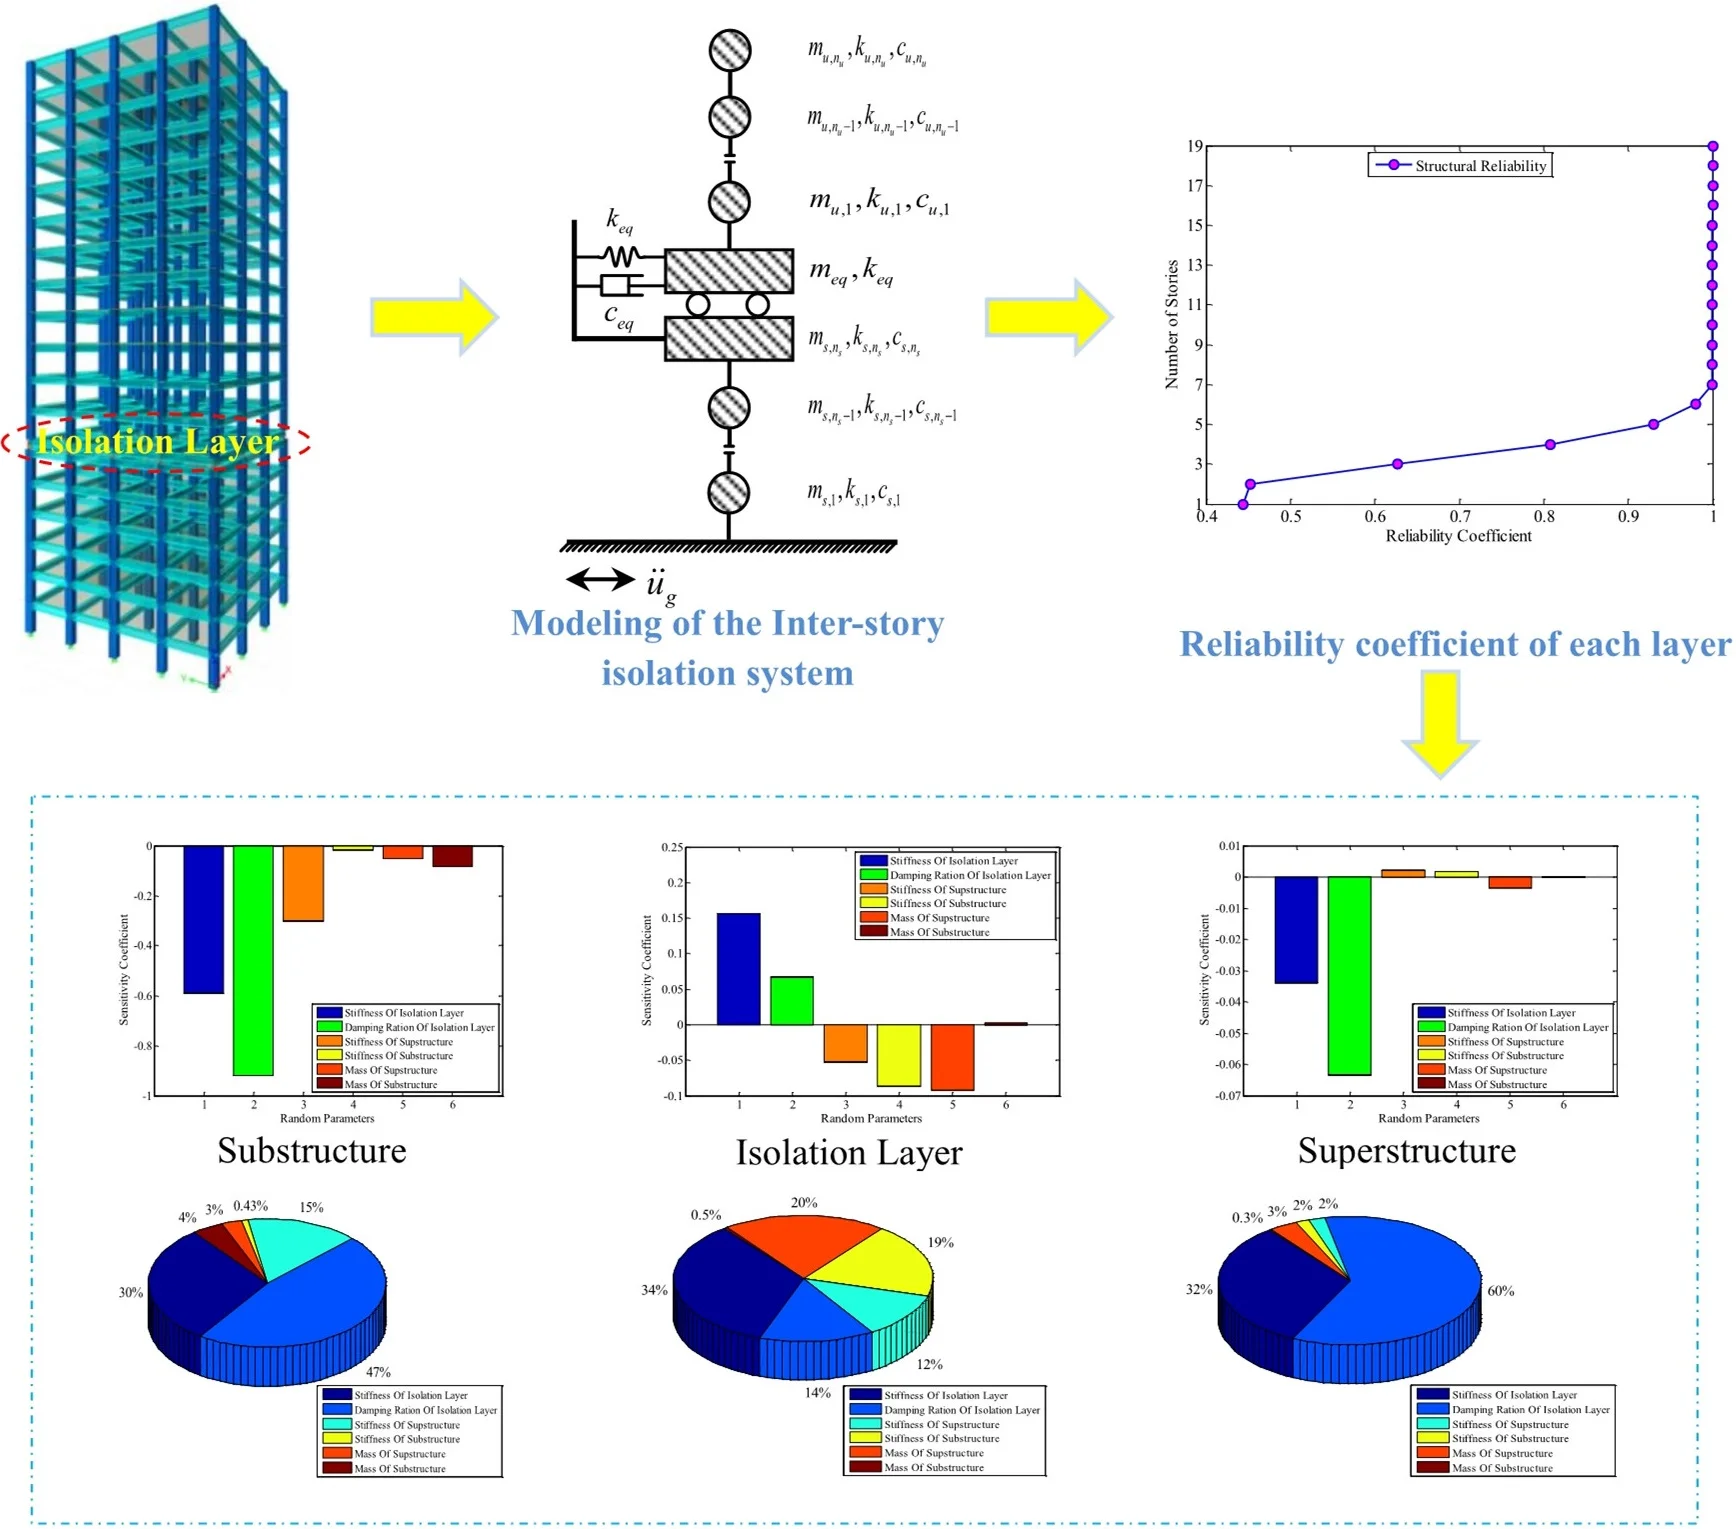
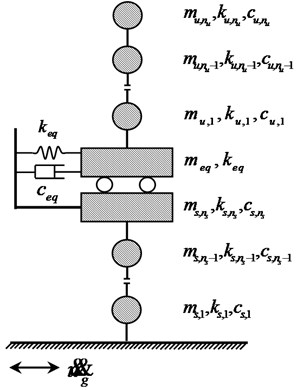
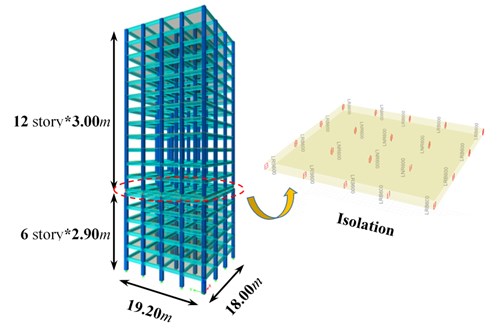
Fig 1. illustrates the calculation model of a Inter-story isolation system consisting of two sub-structures and isolation layer of , and one story, respectively. For the shear-type buildings, the equation of the structural system can be expressed as:
where , and are the -dimensional () mass, damping, and stiffness matrices of the system, respectively. is the -dimensional relative displacement vector with respect to the ground and a dot over the symbol indicates differentiation with respect to time. is the load index vector with all its elements equal to 1. is the ground motion acceleration.
Fig. 1Computational model of the Inter-story isolation structure
In order to derive the covariance matrix equation, the equation of motion can be transformed to the state-space form:
where:
This equation can be solved by Complex mode method, which is much easier. It is unnecessary to go into details. Given the transfer function matrix such that [25]:
where and are the complex eigenvalue and complex exponential, respectively, which is performed by Complex modal analysis method, is the imaginary unit . The sign “*” represents the complex conjugate and the superscript “” denotes the transpose of a matrix.
2.2. Seismic response under filtered white noise excitation
The Clough-Penzien filtered white noise ground motion model, which has been widely used in earthquake engineering, can be represented by the following spectrum [26]:
where , , , and may be regarded as the characteristics parameters of the soil surrounding.
The auto-power cross-power spectral density function of the displacement response of the system under the ground acceleration can be determined by [27]:
The displacement response standard deviation of each floor can be evaluated through the numerical integration of the auto-power cross-power spectral density function:
And its standard deviation of acceleration response is given by:
3. Sensitivity analysis of structural reliability
3.1. Dynamic reliability based on the First-passage Failure
Dynamic reliability analysis of structures subjected to earthquake action is a typical analysis based on the First-passage Failure [27]. Assume that both seismic excitation and structural response are stationary random processes with zero mean. Recording and are extremes (absolute maximum) and standard deviations of structural response , respectively, and the dimensionless parameters are defined here:
According to the assumption that the number of horizontal crossings is a Poisson process, the expected value of the extreme value of is approximately equal to:
The standard deviation of the extreme value of is:
The expectation of the extreme value of the stochastic process can be expressed as:
The state equation of the Inter-story Isolation System expressed by the limit state of the inter-story displacement angle is as follows:
where is the bounded interlayer displacement angle, is the extreme mean of the interlayer displacement angle, and is the vector of random variables.
Limit state function: is failure state. is a safety state.
The reliability index is defined as:
If obeys a normal distribution, reliability can be obtained:
3.2. Stochastic response surface model
The Stochastic Response Surface Method (SRSM) [28] is based on the assumption that random variables with square integrable probability density function can be expressed as functional forms of independent standard distribution random variables. SRSM converts input random variables into functions of independent and identically distributed standard normal random variables, and uses chaotic polynomials of independent standard normal random variables to describe random responses.
The input random parameters of the structure affect the output response of the structure. If the input random parameters are represented by independent standard normal random variables , the output model of the structure can be expressed as a chaotic polynomial model with only standard normal distribution random variables [29]:
where represents the structural response variable, is the number of random variables in the input model, is the random variable of standard normal distribution, and is a -order -dimensional Hermite polynomial:
The results of the stochastic response surface method depend on the probabilistic collocation selection of the parameter , ,…, to be estimated. Generally speaking, the expansion collocation of p-order random polynomials is determined by the root of ()-order Hermite polynomials. According to this method, the number of collocation points available is:
For random variables, the number of expansion terms of -order Hermite polynomials (undetermined coefficient) is:
Generally speaking, , so choosing collocation is only part of . In this paper, the probability collocation points are selected based on the principle of linear independence, and a large number of linear correlation collocations are eliminated to ensure that the coefficient matrix of chaotic polynomials is linear-independent in rows. Moreover, the coefficient matrix is a full rank matrix, and the undetermined coefficient has a unique solution. This not only ensures the stability of the calculation results, but also significantly improves the calculation efficiency.
The above sample points are all in the standard normal space and are converted to the original space according to need. Variables selected in this paper are assumed to obey normal distribution, and the transformation form is as follows:
where and are the mean and standard deviation of the variable , respectively. The original space sample points are transformed to form test samples, and the real response of the structure is obtained by a dynamic analysis method. The undetermined coefficients can be obtained by solving the linear equations with the least squares method, i.e., the explicit expression function of the stochastic response surface model.
To ensure the adaptability of the stochastic response surface model, the multiple fitting coefficient and the modified multiple fitting coefficient are used to test adaptability, and the coefficients are defined as follows:
where is the coefficient matrix of the parameter to be estimated, is the Hermite polynomial combination matrix, is the response matrix, is the number of samples for model validation, and is the number of random variables.
3.3. Sensitivity analysis of reliability
The reliability sensitivity reflects the influence of changing the design parameters on the failure probability. It helps to determine the search direction of the optimal solution of structural reliability optimization design, which is an important part of structural reliability optimization design [30]. In our paper, a reliability sensitivity analysis method based on Monte Carlo simulation was established on the explicit function generated by SRSM. The sensitivity of the mean matrix and the mean square deviation matrix of the basic random parameter vector is expressed as follows:
where:
4. Analytical results of Inter-story isolation structure
4.1. Structural model parameters
Taking the minimum base shear force as the optimization goal, superstructure and substructure optimal frequency ratio 0.165 and Isolation layer optimal damping ratio 0.25 are obtained by the NSGA-II optimization method [31], in mass ratios 2.0. The average value of mass, the shear stiffness and damping ratios of the 12-story to 6-story are uniform for each story. The mass, the shear stiffness and damping ratios is 2.0×10⁶ kg, 4.0×10⁹ N/m and 0.05. The Isolation layer average value of mass and the shear stiffness is 2.0×10⁶ kg and 7.93×10⁷ N/m. Assume that the random variables of the structure are the Isolation Layer stiffness, , the Isolation Layer damping ratio, , the superstructure and substructure stiffness, and , and the superstructure and substructure mass, and , and the coefficient of variation are 0.10, 0.12, 0.10, 0.10, 0.08, 0.08, respectively. It is also assumed that all the above random variables obey normal distribution. The heights of the superstructure and substructure are 3.0 m and 2.9 m, respectively.
The Clough-Penzien filtered white-noise spectrum is used as the ground acceleration spectrum in the computation. The characteristic ground frequency, the characteristic damping ration, and the intensity of an earthquake in the ground acceleration spectrum are selected as 9.537 cm2/s, 17.95 rad/s, 0.72, 0.15, .
4.2. Analysis of structural model examples
Using SRSM, the input variables , , , , , are converted into functions of independent and identically distributed standard normal random variables. The inter-layer displacement angle, the output variable of the structure, is expressed as a second-order SRSM. The corresponding collocation uses the roots of the third-order one-dimensional Hermite polynomial.
The one-dimensional third-order Hermite polynomial is , and the corresponding roots are: –, 0, . The output variable is a third-order SRSM:
According to the example parameters, there are 6 random variables. Using the third-order Hermite polynomial, we can see that the number of collocations to be selected is 729 and the number of undetermined coefficients in the SRSM expansion formula is 28, according to Eq. (18). Selecting the probability collocation based on the linear independent principle can ensure the stability of the calculation results and improve the calculation efficiency.
The random variables are , and according to the sub-structure responses, the Stochastic Response Surface Function coefficients are expressed as follows:
(1) The Stochastic Response Surface Function coefficients of the substructure response:
{–0.073};
{7.164×10⁻¹¹, 0.053, 2.728×10⁻¹³, –1.414×10⁻¹², 1.129×10⁻⁹, 2.091×10⁻⁹};
{1.017×10⁻²⁰, –0.066, –1.453×10⁻²², 1.084×10⁻²², 1.664×10⁻¹⁷, 4.303×10⁻¹⁷, –5.044×10⁻¹⁰, 6.712×10⁻²¹, 1.004×10⁻²², 3.699×10⁻¹⁸, –1.236×10⁻¹⁸, 1.481×10⁻¹², 1.315×10⁻¹², –4.229×10⁻¹¹, –3.353×10⁻¹⁰, 1.244×10⁻²², –1.235×10⁻¹⁹, –2.819×10⁻²⁰, –4.101×10⁻²¹, –2.253×10⁻¹⁹, –3.947×10⁻¹⁶}.
(2) The Stochastic Response Surface Function coefficients of the Isolation Layer response:
{–13.183};
{5.715×10⁻⁹, 9.427, –1.956×10⁻¹¹, –1.624×10⁻¹⁰, 3.889×10⁻⁷, –1.080×10⁻⁸};
{3.374×10⁻¹⁷, –12.412, -1.353×10⁻²⁰, 7.319×10⁻²¹, 2.097×10⁻¹⁵, 1.575×10⁻¹⁴, –8.252×10⁻⁸, 7.411×10⁻¹⁹, 8.088×10⁻¹⁹, –1.745×10⁻¹⁵, –2.776×10⁻¹⁷, 1.664×10⁻¹⁰, 2.585×10⁻¹⁰, –1.518×10⁻⁷, –2.188×10⁻⁹, 1.190×10⁻²⁰, –1.039×10⁻¹⁷, 1.024×10⁻¹⁷, –6.397×10⁻¹⁸, –1.141×10⁻¹⁷, –2.418×10⁻¹⁴}.
(3) The Stochastic Response Surface Function coefficients of the superstructure response:
{0.077};
{–5.640×10⁻¹¹, –0.054, –2.318×10⁻¹³, 8.207×10⁻¹³, 2.047×10⁻¹⁰, 3.762×10⁻¹⁰};
{–1.919×10⁻²⁰, 0.070, 1.078×10⁻²², –3.230×10⁻²³, –7.282×10⁻¹⁷, –5.954×10⁻¹⁷, 4.279×10⁻¹⁰, –4.245×10⁻²¹, –4.491×10⁻²¹, 3.995×10⁻¹⁸, 4.750×10⁻¹⁹, –5.280×10⁻¹³, –1.499×10⁻¹², 3.978×10⁻¹⁰, –4.060×10⁻¹¹, –5.620×10⁻²³, –7.592×10⁻²⁰, –4.855×10⁻²⁰, 9.520×10⁻²⁰, 7.051×10⁻²¹, 1.330×10⁻¹⁷}.
According to the Eqs. (20) and (21), the adaptability test of the function fitted by the SRSM was conducted. The multi-fit coefficient and the modified multiple fitting coefficient can be gotten by testing the inter-layer displacement angle, the mean and the mean square deviation of the displacement of the Isolation Layer. The results are as shown in Fig. 2. Using the Monte Carlo method to sample and simulate 1.0×10⁶ times, the probability and statistical parameters of the state function of the Inter-story Isolation System can be calculated, as shown in Table 1. Combined with the fitting coefficients and probability and statistical parameters, it can be seen that the established chaotic polynomial response surface function has a good fitting effect, and the SRSM has high precision for simulating random structures.
Fig. 2Multi-fit coefficients of each sub-structure response extreme value
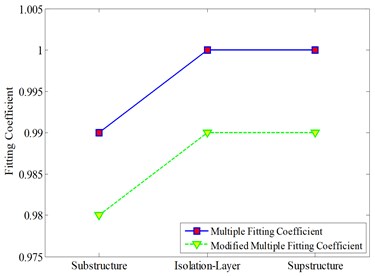
Table 1Comparison of probability and statistical information
Number | Structuring form | Mean of limit state | Mean variance of limit state | ||
SRSM | Monte Carlo Method | SRSM | Monte Carlo Method | ||
1 | Superstructure | 6.3146×10⁻⁴ | 6.3139×10⁻⁴ | 3.9315×10⁻⁴ | 3.9216×10⁻⁴ |
2 | Isolation layer | 0.0463 | 0.0463 | 0.0758 | 0.0872 |
3 | Substructure | 6.1340×10⁻⁴ | 6.1341×10⁻⁴ | 3.5214×10⁻⁴ | 3.5045×10⁻⁴ |
4.3. Reliability analysis
The dynamic reliability was obtained by using the reliability analysis method based on the first-passage failure in Section 3.1, as shown in Fig. 3, wherein the inter-layer displacement angle limit of the superstructure was taken as 1/550 rad, and the inter-layer displacement angle limit of the substructure was taken as 1/450 rad. The horizontal displacement of the Isolation Layer takes the maximum value in the value 0.55 times the effective diameter of the isolation bearing and the value 3.0 times the total thickness of the bearing rubber.
Fig. 3Reliability coefficient of each layer
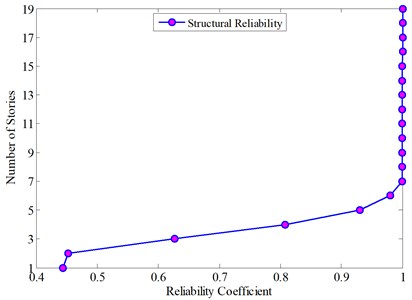
It can be seen from Fig. 3 that the reliability of the first layer of the substructure is the lowest, and its value is 44.35 %. As the number of layers increases, the reliability increases, with the reliability of the Isolation Layer and the superstructure 99.34 % and 100 %, respectively.
4.4. Sensitivity analysis of reliability
Assuming that the random parameters are independent of each other, let the random variable mean matrix and the mean square deviation matrix be:
To investigate the influence of different random parameters on the reliability of the system, the sensitivity analysis method of system reliability was established, using the chaotic polynomial of independent standard normal random variables to describe the random response, and the influence degree of different random parameters on the reliability of the system was discussed.
It can be seen from Fig. 6. that in the Isolation Structure System, due to the interaction between the substructure and the superstructure, the random earthquake action causes mutual coupling of the sub-structures, so that the same parameters have different effects on the reliability of each sub-structure. From the overall analysis results, the damping ratio and stiffness of the Isolation layer have a greater impact on the reliability of each sub-structure. An increase in these parameters will increase the reliability of the Isolation layer and, in turn, a decrease will reduce the reliability of the substructure and the superstructure.
For the superstructure, the degree of influence of different random parameter changes on its reliability is ordered as , which is shown in Fig. 6(a). For the Isolation Layer, the degree of influence of different random parameter changes on its reliability is ordered as , which is shown in Fig. 6(b). For the substructure, the degree of influence of different random parameter changes on its reliability is ordered as , which is shown in Fig. 6(c). Among them, the positive sign indicates that the system reliability increases with an increase of the mean value of the random variable, and the system tends to be safe; the negative sign indicates that the system reliability decreases with an increase of the mean value of the random variable, and the system tends to fail.
Fig. 6Sensitivity of extreme reliability and relative sensitivity of normalization
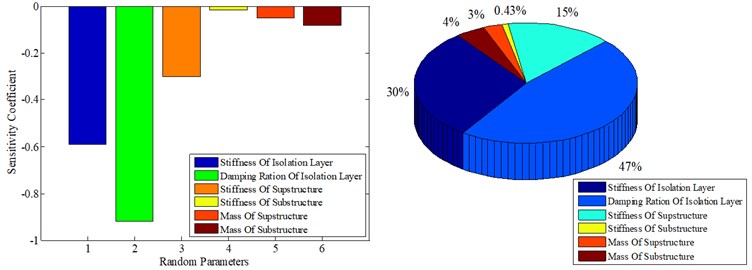
a) Substructure
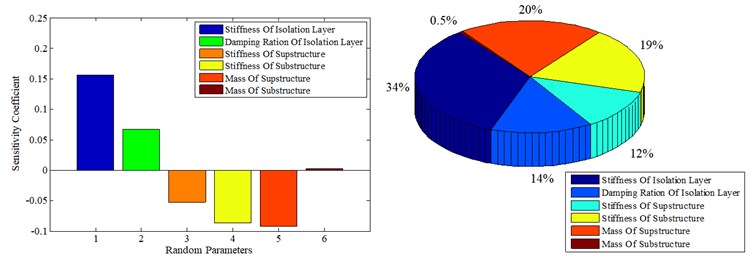
b) Isolation layer
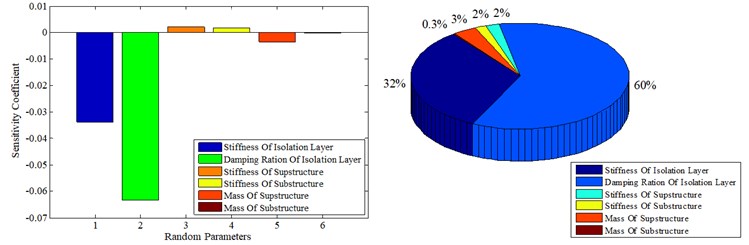
c) Superstructure
4.5. Results in time domain
4.5.1. Analytical model
To gain a better understanding of the dynamic behavior of the building, and further verify the sensitivity of random parameters on structural reliability under seismic excitation, three-dimensional finite element analysis software (ETABS) was used to analyse the Inter-story isolation structure. Three-dimensional beam and beam elements were selected for the beams and columns, floor elements and Isolation bearing were used for the floor slabs and Rubber Isolator. Fig. 7 shows the side view of the analytical model, in which the longitudinal direction is defined as axis and the lateral direction as axis . The heights of the superstructure and substructure are 3.0 m and 2.9 m, respectively. Assume that the coefficient of variation are 0.10, 0.12, 0.10, 0.10, 0.08, 0.08 of the Isolation Layer stiffness, the Isolation Layer damping ratio, the superstructure and substructure stiffness, and the superstructure and substructure mass, respectively.
Fig. 7Analytical model of Inter-story isolation structure
4.5.2. Analytical dynamic characteristics
The first four period are 2.586, 2.572, 2.205 and 0.588 s, respectively and the corresponding modes are translation in of superstructure, translation in of superstructure, torsion of superstructure and translation in of structure, as shown in Fig. 8.
Fig. 8First four vibration modes
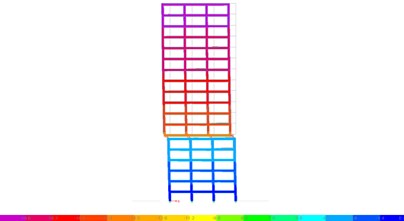
a) First vibration mode
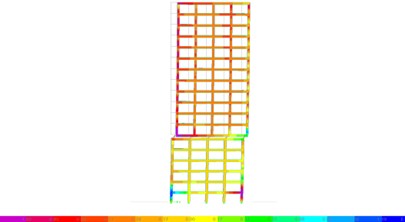
b) Second vibration mode
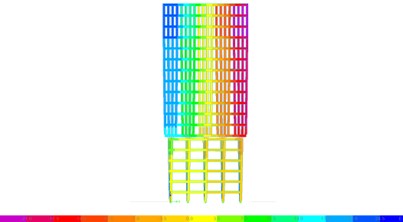
c) Third vibration mode

d) Fourth vibration mode
4.5.3. Time history analysis
The Inter-story isolation structure was analysed using the El centro (1940), Kobe (1995), and Northridge (1994) accelogram. The time history curve and time-frequency diagram actual earthquake are displayed in Fig. 9. It can be seen from the spectrogram that the spectral components of the seismic wave are selected mainly in the middle and low frequency, and the energy distribution is wider. The ground motion input was one-dimensional and peak acceleration was set to be 70 gal corresponding to minor earthquake.
Fig. 9The historically recorded curve and time-frequency diagram
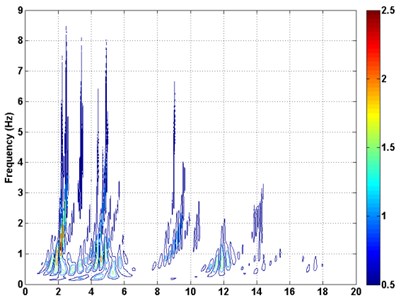
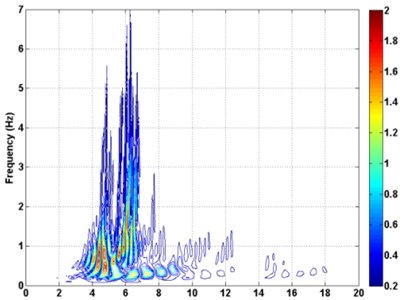
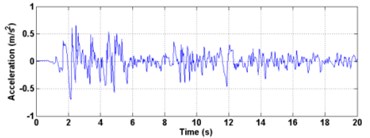
a) El centro
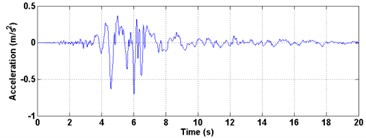
b) Kobe
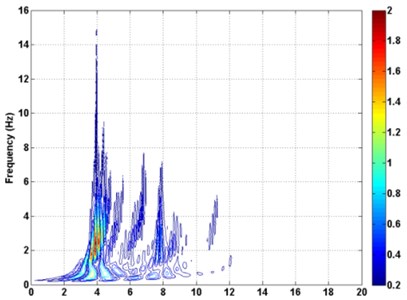
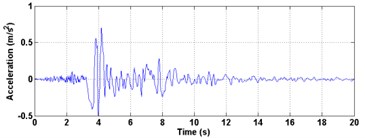
c) Northridge
The time history analysis is conducted on the structural system excited by seismic acceleration records, with the peak accelerations being scaled to 70 gal. Each random parameter are increased separately by one time mean square error. Fig. 10(a) reports the average values of isolation layer displacement with the change of each parameter under the three earthquakes, each graph reports the parameters in term of the Isolation Layer stiffness (SI, □), the Isolation Layer damping ratio (DRI, ■), the superstructure stiffness (SSP, △), the substructure stiffness (SSB, ○), the superstructure mass (MSP, ▲), the substructure mass (MSB, ●). The virtual line reports the average values of isolation layer displacement under the three earthquakes. It can be seen from that the change of each parameter has different effects on the isolation layer displacement. With the increase of the stiffness and the damping ratio of the isolation layer as well as the mass of the substructure, the isolation layer displacement will be reduced, conversely, the other parameters will increase the displacement of the isolation layer and reduce the reliability of the isolation layer. These results also coincide with the law revealed in Fig. 6, but the degree of sensitivity has difference of parameters, which is mainly caused by the small number of selected seismic wave samples. Fig. 10(b) and Fig. 10(c) shows the interlayer displacement angle of the superstructure and substructure. For the substructure, the stiffness and the damping ratio of the isolation layer have larger influence on the interlayer displacement angle. With the increase of the stiffness and the damping ratio, the interlayer displacement angle will be increased and reduce the reliability of the substructure, and others have the same effect. In the same way, For the superstructure, with the increase of the stiffness and the damping ratio of the isolation layer, the interlayer displacement angle will be increased and the system tends to be dangerous, substructure and superstructure stiffness increased that could reduce interlayer displacement angle, and the system tends to be safe, other parameters have relatively little effect. These results are consistent with the sensitivity analysis of system in section 4.4.
Fig. 10Interlayer displacement angle of each part of the structure
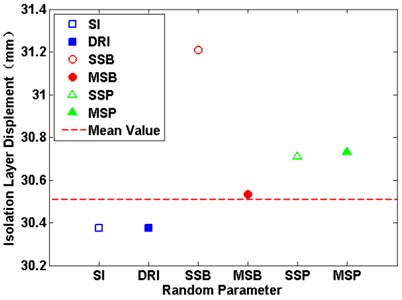
a) The isolation layer
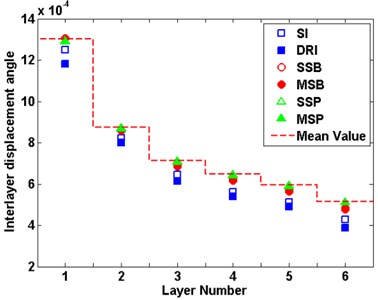
b) Substructure
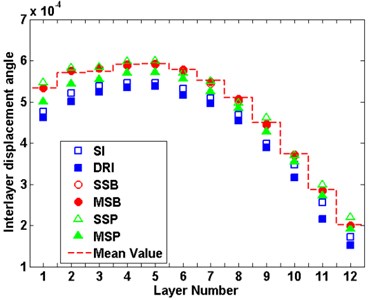
c) Supstructure
5. Conclusions
1) By conducting sensitivity research based on the reliability analysis of the Inter-story Isolation System, a quantitative relationship between the reliability (or failure probability) and the fluctuation of the distribution parameter of the basic random variable can be obtained, which can provide an important theoretical basis for an optimized and robust Inter-story Isolation System design.
2) In the Inter-story Isolation System, the change of the stiffness and damping ratio of the Isolation Layer has a great influence on the reliability of the system. The change of this parameter will have different effects on the reliability of different parts of the system. In the design of this system, the stiffness and damping ratio values of the Isolation Layer should be strictly optimized to reduce their impact on the reliability of each part of the system.
3) Reliability sensitivity analysis results of the Inter-story Isolation Structure can provide an order of importance of structural reliability indicators for random parameter changes. For the less influential parameters, it can be used as a quantitative treatment to improve the reliability of large-scale complex structural reliability analysis and optimization design.
References
-
Helton J. C., Johnson J. D., Sallaberry C., et al. Survey of sampling-based methods for uncertainty and sensitivity analysis. Reliability Engineering and System Safety, Vol. 91, Issue 10, 2006, p. 1175-1209.
-
Au S. Reliability-based design sensitivity by efficient simulation. Computers and Structures, Vol. 83, Issue 14, 2005, p. 1048-1061.
-
Song S., Lu Z., Qiao H. Subset simulation for structural reliability sensitivity analysis. Reliability Engineering and System Safety, Vol. 94, Issue 2, 2009, p. 658-665.
-
Hohenbichler M., Rackwitz R. Sensitivity and importance measures in structural reliability. Civil Engineering System, Vol. 3, Issue 4, 1986, p. 203-209.
-
Karamchandani A., Cornell C. A. Sensitivity estimation within first and second order reliability method. Structural Safety, Vol. 11, Issue 2, 1992, p. 95-107.
-
Wu Y.-T. Computational methods for efficient structural reliability and reliability sensitivity analysis. AIAA Journal, Vol. 32, Issue 8, 1994, p. 1717-1723.
-
Robert H. S., Mark A. C. System reliability and sensitivity factors via the MPPSS method. Probabilistic Engineering Mechanics, Vol. 20, Issue 2, 2005, p. 148-157.
-
Lu Z., Song J., Song S., et al. Reliability sensitivity by method of moments. Applied Mathematical Modelling, Vol. 34, Issue 10, 2010, p. 2860-2871.
-
Wu Y. T. Computational methods for efficient structural reliability sensitivity analysis. AIAA Journal, Vol. 32, Issue 8, 1994, p. 1717-1723.
-
Lu Z., Song S., Yue Z., et al. Reliability sensitivity method by line sampling. Structural Safety, Vol. 30, Issue 6, 2008, p. 517-532.
-
Guo J., Du X. Reliability sensitivity analysis with random and interval variables. International Journal for Numerical Methods in Engineering, Vol. 78, Issue 13, 2009, p. 1585-1617.
-
Song J., Kang W. H. System reliability and sensitivity under statistical dependence by matrix-based system reliability method. Structural Safety, Vol. 31, Issue 2, 2009, p. 148-156.
-
Zhang Y. M., Liu Q. L., Wen C. B. Sensitivity of reliability in nonlinear random systems with independent failure modes. Acta Mechanica Sinica, Vol. 35, Issue 1, 2003, p. 117-120.
-
Wang X. G., Zhang Y. M., Wang B. Y. Dynamic reliability sensitivity analysis of mechanical components. Journal of Mechanical Engineering, Vol. 46, Issue 10, 2010, p. 188-192.
-
Lu H., Zhang Y. M., Zhan C. L., et al. Reliability sensitivity estimation of mechanical components with multiple failure modes. Journal of Mechanical Engineering, Vol. 48, Issue 2, 2012, p. 63-67.
-
Yuan X. K., Lv Z. Z. Reliability sensitivity algorithm and its application in fatigue failure. Chinese Journal of Computational Mechanics, Vol. 24, Issue 1, 2007, p. 69-73.
-
Valdebenito M. A., Jensen H. A., Schuëller G. I., et al. Reliability sensitivity estimation of linear systems under stochastic excitation. Computers and Structures, Vol. 92, Issue 93, 2012, p. 257-268.
-
Jun S., Zhenzhou L. Moment method based on fuzzy reliability sensitivity analysis for a degradable structural system. Chinese Journal of Aeronautics, Vol. 21, Issue 6, 2008, p. 518-525.
-
Qiao H. W., Lv Z. Z., Zhan X. P. The topology optimization design of the continuum structure based on the meshless numerical technique. Chinese Journal of Computational Mechanics, Vol. 27, Issue 2, 2010, p. 207-212.
-
Qiao H. W., Lv Z. Z. Dynamic reliability sensitivity analysis for stochastic structures under random excitations. Journal of Vibration Engineering, Vol. 21, Issue 4, 2008, p. 404-408.
-
Wu D., Wu Y., Yang Q. S., et al. Parameter sensitivity analysis of wind-induced response of long-span roofs. Engineering Mechanics, Vol. 32, Issue 2, 2015, p. 171-177.
-
Sun M., Tong L. P., Zhu Y. Z. Parameter sensitivity analysis of the earthquake input energy for rural building structures supported on sliding base-isolation systems. Engineering Mechanics, Vol. 33, Issue 5, 2016, p. 200-210.
-
Dong S. L., Zhu X. L., Tu Y., et al. Configuration, simplified calculation method and parameter sensitivity analysis on prestress distribution of honeycomb-type cable dome with two struts. Journal of Building Structures, Vol. 40, Issue 2, 2019, p. 128-135.
-
Khaneghahi M. H., Alembagheri M., Soltani N. Reliability and variance-based sensitivity analysis of arch dams during construction and reservoir impoundment. Frontiers of Structural and Civil Engineering, Vol. 13, Issue 3, 2019, p. 526-541.
-
Fu Z. F., Hua H. X. Theory and application of Modal Analysis. Shanghai Jiao Tong University Press, Shanghai, 2000.
-
Chopra Anil K. Dynamics of Structures. Fourth Edition, Prentice Hall Inc., Upper Saddle River, 2011.
-
Zhu W. Q. Random Vibration. Science Press, Beijing, 1992.
-
Isulapalli S. S., Roy A., Georgopoulos P. G. Stochastic response surface methods for uncertainty propagation: application to environmental and biological systems. Risk Analysis, Vol. 18, Issue 3, 1998, p. 351-363.
-
Hu R., Li D. Q., Zhou C. B., et al. Structural reliability analysis using stochastic response surface method. Journal of Mechanical Engineering, Vol. 27, Issue 9, 2010, p. 192-200.
-
Isukapalli S. S. An uncertainty analysis of transport transformation models. The State University of New Jersey, New Brunswick, 1999.
-
Zhang S. R., Tan P., Du Y. F., et al. Parameters optimization and energy analysis of inter-story system based on Non-dominated Sortig Genetic Algorithm with Elitism. Journal of Hefei University of Technology, Vol. 38, Issue 7, 2015, p. 949-954.
About this article

The support of the National Natural Science Foundation of China (Grant No. 51608283) and The Project of Young Scholars in the West (Grant No. XAB2017AW09) and Natural Science Foundation of Ningxia (Grant No. 2019AAC03041) are much appreciated.
Zhang Shangrong contributed to the conception of the study and performed the data analyses, and he also reviewed the manuscript. Liu Fanglan was charged in the preparation of the first draft (including substantive translation) and related work of submission. Xiao Jianqiang contributed to the substantive translation and helped perform the analysis with constructive discussions. Hu Yuchen helped perform the analysis with constructive discussions and contributed to analysis. Deng helped collate the literatures on the current research situation.
